$RIVER I haven't written anything serious for a long time, so read carefully and learn from others' mistakes. I spent an hour laying out the logic behind the moves for you — take it!
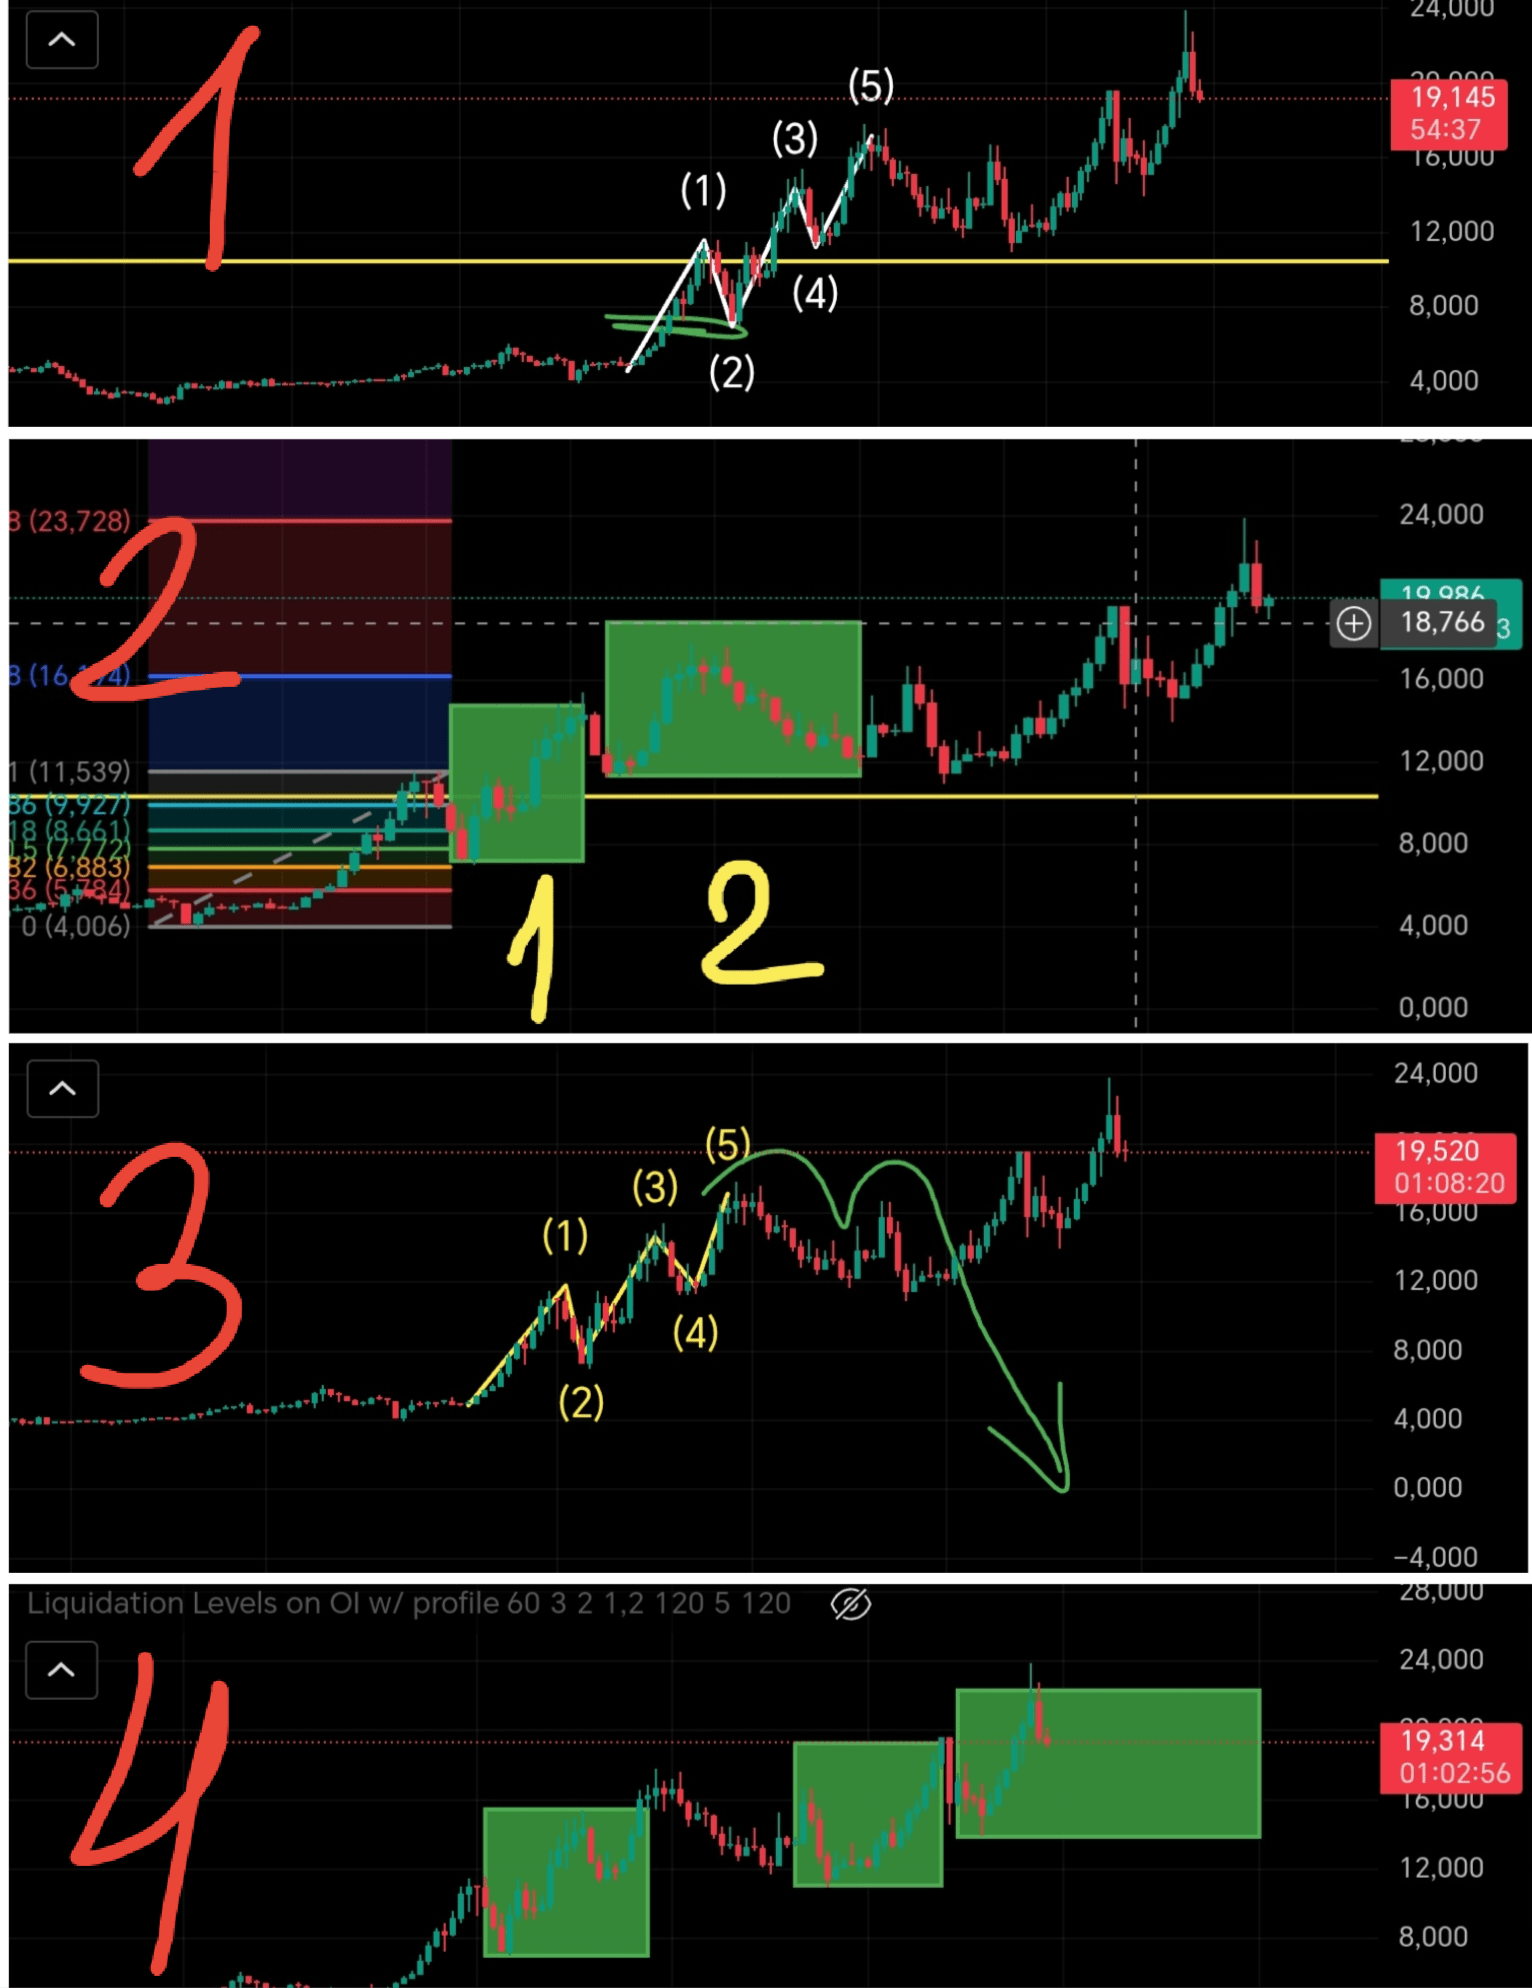
🖼 PHOTO 1: Graveyard of short sellers and the Fandango trap
Green stripe — "pain zone", where many entered short at the very beginning. People didn't believe the coin would break ATH (all-time high — yellow line), and were waiting for a drop. They weren't given a chance to exit at zero. Result: either a deep loss or liquidation. Nobody expected such a turn of events!
⚠️ Funding: In RIVER, it reached -2% per hour!
With a leverage of x10 and a margin of $100, you pay $20 per hour in fees.
In a couple of hours, there will be nothing left of the position. Leverage is your choice. Personally, I traded carefully on this coin: x3 in long and x1 in short.
🖼 PHOTO 2: The magic of the first wave and «Rectangles»
Here is the Fibonacci grid and two rectangles. What's the secret?
I measured the height of the first upward wave and made a template (rectangle) from it.
It turned out that the following waves have the same height! By simply dragging this template, you could find reversal points.
My profit: On the second rectangle, I took a LONG (12.70 — 17.50). Although the short didn't trigger then (I was waiting for 19:00, but it only reached 17.80), the long worked perfectly.
🖼 PHOTO 3: Trend reversal and the trap
After the 5th wave, a correction ABC began. The «second peak» confused many — it seemed like a drop, but it was just part of the correction.
Advice: Don't make hasty trades based on emotions. Sometimes it's better to skip the entry and get some rest. I just waited then, not fully understanding the situation.
🖼 PHOTO 4: Why were 19:00 and 22:00 the key?
Yesterday I mentioned a short from 19:00 — and once again, that very rectangle worked!
Today's action: I was waiting for a short from 20.50, but the price instantly shot through to 20.80 without triggering my order. I had to move my order higher.
In the end, positions were opened at 22:00 (top boundary of the rectangle) and 23:50 (averaging on the last drops of liquidity). The move was lightning-fast! Although I hadn't even planned that 23:50 would catch and catch so quickly.
💡 MAIN MORAL:
It's simpler than it looks. Look for logic and patterns. It doesn't work everywhere, but in clear five-wave structures — it's gold. Want to test it? Check my previous posts — all the numbers were set in advance!
📍 WHAT DO I EXPECT NOW?
Key point 18-19. Why? According to Fibonacci, the start of the next wave usually comes from the 0.5 level, which in this situation exactly falls within this range. This is both the exit point for the short and a guide for continuation.
🙏 Friends, please like 👍 and leave comments! I want to see that I didn't waste an hour of my life on this breakdown for nothing. Your activity helps others see this post, understand market logic, and stop losing money. Let's trade smart! 💎🔥
#RİVER #TechnicalAnalysis #BinanceSquare #Write2Earn


