
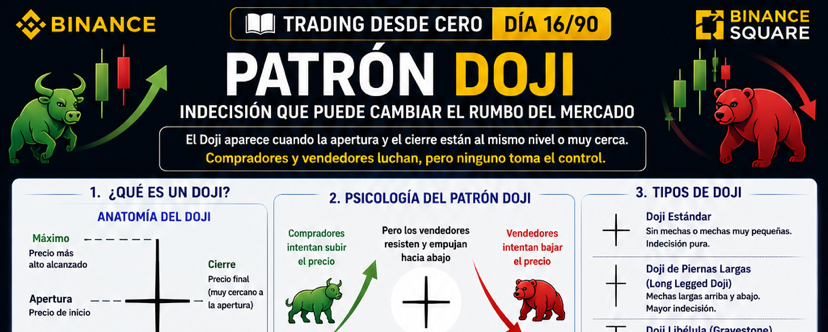
📘 Trading from Scratch – Day 16/90
➕ Doji Pattern: How to interpret a possible market indecision in bullish and bearish scenarios?
After learning how to use the Envelope Pattern, it’s time to get to know one of the most important candles in technical analysis: the Doji.
Unlike other patterns that show clear dominance by buyers or sellers, the Doji represents a moment when neither of the two forces manages to take control. This can indicate a pause, a possible continuation, or a possible trend change, depending on the context.
It’s important to remember that a Doji alone does not confirm an entry. It should always be analyzed together with the trend, supports, resistances, volume, and proper risk management.
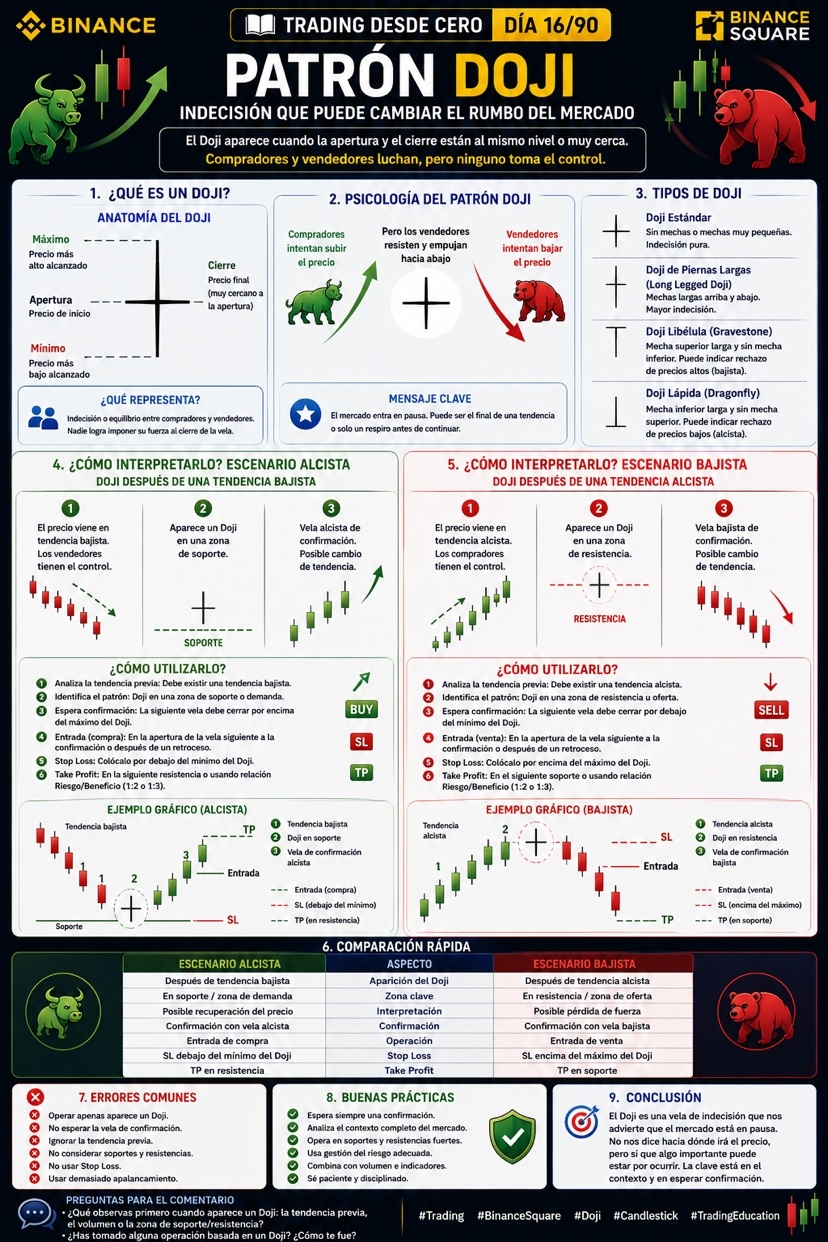
➕ What is a Doji?
A Doji is a Japanese candle whose open and close are the same or very similar.
This makes the body very small or almost nonexistent, while the wicks can vary in length.
In other words, buyers and sellers fought during that period, but neither managed to take clear control at the close.
🟢 Bullish scenario
How can it be interpreted?
If the Doji appears after a downtrend, it may indicate that selling pressure is losing strength.
Many traders wait for a bullish confirmation candle before considering a buy.
Possible management
📍 Entry: after the bullish confirmation.
🛑 Stop Loss: below the Doji’s low.
🎯 Take Profit: at the next resistance or using an appropriate Risk/Reward ratio.
Example
The price of an asset falls over several consecutive candles.
In a support area, a Doji appears.
The next candle breaks the Doji’s high and continues higher.
Some traders interpret this behavior as a possible sign of recovery.
🔴 Bearish scenario
How can it be interpreted?
If the Doji appears after an uptrend, it may indicate that buyers are starting to lose momentum.
Many traders wait for a bearish confirmation candle before considering a sell.
Possible management
📍 Entry: after the bearish confirmation.
🛑 Stop Loss: above the Doji’s high.
🎯 Take Profit: at the next support or using a favorable Risk/Reward ratio.
Example
The price rises for several hours and reaches a resistance.
A Doji forms and, afterwards, a bearish candle breaks its low.
Some traders interpret this sequence as a possible sign of buying weakness.
Quick comparison
🟢 Doji in a downtrend
🔴 Doji in an uptrend
Possible recovery.
Possible loss of momentum.
Wait for bullish confirmation.
Wait for a bearish confirmation.
Entry after confirmation.
Entry after confirmation.
Stop Loss below the Doji.
Stop Loss above the Doji.
Common mistakes
❌ Trade as soon as a Doji appears.
❌ Ignore the prior trend.
❌ Don’t wait for a confirmation candle.
❌ Trading without a Stop Loss.
❌ Base the entire decision on a single candle.
Best practices
✅ Analyze the overall context.
✅ Identify supports and resistances.
✅ Always wait for confirmation.
✅ Combine the Doji with other indicators.
✅ Respect your risk management.
Conclusion
The Doji represents a moment of balance between buyers and sellers.
When it appears after a decline, it can anticipate a possible recovery; when it appears after a rise, it can warn of a possible loss of momentum.
However, it should always be interpreted together with the market context and never as a definitive signal.
📘 On Day 17/90, we’ll learn how to identify the Morning Star and see how it can signal a possible bullish trend change.
💬 Question:
🤔 When you see a Doji candle on a chart, do you wait for confirmation before making a decision, or do you prefer to keep watching the market? Why?
#Trading #BinanceSquare #Doji #Candlestick #TradingEducation