



Bitcoin breaking above 66,000 USD is reinforcing expectations for a larger cycle bottom, but the rally still faces risks from weak liquidity and stablecoin outflows from exchanges.
Bitcoin’s breakout has shifted the market narrative from a “local bottom” to the possibility that a “macro bottom” has been formed. However, these positive technical signals still need further confirmation from new liquidity.
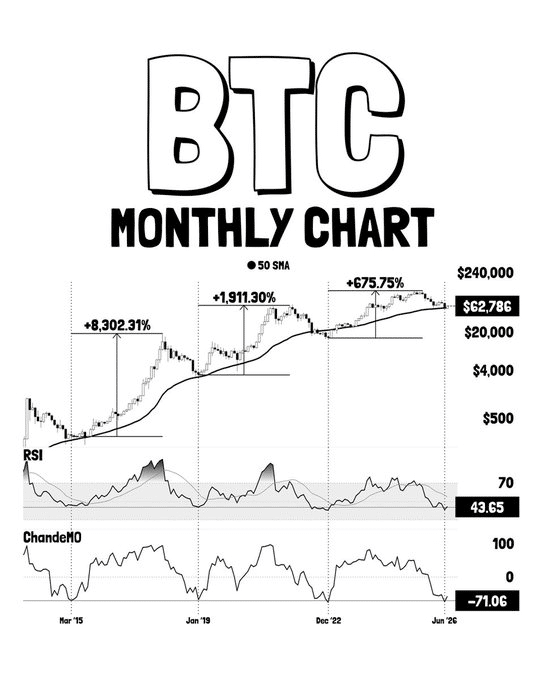
Indicator / Price level / Trend Meaning described: Bitcoin breaks above the 66,000 USD threshold. Activates optimistic psychology and expectations toward the 70,000 USD zone. Monthly RSI Around 43.65. One of three signals that have previously appeared at the bottoms of major cycles. Chande Momentum Oscillator (CMO) Around -71. Also falls within the historical cluster of signals that accompanied macro bottoms. The 50-month moving average Bitcoin trades near this level. Considered a region that often appears during phases forming long-term bottoms. The previously mentioned bottom Around 58,000 USD. The recent correction has reactivated the same set of signals. Stablecoin dominance Around 13%. Indicates a higher stablecoin share, but liquidity has not returned strongly yet. Stablecoin market cap Decreases by more than 10 billion USD within a month. Implies that capital is still being withdrawn from the market. Stablecoins have exited exchanges for 35 consecutive days. Shows a lack of replenishing force to sustain the uptrend.
Bitcoin is sending signals similar to previous cycle bottoms
Bitcoin is repeating a cluster of technical signals that appeared at prior macro cycle bottoms. This signal set includes a monthly RSI around 43.65, a CMO near -71, and the price trading close to the 50-month moving average.
The historical milestones mentioned show that this signal previously appeared around $235 in 2015, about $3,333 in early 2019, and the $16,000 area in late 2022. In each prior instance, Bitcoin then entered a major rally afterward.
The recent correction to $58,000 is also seen as a reactivation of this model. Therefore, some analysts believe the market may be shifting from a local bottom to a macro bottom.
 Source: X
Liquidity remains the biggest test for the rally
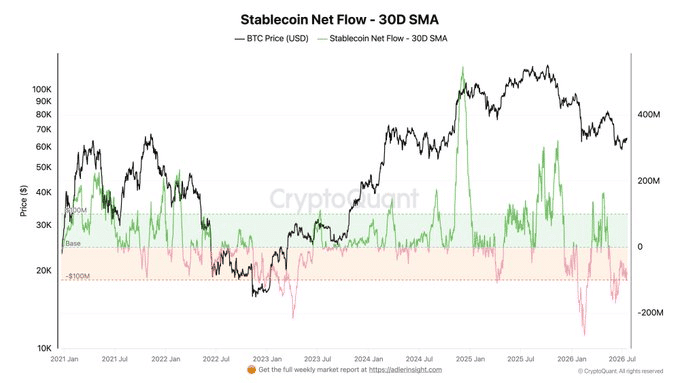
Bitcoin’s upward momentum has not been backed by new liquidity strong enough. Even though the price is holding above $65,000, signals from stablecoins and on-chain fund flows suggest the support behind the move is weakening.
Stablecoin dominance has risen to about 13%, while the total stablecoin market capitalization fell by more than $10 billion over the past month. At the same time, stablecoins have left exchanges for 35 consecutive days, while Bitcoin has not yet shown a clear increase in spot buy pressure.
That indicates the price has broken out, but liquidity has not caught up. Without new inflows, moving into the $70,000 zone may be difficult.
 Source: CryptoQuant
The $70,000 zone still needs further confirmation
Bitcoin is in a bullish technical state, but it does not yet have enough conditions to be considered a sustainable uptrend. What’s missing is new capital inflow and sufficiently strong spot accumulation.
If liquidity continues to deteriorate, the current rally could be only a short-term expansion phase. Conversely, if capital flows return to the market, the thesis of a macro bottom would become more convincing.
In the current context, Bitcoin breaking above $66,000 is a noteworthy signal, but it is not the final confirmation of a clear rally toward the $70,000 zone.
Summary
Bitcoin is getting support from technical signals that previously appeared at macro cycle bottoms, but weak liquidity and stablecoins leaving exchanges remain major obstacles. The next trend will depend heavily on whether new capital returns.
Source: https://tintucbitcoin.com/bitcoin-phat-3-tin-hieu-day-len-70-000-usd/
Thanks for reading this article!
Like, Comment, and Follow TinTucBitcoin to stay updated with the latest news about the cryptocurrency market and not miss any important information!
$BTC $ETH $BNB $XRP $SOL