
Technical Graph

Post


Crypto Sat
·
--
One of the biggest mistakes beginners make is relying on RSI alone
They see RSI below 30 and instantly buy.
Or RSI above 70 and immediately sell.
But professional traders know one thing "Momentum without trend is unreliable"
That's why RSI works best when it's combined with Moving Averages.
Moving Averages tell you where the market is likely heading.
RSI tells you when momentum supports an entry.
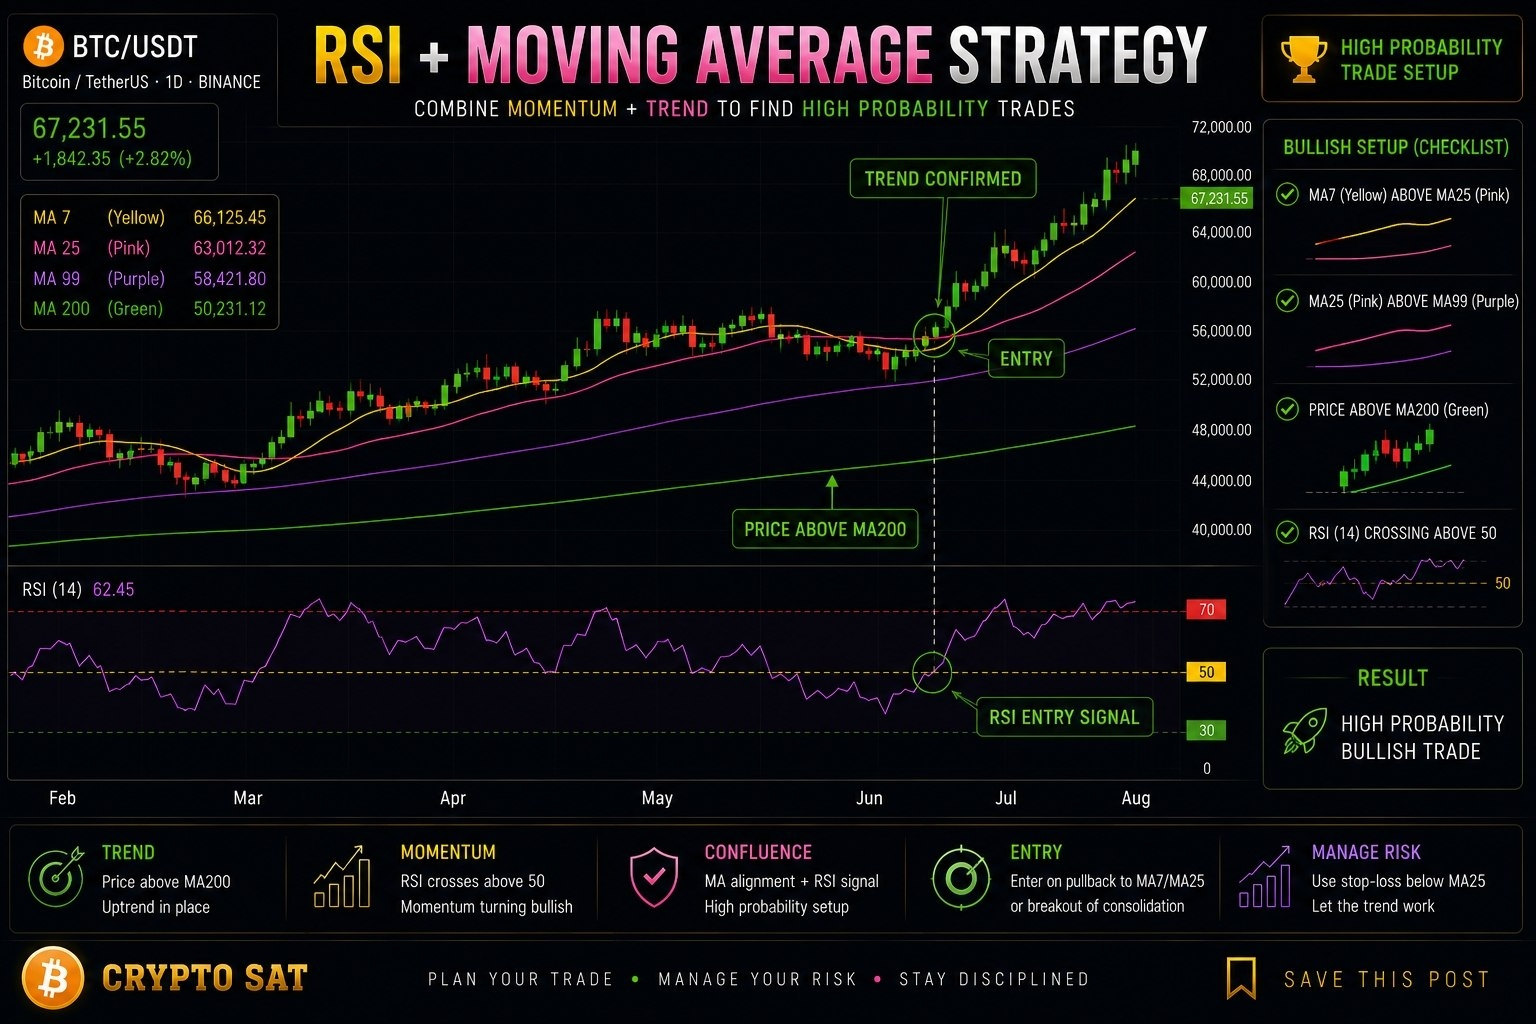
Together, they become a powerful trading system.
🔹️ Step 1: Identify the Trend
Before looking at RSI, understand the market direction.
Here's how I use Moving Averages:
▫️ MA7 = Short-term momentum
▫️ MA25 = Short-term trend
▫️ MA99 = Medium-term trend
▫️ MA200 = Overall market direction
For a healthy bullish trend, I want to see:
🟢 MA7 above MA25
🟢 MA25 above MA99
🟢 MA99 above MA200
When these MAs are aligned, buyers are controlling the market across multiple timeframes.
📈 Bullish Bitcoin Example
Imagine $BTC is trading above all four Moving Averages.
The trend is clearly bullish.
Instead of buying after a huge green candle, you wait for a pullback into MA25.
During the pullback:
▪️ RSI cools down toward 40–50
▪️ Price respects MA25
▪️ A bullish candle forms
▪️ Volume begins increasing
Now momentum and trend are aligned.
That's a much higher-probability entry than chasing the breakout.
📉 Bearish Bitcoin Example
Now imagine #BTC is trading below MA99 and MA200.
MA7 is below MA25.
The trend is bearish.
Price rallies into MA25, but RSI struggles near 50 and starts turning lower.
A bearish rejection candle appears with increasing selling volume.
This is where experienced traders look for short opportunities—not while price is already heavily oversold.
⚠️ Common Beginner Mistakes
▫️ Buying every RSI below 30
▫️ Selling every RSI above 70
▫️ Ignoring the Moving Average trend
▫️ Trading against MA200
▫️ Entering before volume confirms the move
These mistakes usually lead to low-probability trades.
They see RSI below 30 and instantly buy.
Or RSI above 70 and immediately sell.
But professional traders know one thing "Momentum without trend is unreliable"
That's why RSI works best when it's combined with Moving Averages.
Moving Averages tell you where the market is likely heading.
RSI tells you when momentum supports an entry.
Together, they become a powerful trading system.
🔹️ Step 1: Identify the Trend
Before looking at RSI, understand the market direction.
Here's how I use Moving Averages:
▫️ MA7 = Short-term momentum
▫️ MA25 = Short-term trend
▫️ MA99 = Medium-term trend
▫️ MA200 = Overall market direction
For a healthy bullish trend, I want to see:
🟢 MA7 above MA25
🟢 MA25 above MA99
🟢 MA99 above MA200
When these MAs are aligned, buyers are controlling the market across multiple timeframes.
📈 Bullish Bitcoin Example
Imagine $BTC is trading above all four Moving Averages.
The trend is clearly bullish.
Instead of buying after a huge green candle, you wait for a pullback into MA25.
During the pullback:
▪️ RSI cools down toward 40–50
▪️ Price respects MA25
▪️ A bullish candle forms
▪️ Volume begins increasing
Now momentum and trend are aligned.
That's a much higher-probability entry than chasing the breakout.
📉 Bearish Bitcoin Example
Now imagine #BTC is trading below MA99 and MA200.
MA7 is below MA25.
The trend is bearish.
Price rallies into MA25, but RSI struggles near 50 and starts turning lower.
A bearish rejection candle appears with increasing selling volume.
This is where experienced traders look for short opportunities—not while price is already heavily oversold.
⚠️ Common Beginner Mistakes
▫️ Buying every RSI below 30
▫️ Selling every RSI above 70
▫️ Ignoring the Moving Average trend
▫️ Trading against MA200
▫️ Entering before volume confirms the move
These mistakes usually lead to low-probability trades.
Disclaimer: Includes third-party opinions. No advice. Binance AI may be used without guarantee. See T&Cs.