
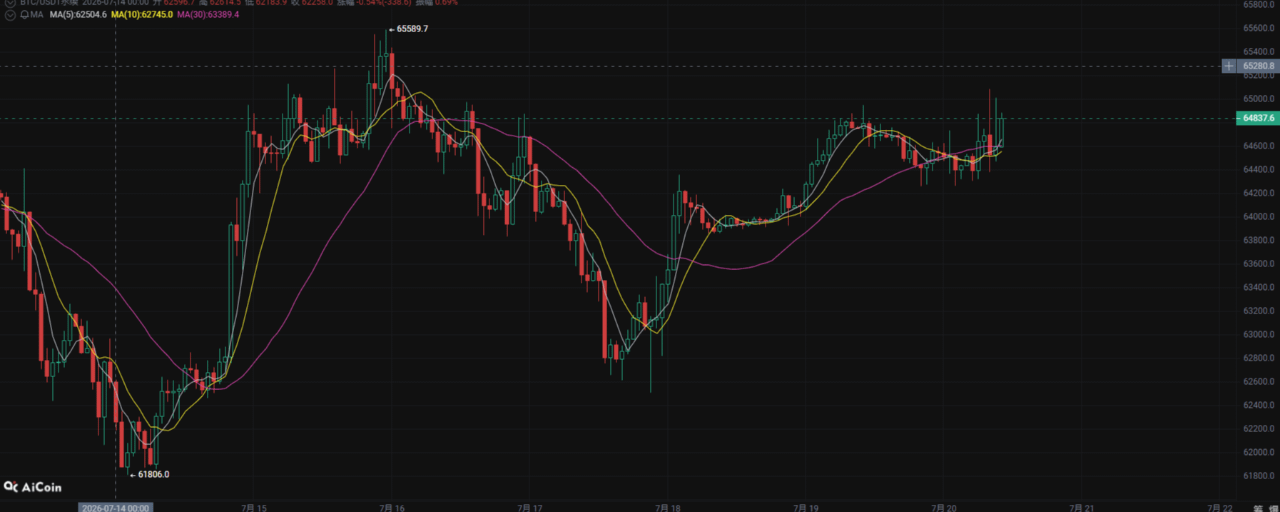
Today, the BTC price is around $64,878. From the overall candlestick structure, after an earlier sharp dip, Bitcoin received clear support near $61,800 and then started a rebound. Now the price has returned to the $64,800 area, and bullish momentum has strengthened significantly. However, from the order flow, BTC is approaching the key resistance zone of $65,000–$65,500. This area is not only near the previous highs, but also an important battleground where bulls and bears contest. Next, whether the price can break through will determine whether the short-term uptrend continues or whether a pullback and correction comes instead.
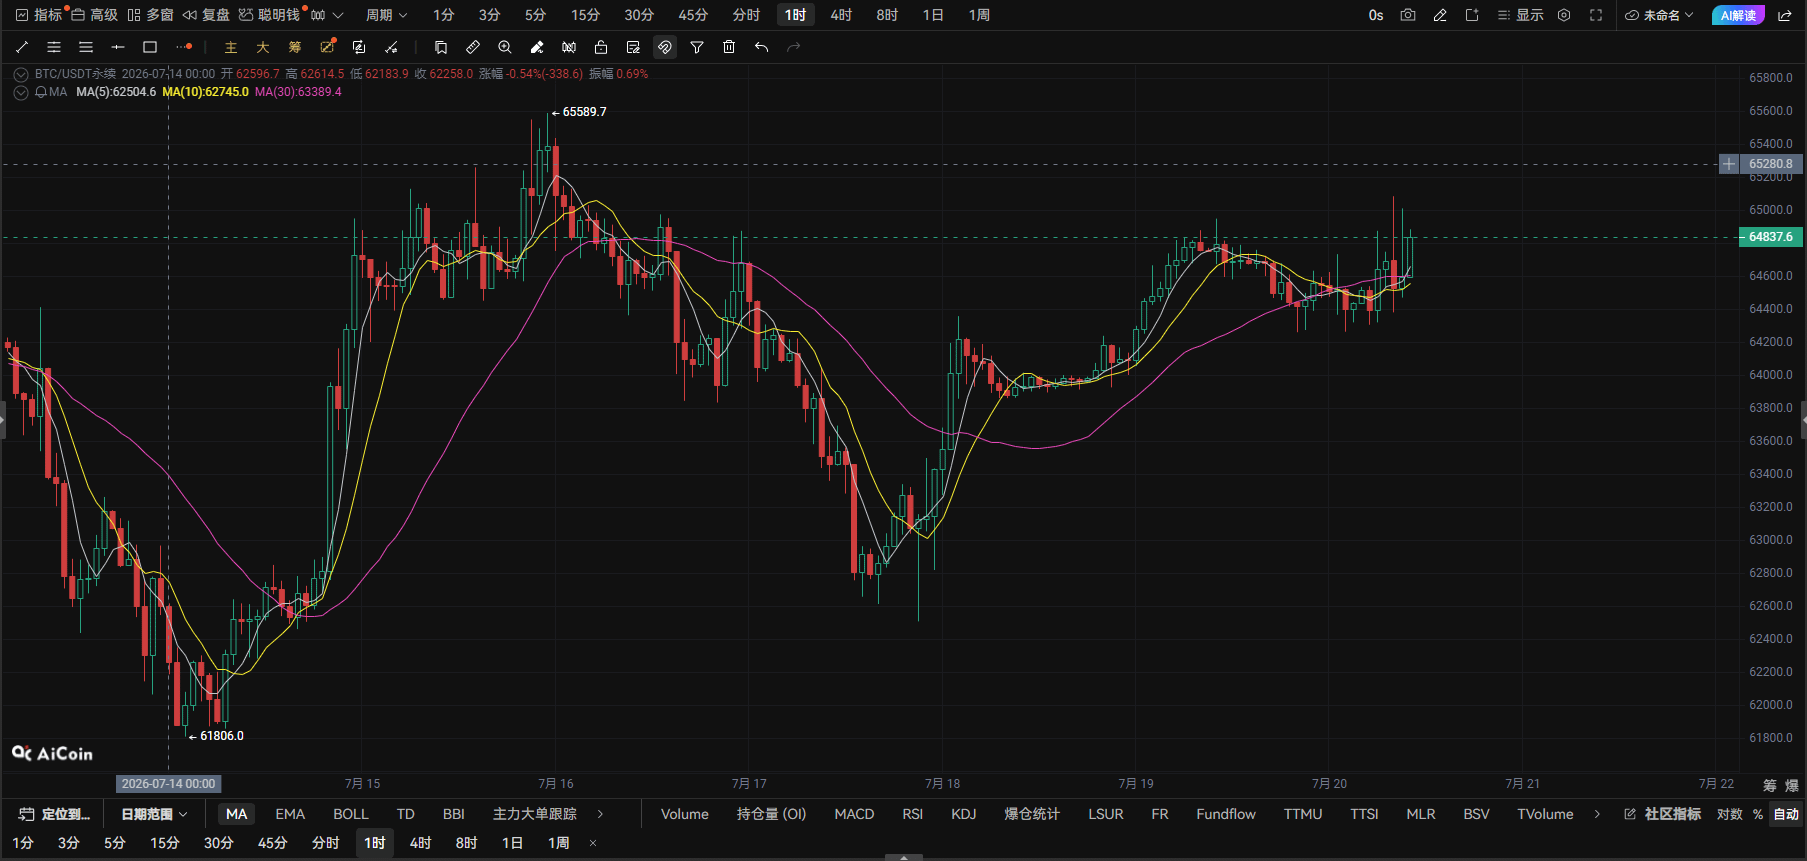
Hourly chart analysis: Based on the candlestick走势, BTC has formed a clear rebound structure in the short term. After rising steadily from the low around $61,800, it has been consolidating and moving upward. The current price is holding above $64,000. Regarding moving averages, the short-term averages are gradually diverging upward; the price remains above the moving averages, indicating that the short-term bulls are in control. However, after consecutive advances, there is some resistance in the $64,800–$65,000 area, and there is a risk that short-term profit-taking may lead to pullbacks. If the price can break above $65,000 with increased volume, there is a chance to continue pushing toward around $65,500. If the breakout fails, then the $64,000 support level will need to be watched.
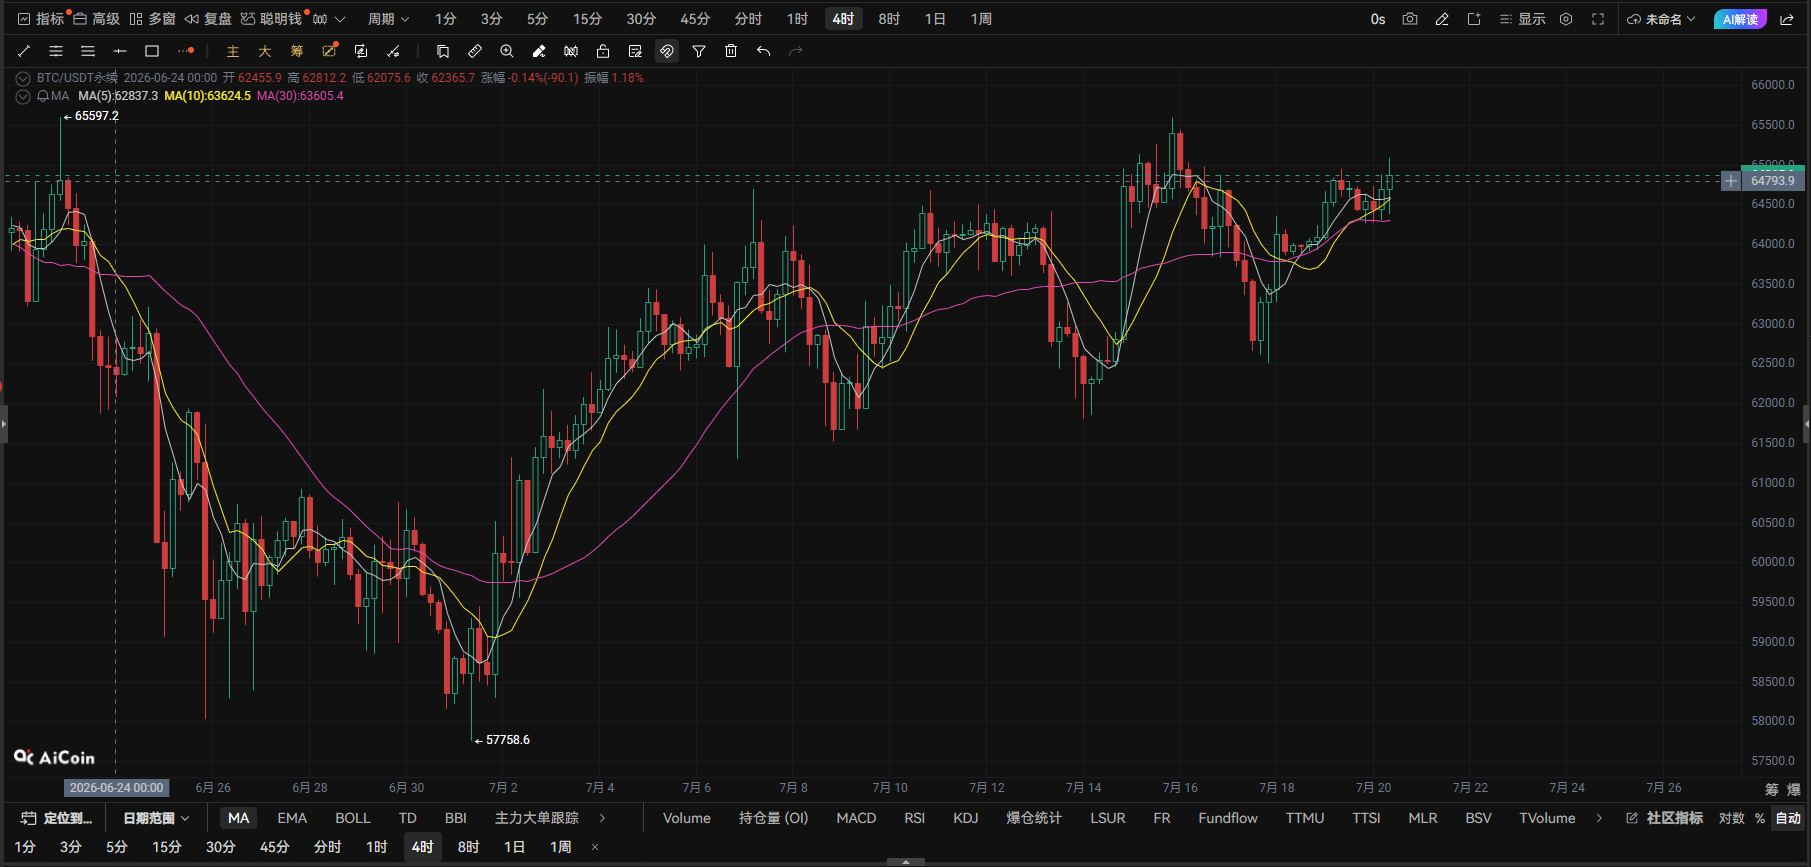
4-hour chart analysis: At the 4-hour level, after BTC stabilized and bounced from around $61,800, it has formed a V-shaped recovery. It has already reclaimed several key levels. The candlestick structure shows the lows are rising one after another, and the bullish trend is gradually recovering. The MA moving averages have also started to turn upward. However, note that there is clear trapped-holder pressure above $65,000, so the price is unlikely to break through immediately and directly. In the short term, there may be range-bound consolidation and a shakeout. If it retraces to around $64,000 and holds without breaking, it is still considered a healthy correction, and there remains room for further upside.
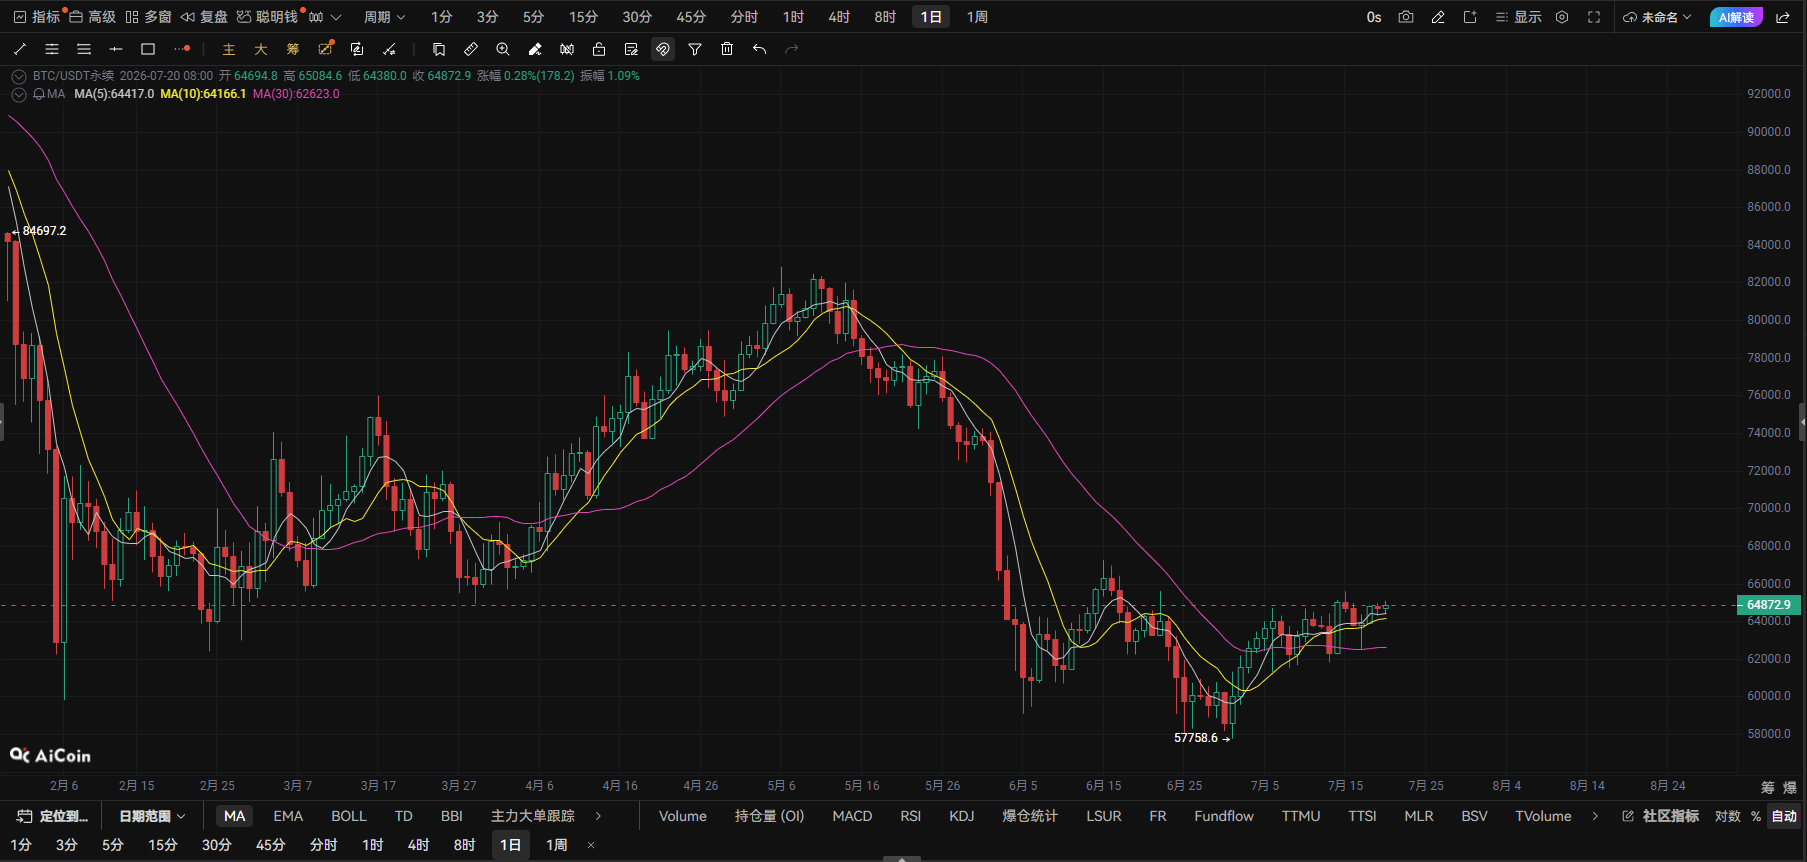
Daily chart analysis: At the daily level, BTC is currently in a large-range consolidation and repair phase. After it dropped from around $65,500 to $61,800 earlier, it rebounded quickly, indicating strong buy-side support beneath. The price has returned to around $65,000, and market sentiment has clearly improved. The key daily level to watch is $65,500. If it breaks out effectively and holds, BTC could open up new upside potential. If it is rejected again, it may pull back to the $63,000–$64,000 area for a second confirmation.
Overall, BTC’s current trend is biased toward strong repair, and the bulls have regained the short-term rhythm. But the area around $65,000 is extremely critical. It’s not recommended to chase blindly; it’s safer to wait for a retracement and confirmation, or to follow after a breakout. Today’s trading bias is: retracement to go long, because the trend has already turned stronger. For the short term, focus on the $64,000 support zone. As long as it doesn’t break, the bullish structure remains valid.
Key levels today: Resistance above at $65,000–$65,500; support below at $64,000.
Live order (open directly at current price $64,878):
Direction: Long BTC/USDT
Opening price: $64,878
Stop-loss price: $63,905
First take-profit: $65,527
Second take-profit: $66,175
Trading reminder: The current market is in a critical breakout zone. Volatility may increase significantly. Strictly control position sizing. Setting a stop-loss based on the predicted direction matters more. Technical analysis is used to improve trading probability and does not mean the market will definitely follow expectations.