

Daily sharing
A few days ago, the big pie surged up to 65,600 and then immediately started a small-timeframe pullback, which indicates there is still fairly heavy resistance overhead. After that, it went from 65,600 to 62,537 in a 1h-level pullback. The pullback did not break below 61,800, so in the short term there is still a chance to push up again toward the 65,600 area or even above it.
So right now, it’s still playing out this 1h-level rebound; for the short term, just watch the strength of the next push up again.
Judging from the structure and the runtime, this rebound at the 4h level has been going for 19 days. The internal structure is divergent, so it’s more likely that next week will start the next 4h-level decline. For the downside target, you can look at 60,500 and whether it breaks below 59,000.
Medium-to-short-term trend direction
4h cycle main direction: We are still going through a 4h-level rebound. Watch whether it can end tomorrow
1h direction: We have already completed the 7th 1h-level rebound. Looking for upside strength
BTC short-term
Because market conditions change quickly in the short term, the article can only make a prediction about how the market will change at the moment it is published. Short-term traders should pay attention to the latest market changes—use this only as a reference.
1H:
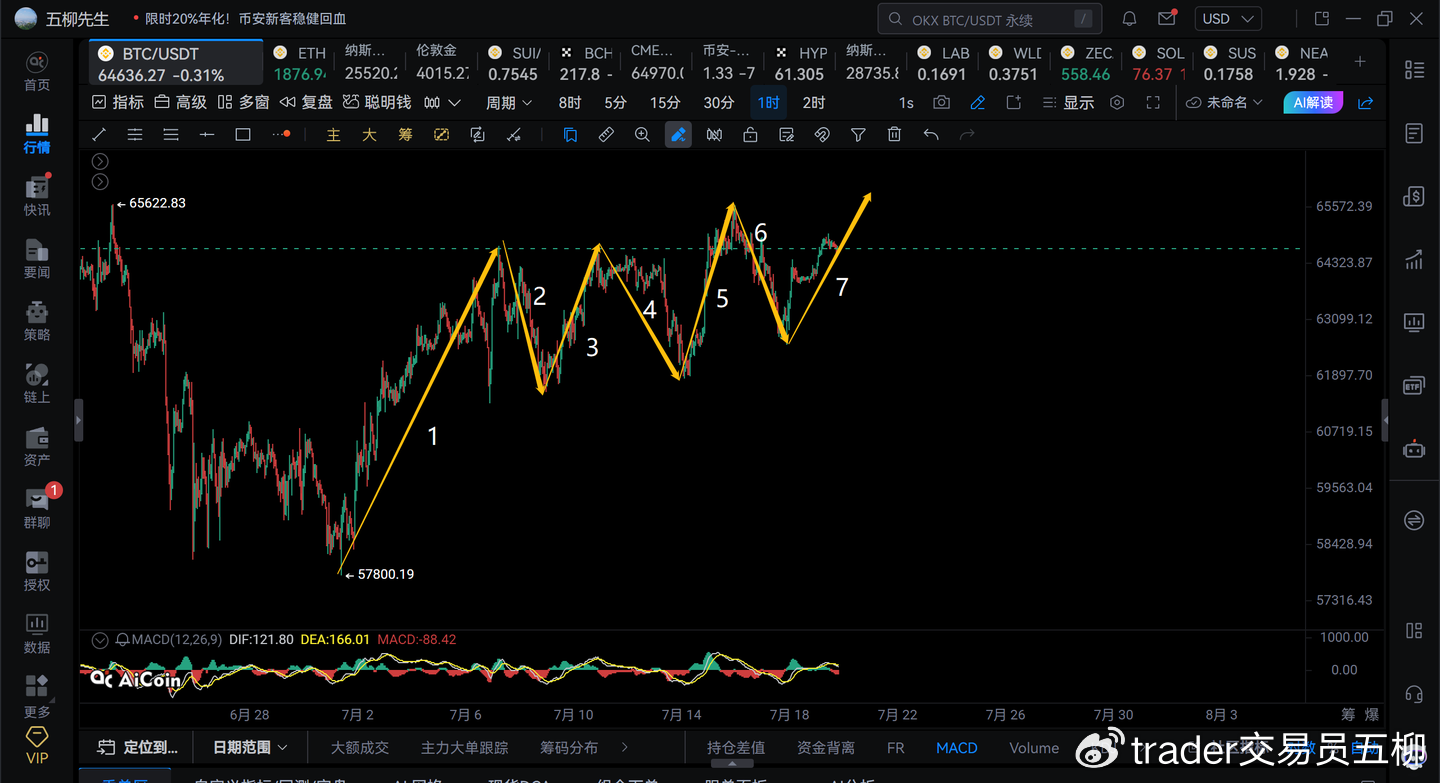
1)On the 1h timeframe: in the overall 4h-level rebound of the BTC, 7 segments have already formed internally. We are currently in the 7th 1h-level rebound. This rebound probably has not finished yet. On the upside, watch the 65,500~66,000 range.
2)The expected upside strength here is not big. As the momentum has been steadily weakening, first watch whether 66,000 breaks through; once it breaks, then consider the area around 67,000
3)After the 7th upward leg finishes, we should start a new 4h-level decline. This basically matches our expectation for a 4h-level decline in the late part of this month. After the 4h-level decline plays out, observe whether it will continue making new lows or whether it will produce a second sell (二买)
4)The benefit of using Chan theory is that we know price action runs in a sequence of segments and structures. Some analyses only tell you where it may rise to, but not how long this “upward move” will last, nor whether there will be a major pullback in the middle. Many analysis methods don’t have that. If you don’t use structure to estimate the future走势, then it’s easy to only realize a stage pullback is coming after price has already dropped a lot.
15M:
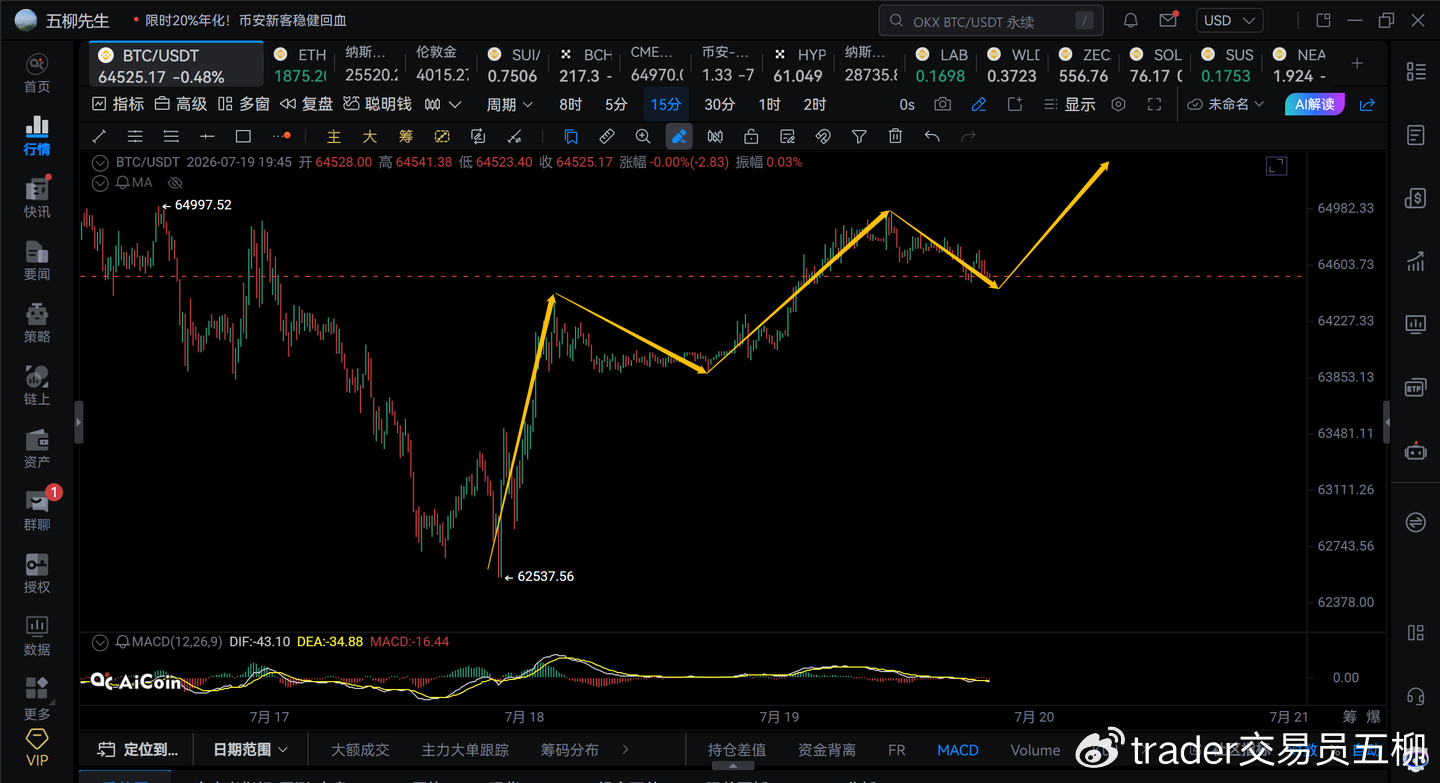
1)On the 15-minute timeframe: the pullback of the 3rd 15-minute segment is still in progress here. If the short-term price does not drop below 64,000, then the next move should still be the 5th 15-minute timeframe rebound, before pushing up for another wave toward 65,500.
2)If on the short term price breaks below 64,000 again, then consider that the 1h-level rebound may be ending early, and a 4h-level decline second sell (二卖) may appear
ETH
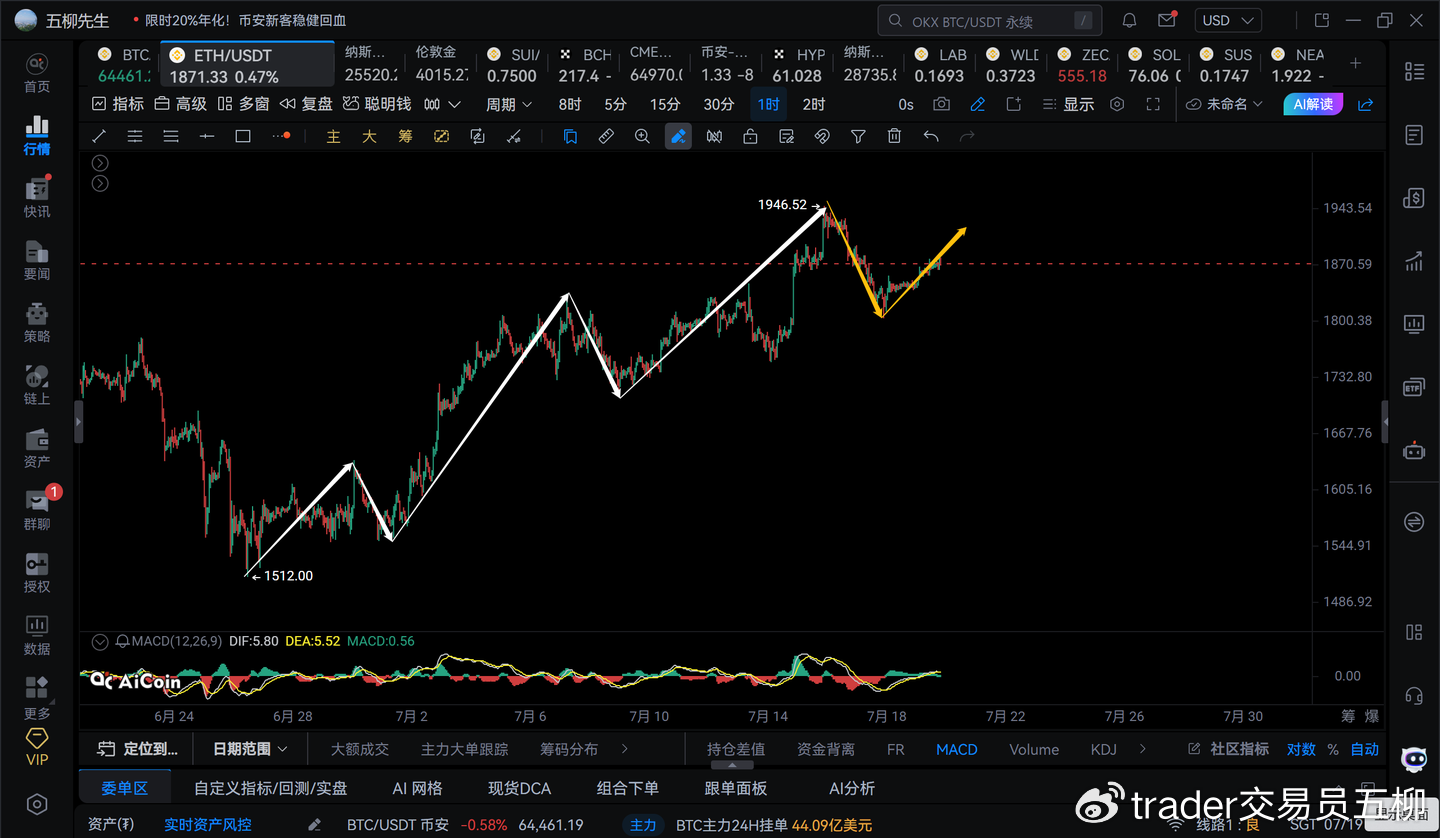
1)The 4h rebound that started from 1512 for ETH may be ending early. On the short term, the 1h rebound that began on July 17 at 1803 is very likely unable to break above 1,946—take the second sell (二卖).
2)For the current 1h-level rebound, on the short term it may still move upward a bit more. On the upside, it’s not sure whether it can touch the 1,900 area again
3)If it breaks back below 1,840 again, then we consider that this 1h-level rebound may be ending early, and a second sell signal for the 4h decline has been issued
4)In the late July 4h timeframe sell-off, for ETH first focus on the 1,600~1,700 range. If it breaks below 1,600, then consider heading toward around 1,350