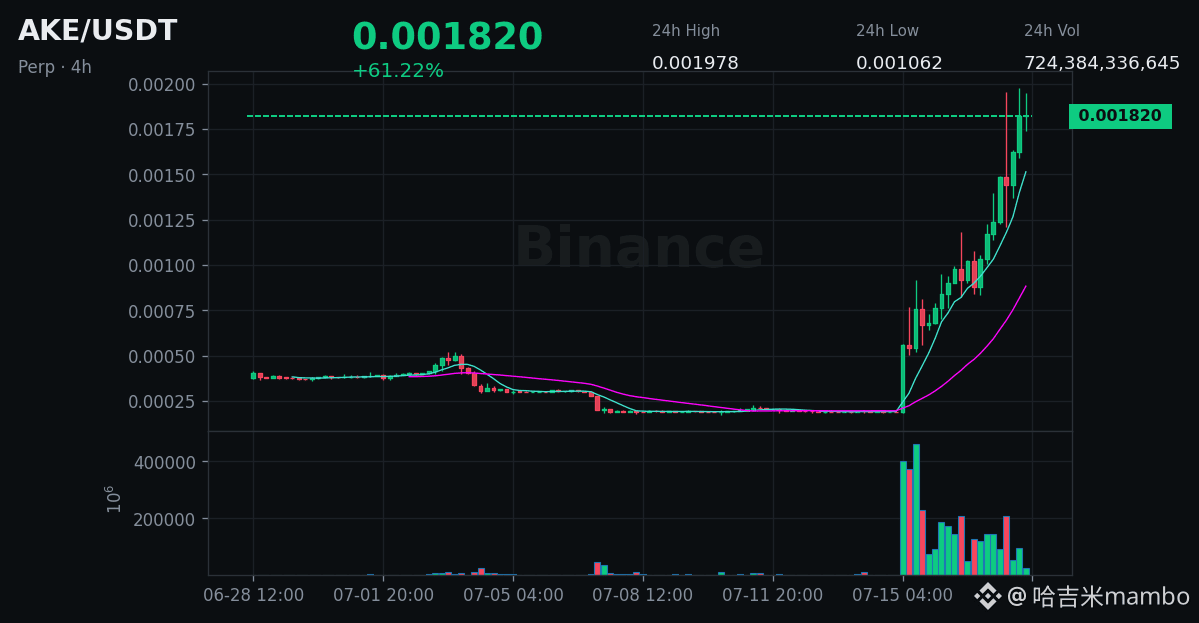
0.0018, up 56%, trading volume approaching $1B, ranking 7th. $AKE —this thing was still hovering around 0.0011 about 24 hours ago, and now it’s directly pushed up to 0.002.
But what really makes me uncomfortable watching the chart isn’t how much it’s up—it’s the level. Bulls are holding their ground, bears are betting, and both sides are waiting for the other to back down first. First, look at positions: $54.30M, up 22% in 24 hours, but down 1.5% in the last hour. What does that mean? New long orders are coming in, but total open interest is still being pushed upward—someone is buying at low prices while someone is dumping at high prices. Funding rate is 0.0515%, with longs paying for 8 straight periods. At this rate, it’s already close to the liquidation line for small-cap coins. The long positions’ cost basis is climbing rapidly; every extra hour someone holds longs is like paying protection money to the shorts.
Next, the market structure: from 0.00019 to 0.002, that’s up 932%. RSI14 is 86.4—severely overbought on a daily timeframe. MACD histogram: 0.00019, momentum is narrowing—this is a high-level exhaustion signal. Last time, someone called it bearish at this level, and it still got pumped from 0.00084 all the way to 0.00196—nearly a double. After the house washed the market, it kept pumping; this script has played out once already.
But this time is different. The 0.002 level is the all-time high. Will it break through, or is it a double top? Watch the volume. If next there’s a volume contraction pullback to 0.0016–0.0017, it means the bulls are still in control; if it spikes in volume and breaks through 0.0015 to the downside, then all the earlier rally was distribution.
Who’s the most uncomfortable? Those who went long at 0.0013–0.0015—they’re watching unrealized profits double but haven’t exited. And those who chased at 0.0018—just entering and immediately facing a 0.0515% funding-rate burn. What about the shorts? They’ve been holding from 0.0008 all the way to 0.002—liquidated countless rounds already—and they still dare to open?
$AKE
#多空博弈 #异动 # historical high
But what really makes me uncomfortable watching the chart isn’t how much it’s up—it’s the level. Bulls are holding their ground, bears are betting, and both sides are waiting for the other to back down first. First, look at positions: $54.30M, up 22% in 24 hours, but down 1.5% in the last hour. What does that mean? New long orders are coming in, but total open interest is still being pushed upward—someone is buying at low prices while someone is dumping at high prices. Funding rate is 0.0515%, with longs paying for 8 straight periods. At this rate, it’s already close to the liquidation line for small-cap coins. The long positions’ cost basis is climbing rapidly; every extra hour someone holds longs is like paying protection money to the shorts.
Next, the market structure: from 0.00019 to 0.002, that’s up 932%. RSI14 is 86.4—severely overbought on a daily timeframe. MACD histogram: 0.00019, momentum is narrowing—this is a high-level exhaustion signal. Last time, someone called it bearish at this level, and it still got pumped from 0.00084 all the way to 0.00196—nearly a double. After the house washed the market, it kept pumping; this script has played out once already.
But this time is different. The 0.002 level is the all-time high. Will it break through, or is it a double top? Watch the volume. If next there’s a volume contraction pullback to 0.0016–0.0017, it means the bulls are still in control; if it spikes in volume and breaks through 0.0015 to the downside, then all the earlier rally was distribution.
Who’s the most uncomfortable? Those who went long at 0.0013–0.0015—they’re watching unrealized profits double but haven’t exited. And those who chased at 0.0018—just entering and immediately facing a 0.0515% funding-rate burn. What about the shorts? They’ve been holding from 0.0008 all the way to 0.002—liquidated countless rounds already—and they still dare to open?
$AKE
#多空博弈 #异动 # historical high