$BTC #btc #bullish
BTC 15-Minute Technical Observation
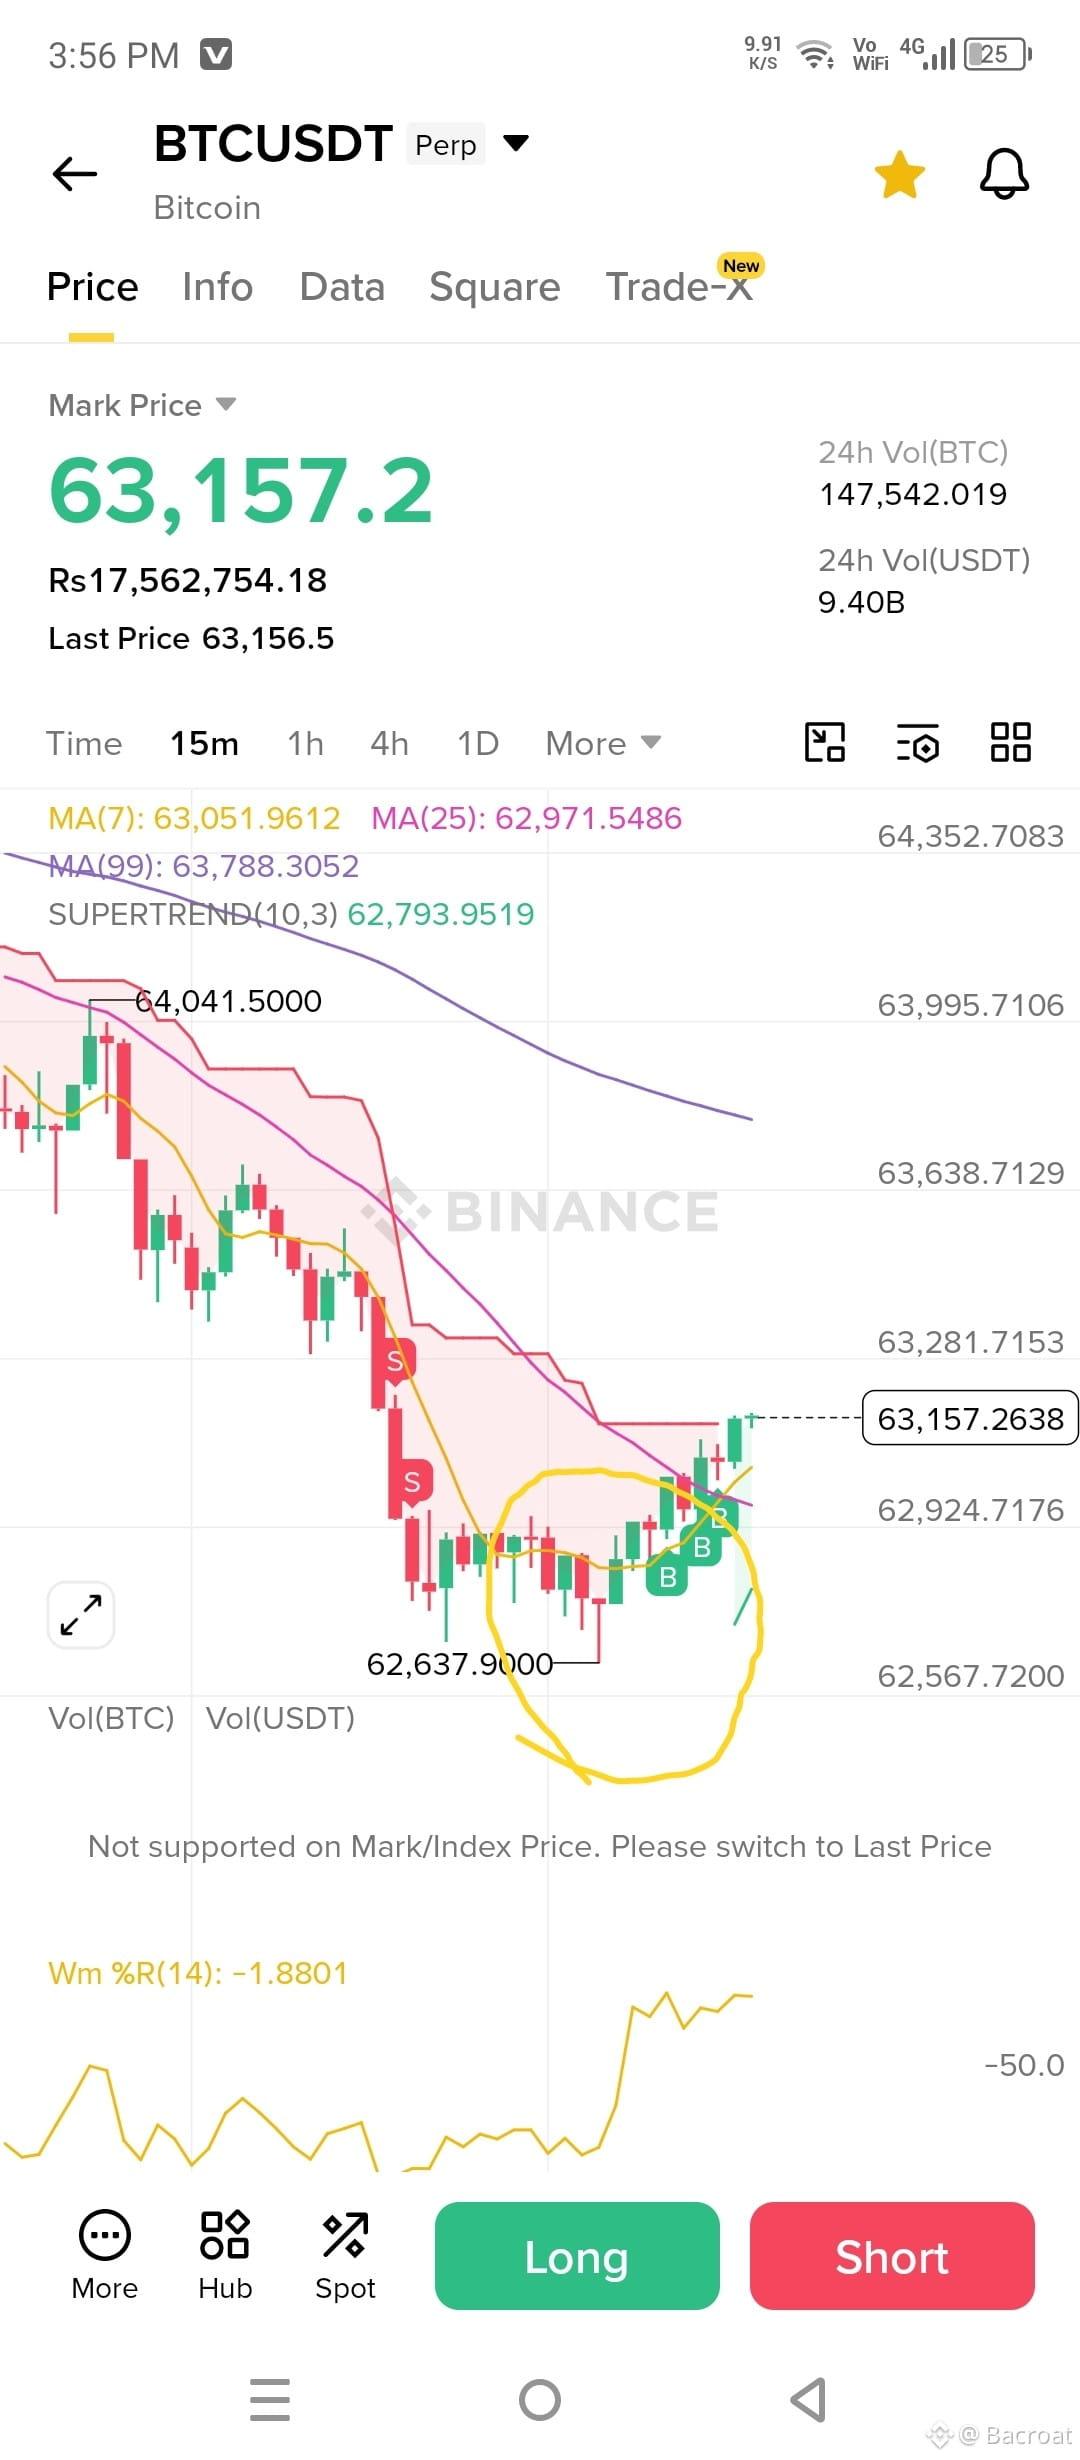
Bitcoin has formed a dragonfly doji on the 15-minute timeframe, indicating a notable intraperiod rejection of lower prices. During the session, sellers were able to push price materially lower, but buying interest emerged and lifted the market back toward the opening level by the close. This type of candle structure typically reflects demand absorption at lower levels and may suggest that short-term downside momentum is weakening.
From a technical perspective, the signal should not be interpreted in isolation. On a lower timeframe such as 15 minutes, the dragonfly doji is most relevant when it develops near a well-defined support zone, following an extended intraday decline, and is supported by increased trading volume or subsequent bullish price confirmation.
The key factors to monitor now are:
whether the low of the doji remains protected as near-term support,
whether price can establish follow-through above immediate resistance,
whether momentum indicators begin to stabilize or turn higher,
and whether broader market structure aligns with a recovery scenario.
In summary, the candle suggests a potential short-term reversal attempt, but confirmation remains essential before assigning higher conviction to a bullish interpretation.
BTC 15-Minute Technical Observation
Bitcoin has formed a dragonfly doji on the 15-minute timeframe, indicating a notable intraperiod rejection of lower prices. During the session, sellers were able to push price materially lower, but buying interest emerged and lifted the market back toward the opening level by the close. This type of candle structure typically reflects demand absorption at lower levels and may suggest that short-term downside momentum is weakening.
From a technical perspective, the signal should not be interpreted in isolation. On a lower timeframe such as 15 minutes, the dragonfly doji is most relevant when it develops near a well-defined support zone, following an extended intraday decline, and is supported by increased trading volume or subsequent bullish price confirmation.
The key factors to monitor now are:
whether the low of the doji remains protected as near-term support,
whether price can establish follow-through above immediate resistance,
whether momentum indicators begin to stabilize or turn higher,
and whether broader market structure aligns with a recovery scenario.
In summary, the candle suggests a potential short-term reversal attempt, but confirmation remains essential before assigning higher conviction to a bullish interpretation.