Bitcoin Stoch+RSI on the monthly chart: historic ironclad law—or could history repeat?!
The bottom of this bear market is very likely to be in October!
By combining the Bitcoin monthly chart with the Stoch+RSI indicators, the price action shows an extremely regular historical “mirror,” worth a deep retrospective analysis.
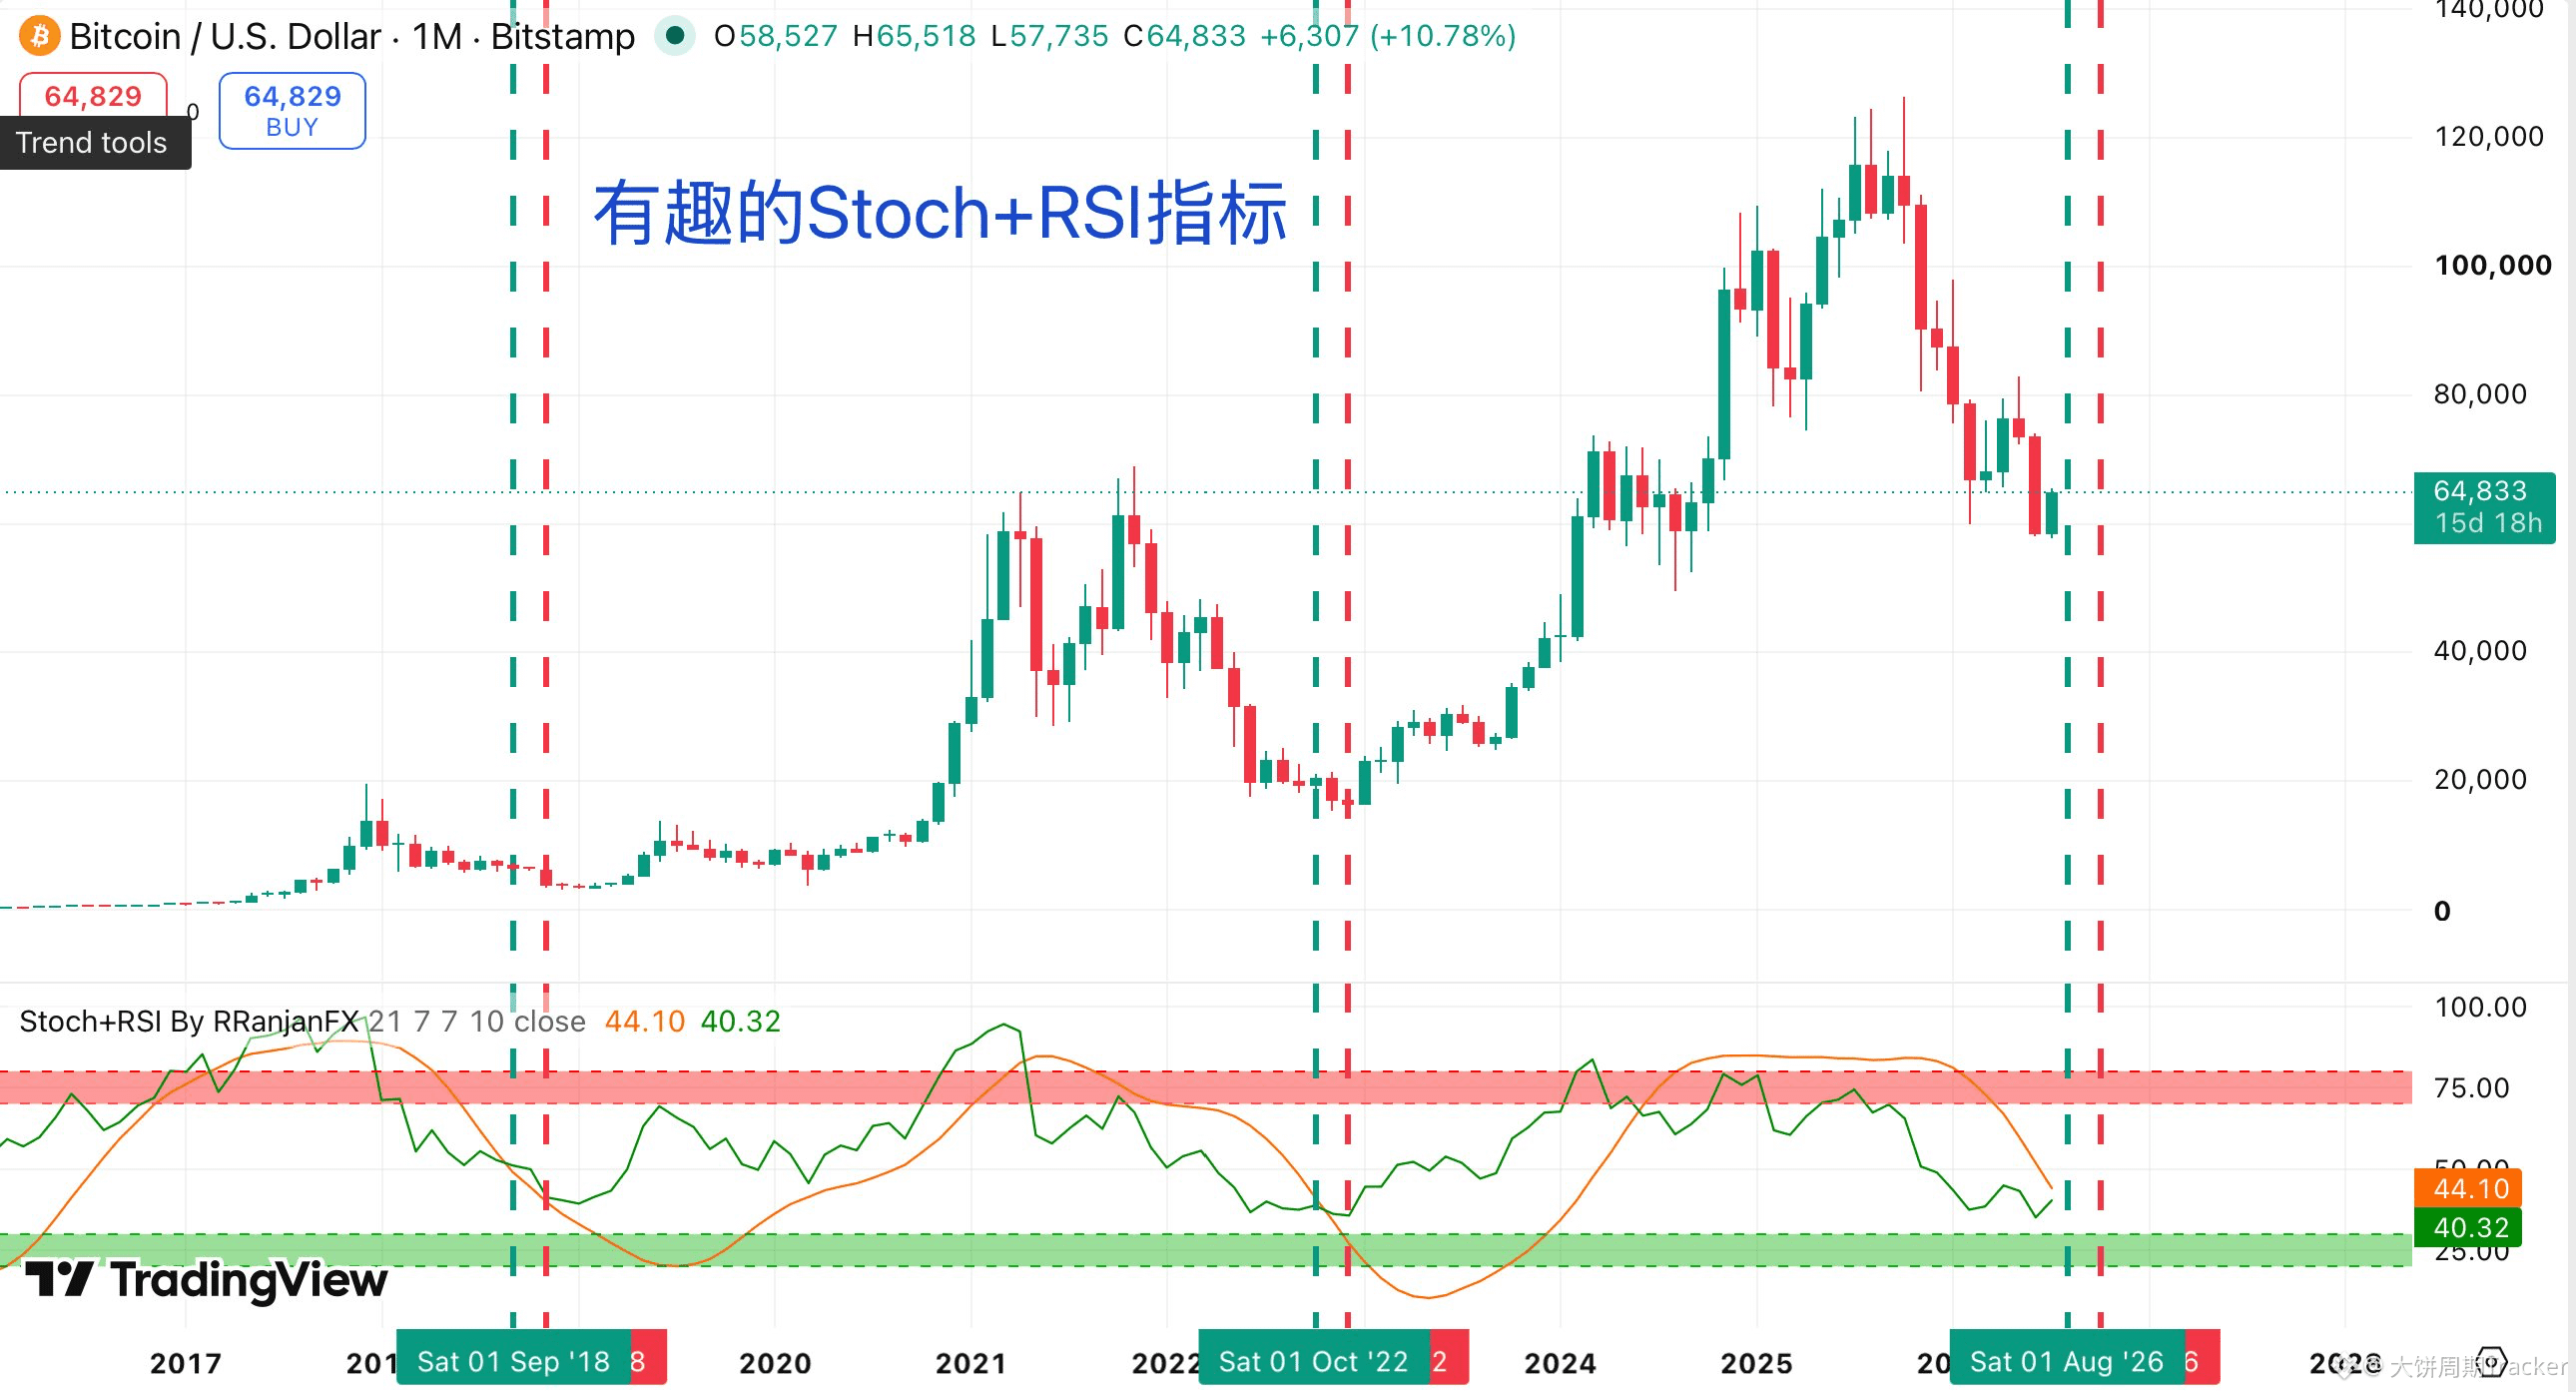
First, take a look at this big monthly chart:
In Bitcoin’s complete cycles from 2017 to today, the Stoch+RSI indicator (the green line is Stoch, and the orange line is the RSI smoothed line) has produced two clearly identifiable signals where the orange line crosses below the green line. Each time, it accurately corresponds to the time window when the bear-market bottom forms.
First time (bear market in 2018): The orange line crosses below the green line around November 2018. Then, the 2nd monthly candlestick (roughly around January 2019) marks when Bitcoin touches the cycle bottom, kicking off a multi-month base-building rebound.
Second time (bear market in 2022): The orange line crosses below the green line again around December 2022. The 2nd monthly candlestick, around February 2023, sees Bitcoin form another historical major bottom, followed by the super bull market of 2023–2024.
In both bear markets, the timing is highly consistent: after the orange line crosses below the green line, the 2nd monthly candlestick is the bottom. This is not a coincidence. On the monthly timeframe, Stoch+RSI reliably captures oversold extremes— the orange line represents RSI downward momentum, while the green line (Stoch) reflects the critical point of the oversold reversal. After the two lines cross, the market typically completes its final wave of capitulation and then enters a reversal build-up phase.
What about now? As can be clearly seen in the chart, in August 2026 the orange line is about to cross below the green line (the current green line is still falling from a high level while the orange line is accelerating downward). According to historical patterns:
August will complete the crossover
The 2nd monthly candlestick corresponds to around October 2026
This suggests that October will very likely become the final bottom zone for this Bitcoin bear market. Current price is about $64,873, and it has already pulled back significantly from the historical high. With the macro environment gradually shifting (the Fed’s rate-cut cycle, institutions accumulating coins, and the post-halving effect), once the bottom is confirmed, the upside potential is worth期待.
Friends, what do you think? Will it bottom in October, or is there still a lower move? Feel free to discuss rationally in the comments.
Data is based on publicly available charts only, for learning and交流 purposes. It does not constitute investment advice.
The bottom of this bear market is very likely to be in October!
By combining the Bitcoin monthly chart with the Stoch+RSI indicators, the price action shows an extremely regular historical “mirror,” worth a deep retrospective analysis.
First, take a look at this big monthly chart:
In Bitcoin’s complete cycles from 2017 to today, the Stoch+RSI indicator (the green line is Stoch, and the orange line is the RSI smoothed line) has produced two clearly identifiable signals where the orange line crosses below the green line. Each time, it accurately corresponds to the time window when the bear-market bottom forms.
First time (bear market in 2018): The orange line crosses below the green line around November 2018. Then, the 2nd monthly candlestick (roughly around January 2019) marks when Bitcoin touches the cycle bottom, kicking off a multi-month base-building rebound.
Second time (bear market in 2022): The orange line crosses below the green line again around December 2022. The 2nd monthly candlestick, around February 2023, sees Bitcoin form another historical major bottom, followed by the super bull market of 2023–2024.
In both bear markets, the timing is highly consistent: after the orange line crosses below the green line, the 2nd monthly candlestick is the bottom. This is not a coincidence. On the monthly timeframe, Stoch+RSI reliably captures oversold extremes— the orange line represents RSI downward momentum, while the green line (Stoch) reflects the critical point of the oversold reversal. After the two lines cross, the market typically completes its final wave of capitulation and then enters a reversal build-up phase.
What about now? As can be clearly seen in the chart, in August 2026 the orange line is about to cross below the green line (the current green line is still falling from a high level while the orange line is accelerating downward). According to historical patterns:
August will complete the crossover
The 2nd monthly candlestick corresponds to around October 2026
This suggests that October will very likely become the final bottom zone for this Bitcoin bear market. Current price is about $64,873, and it has already pulled back significantly from the historical high. With the macro environment gradually shifting (the Fed’s rate-cut cycle, institutions accumulating coins, and the post-halving effect), once the bottom is confirmed, the upside potential is worth期待.
Friends, what do you think? Will it bottom in October, or is there still a lower move? Feel free to discuss rationally in the comments.
Data is based on publicly available charts only, for learning and交流 purposes. It does not constitute investment advice.