Discover nine key metrics to analyze bank health: Equity, ROA, ROE, NPL, CAR, and more.
A bank health check is a comprehensive assessment of a bank's financial condition, performance and risk management practices. It is conducted by banking regulators or independent auditors to assess a bank's ability to withstand adverse economic conditions and potential risks, including credit risk, market risk, liquidity risk and funding risk.
A bank's financial statements, including its balance sheet, income statement and cash flow statement, as well as its risk management approach, are usually thoroughly examined as part of a health check.
Here are nine basic indicators for analyzing a bank's health.
Why are health checks important?
Performing bank health checks is important because it enables regulators and stakeholders to assess a bank's financial stability and operational efficiency. This enables prompt action to mitigate these risks and helps detect potential dangers and vulnerabilities that could undermine a bank's performance. In addition, it supports financial sector stability and maintains public confidence in the banking system.
During the 2007-2008 Global Financial Crisis (GFC), several bad practices led to the collapse of the global financial system. For example, banks and financial institutions provided loans to high-risk borrowers with poor credit histories, resulting in a large number of loan defaults. These subprime mortgages were packaged into complex financial instruments and sold to investors as high-yield securities, which eventually led to the collapse of the real estate market.
The second largest bank failure in U.S. history occurred on March 10, 2023, when Silicon Valley Bank (SVB) collapsed following a bank run, surpassing the largest bank failure since the 2008 financial crisis. During a period of near-zero interest rates, SVB invested heavily in U.S. government bonds, believing them to be a safe investment. However, this strategy backfired when the Federal Reserve began to aggressively raise interest rates to curb inflation. As interest rates climbed, bond prices fell, causing the value of SVB's bond portfolio to decline and eventually collapse.
The lack of proper regulatory oversight has allowed financial institutions to engage in risky behavior without adequate checks and balances. Therefore, good risk management practices are key to the financial health of banks and the effectiveness of the global financial system.
Key indicators for assessing the health of banks
Metrics that can provide unique insights into a bank’s financial health and performance are discussed below.
Economic Value of Equity (EVE)
The economic value of equity is a measure of the long-term value of a financial institution's equity, taking into account the present value of its assets and liabilities. It represents the amount of equity that would remain after all assets and liabilities were liquidated and all obligations were met. EVE is a commonly used measure when calculating the interest rate risk in the banking book (IRRBB), which banks must use to measure IRRBB.
The Federal Reserve requires regular assessments of EVE. In addition, the Basel Committee on Banking Supervision recommends stress testing all interest rates at plus or minus 2%. The 2% stress test is a recognized standard for measuring interest rate risk.
The calculation formula of EVE is as follows:

For example, suppose a bank has a market value of $10 million in equity, the present value of expected future cash flows from assets is $15 million, and the present value of expected future cash flows from liabilities is $12 million. Using the EVE formula, the economic value of the equity can be calculated as follows:
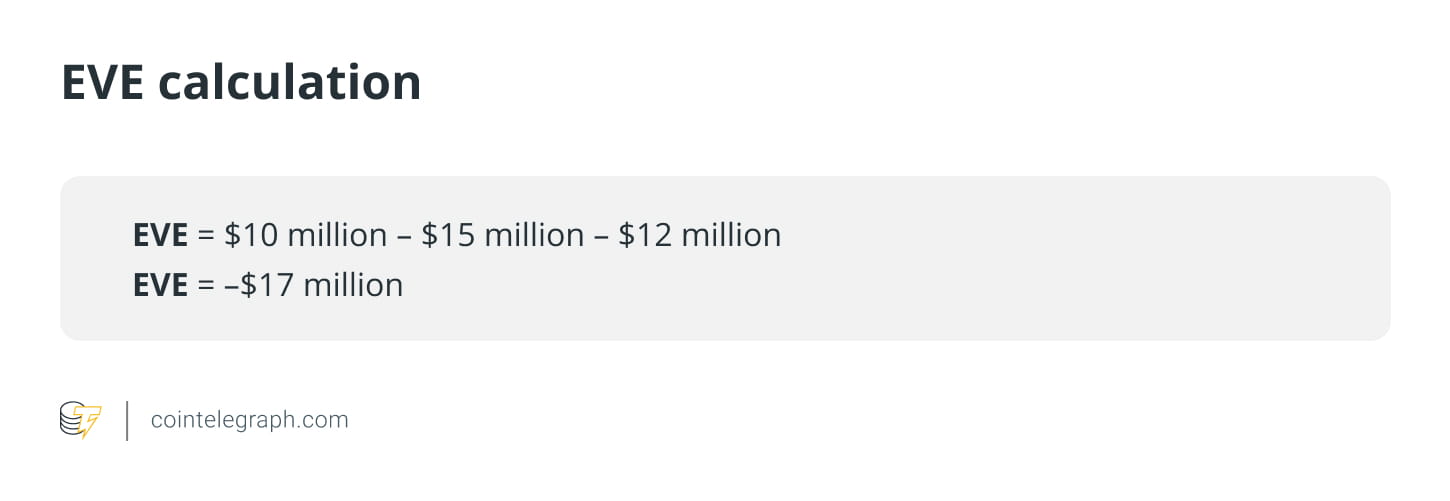
Negative EVE indicates that the bank needs more funds to meet its obligations because its liabilities exceed its assets. Therefore, the bank's long-term financial stability and ability to meet its obligations may be seriously impaired. Therefore, the bank must take corrective measures to improve the value of its economic equity and reduce interest rate risk.
Net Interest Margin (NIM)
This represents the difference between the interest income and expenses of a bank. It illustrates the bank's ability to make money from its assets (loans, mortgages, etc.) in relation to its funding costs (deposits, borrowing, etc.).
Let's take the example of a bank that has the following financial data for a given year:
Interest income from loans and securities: $10 million
Interest paid to depositors and creditors: $5 million
Total assets: $500 million
Total liabilities: $400 million.
Using this information, the bank's NIM can be calculated as follows:
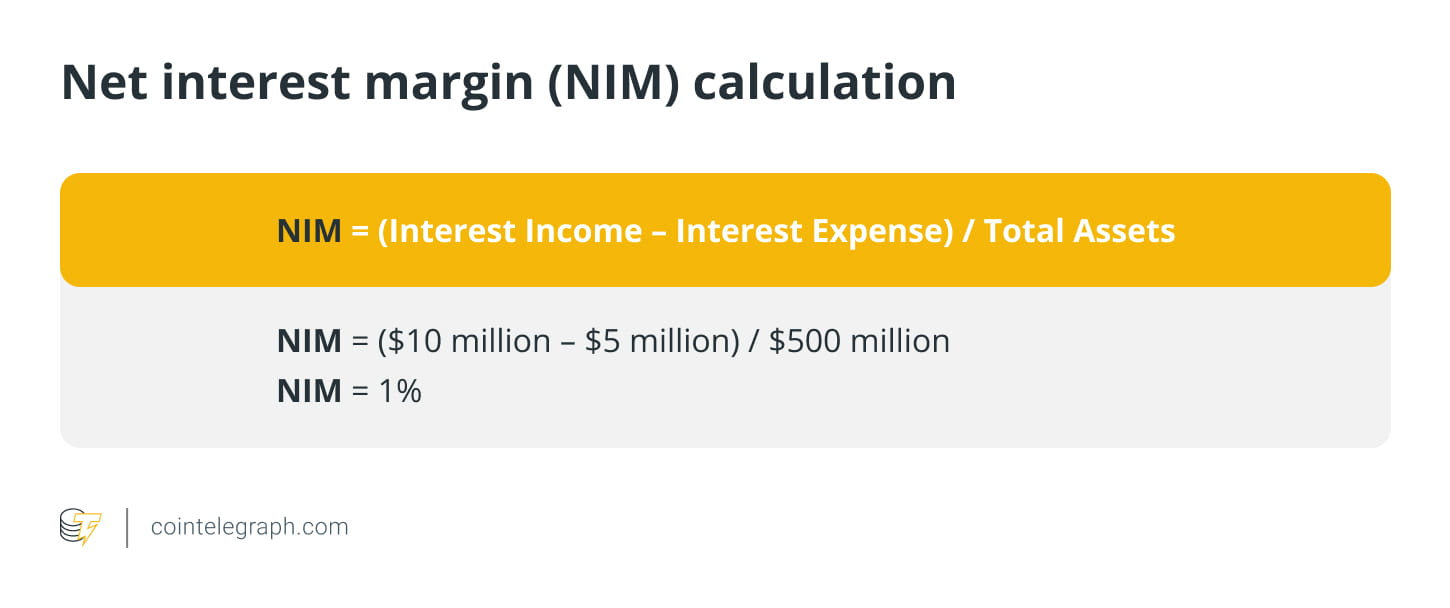
This indicates that for every dollar of assets the bank holds, it earns one cent in net interest income. A higher NIM indicates that the bank is more profitable because it earns more from its assets than it pays in interest. In contrast, a lower NIM indicates that the bank is less profitable because it earns less from its assets than it pays in interest.
Efficiency ratio
This is the ratio of a bank's non-interest expenses to its revenue. A lower ratio indicates greater efficiency and profitability.
Let's take the example of a bank that has the following financial data for a given year:
Net interest income: $20 million
Noninterest income: $5 million
Operating expenses: $12 million.
Using this information, the bank's efficiency ratio can be calculated as follows:
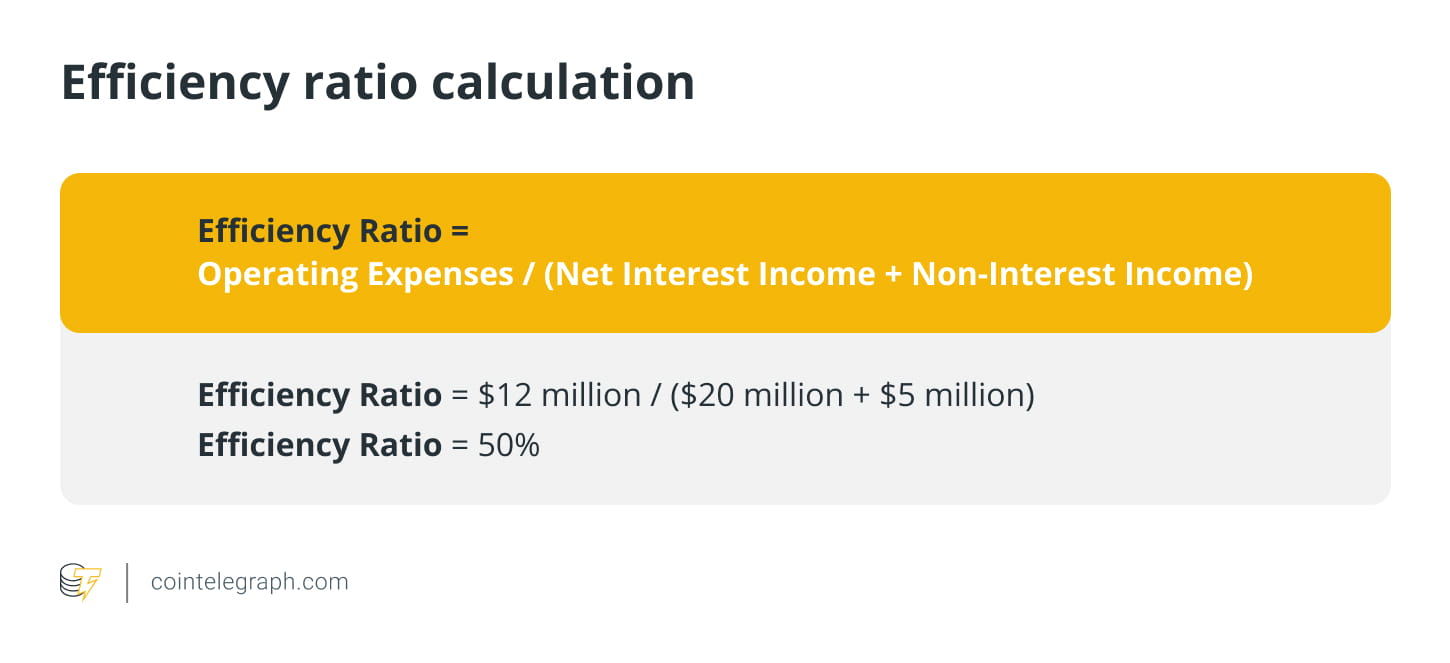
This indicates that for every $1 in revenue the bank generates, it spends $0.50 on operating costs. A high efficiency ratio can be a warning sign for a bank, indicating that it may be struggling to make money and may have trouble staying competitive.
An efficiency ratio of more than 60% is generally considered to have a high cost structure, which may lead to reduced profitability and may indicate that the bank needs to take action to improve its operational efficiency, such as by simplifying its operations, cutting costs related to overheads or enhancing its revenue-generating capabilities.
Return on Assets (ROA)
This measures how successful a bank is in generating profit from its assets. Higher ROA indicates better performance.
Assume that Bank A has a net income of $5 million and total assets of $100 million. Now, its ROA will be:
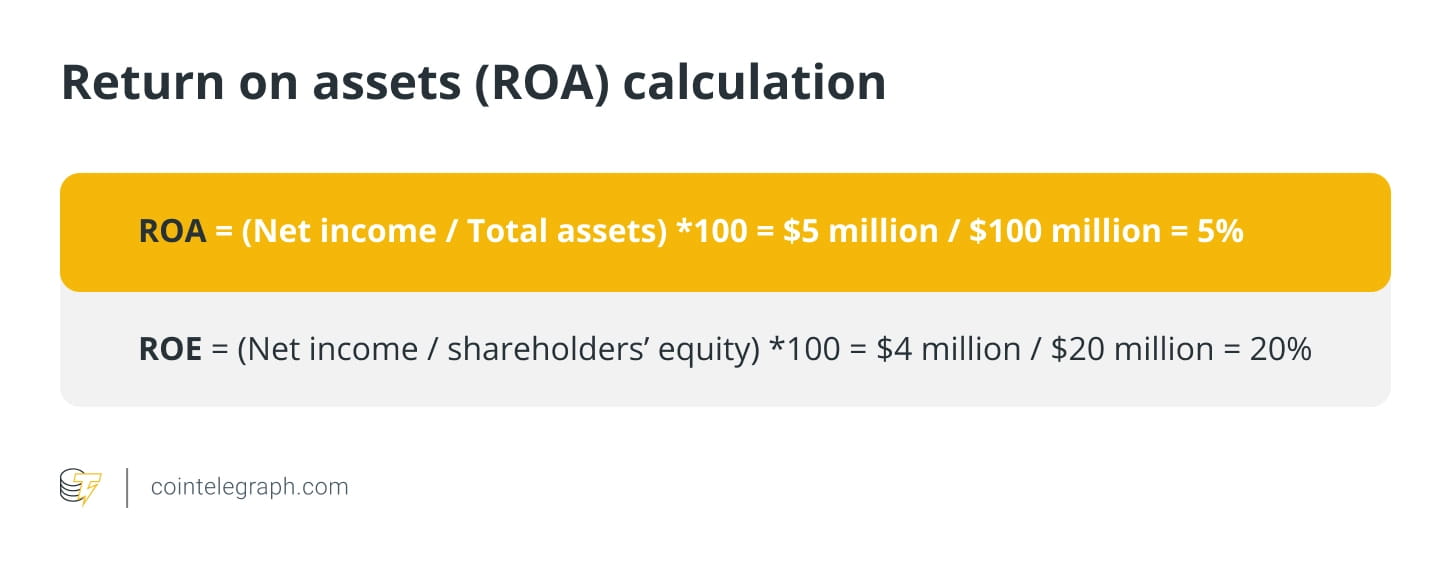
A high ROA (e.g., more than 1%) indicates that the bank has a high return on assets and is able to generate profits efficiently, and vice versa.
Return on Equity (RoE)
This measures the profitability of a bank relative to its shareholders’ equity. A higher ROE indicates better performance.
Assume that Bank B has a net income of $4 million and shareholders' equity of $20 million. Now, its ROE will be:

Non-Performing Loans (NPL)
This is the ratio of a bank's nonperforming loans to its total loans. A high nonperforming loan ratio indicates higher credit risk and potential loan losses. Suppose a bank has a $1 billion loan portfolio. Of this, $100 million (or 10%) is classified as nonperforming loans because borrowers are more than 90 days behind on payments.
If the bank had to set aside 50% for these bad loans, it would need to set aside $50 million in provisions. This would mean that the bank's net loan portfolio would be $950 million.
Now let us assume that the bank has to write off these NPLs because it cannot recover $20 million from them. As a result, the bank's loan portfolio will drop to $930 million, which will have an impact on the bank's profitability and capital adequacy.
This example illustrates how nonperforming loans can have a significant impact on a bank’s financial health and why it is critical for banks to effectively manage their loan portfolios to minimize the risk of such loans.
Cost to income ratio
This is the ratio of a bank's operating costs to its operating income. A lower ratio indicates greater efficiency and profitability.
For example, suppose a bank has total operating expenses of $500 million and total operating income of $1 billion. The bank's cost-to-income ratio is:
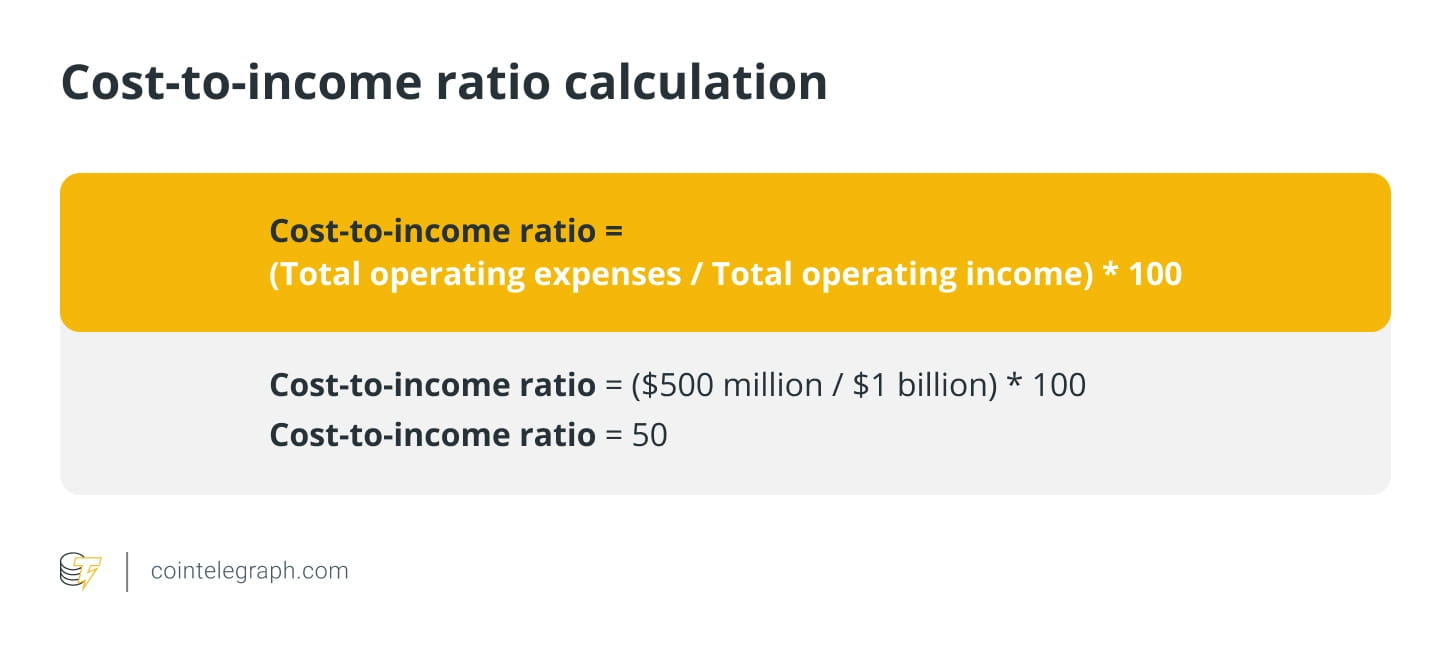
This means that for every dollar of operating income the bank generates, it spends $0.50 on operating costs. Generally speaking, a lower cost-to-income ratio is desirable because it indicates that the bank is more profitable and efficient because it can generate more income with less expenses.
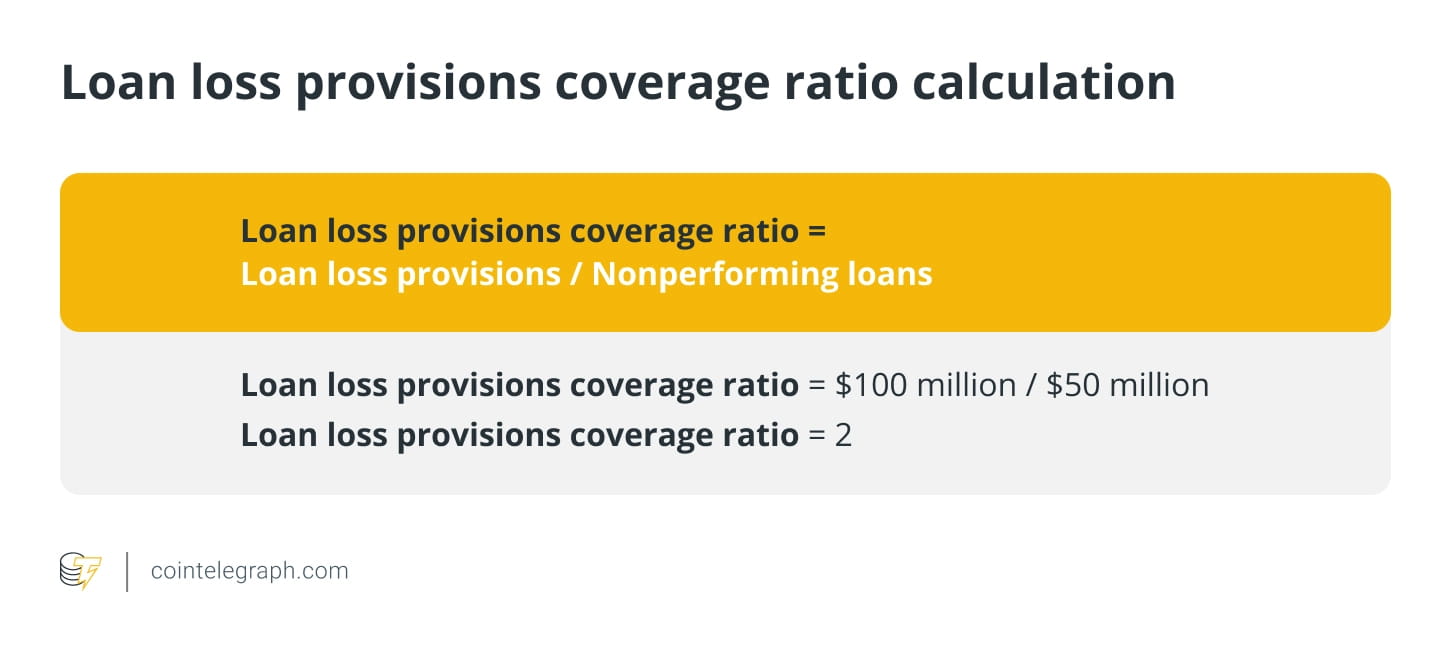
Loan loss provision coverage ratio
This is the ratio of a bank's loan loss provisions to its nonperforming loans. It reflects the bank's ability to cover potential loan losses with provisions.
For example, suppose a bank has $100 million in loan loss reserves and $50 million in nonperforming loans. The bank's loan loss reserve coverage ratio is
Capital Adequacy Ratio (CAR)
Capital adequacy ratio assesses a bank's ability to pay its liabilities and handle credit and operational risks. A good CAR indicates that a bank has enough capital to absorb losses and avoid insolvency, thereby protecting depositors' funds.
The formula for calculating capital adequacy ratio is as follows:

The Bank for International Settlements divides capital into Tier 1 and Tier 2. Tier 1 is the primary measure of financial health and includes shareholders’ equity and retained earnings. Tier 2 is supplementary capital and includes revalued and undisclosed reserves and hybrid securities.
Risk-weighted assets are bank assets weighted by risk, with each asset class assigned a risk level based on the likelihood that its value will fall. Risk weights determine the total amount of a bank's assets and vary for asset classes such as cash, bonds and debentures.
For example, if a bank has Tier 1 capital of $1 billion, Tier 2 capital of $500 million, and risk-weighted assets of $10 billion, the CAR is:

In this case, the bank’s CAR is 15%, which indicates that it has enough capital to cover potential losses from its lending and investing activities.
Why do we need decentralization?
Decentralized Finance (DeFi) makes the financial system transparent, secure, and accessible to everyone. Bitcoin
Introducing decentralized currencies to the world and challenging the centralized banking system. The global financial crisis and the collapse of SVB highlighted the risks of the centralized financial system, leading to increased interest in decentralizing the banking industry.
However, DeFi also has its own risks that cannot be ignored. For example, the market volatility of cryptocurrencies poses significant risks to those who invest in DeFi platforms. Therefore, investors must carefully consider such risks and conduct due diligence before investing in any DeFi project.