#AKEUSDT
Specific analysis is as follows:
1. Short-term upward momentum is starting to weaken
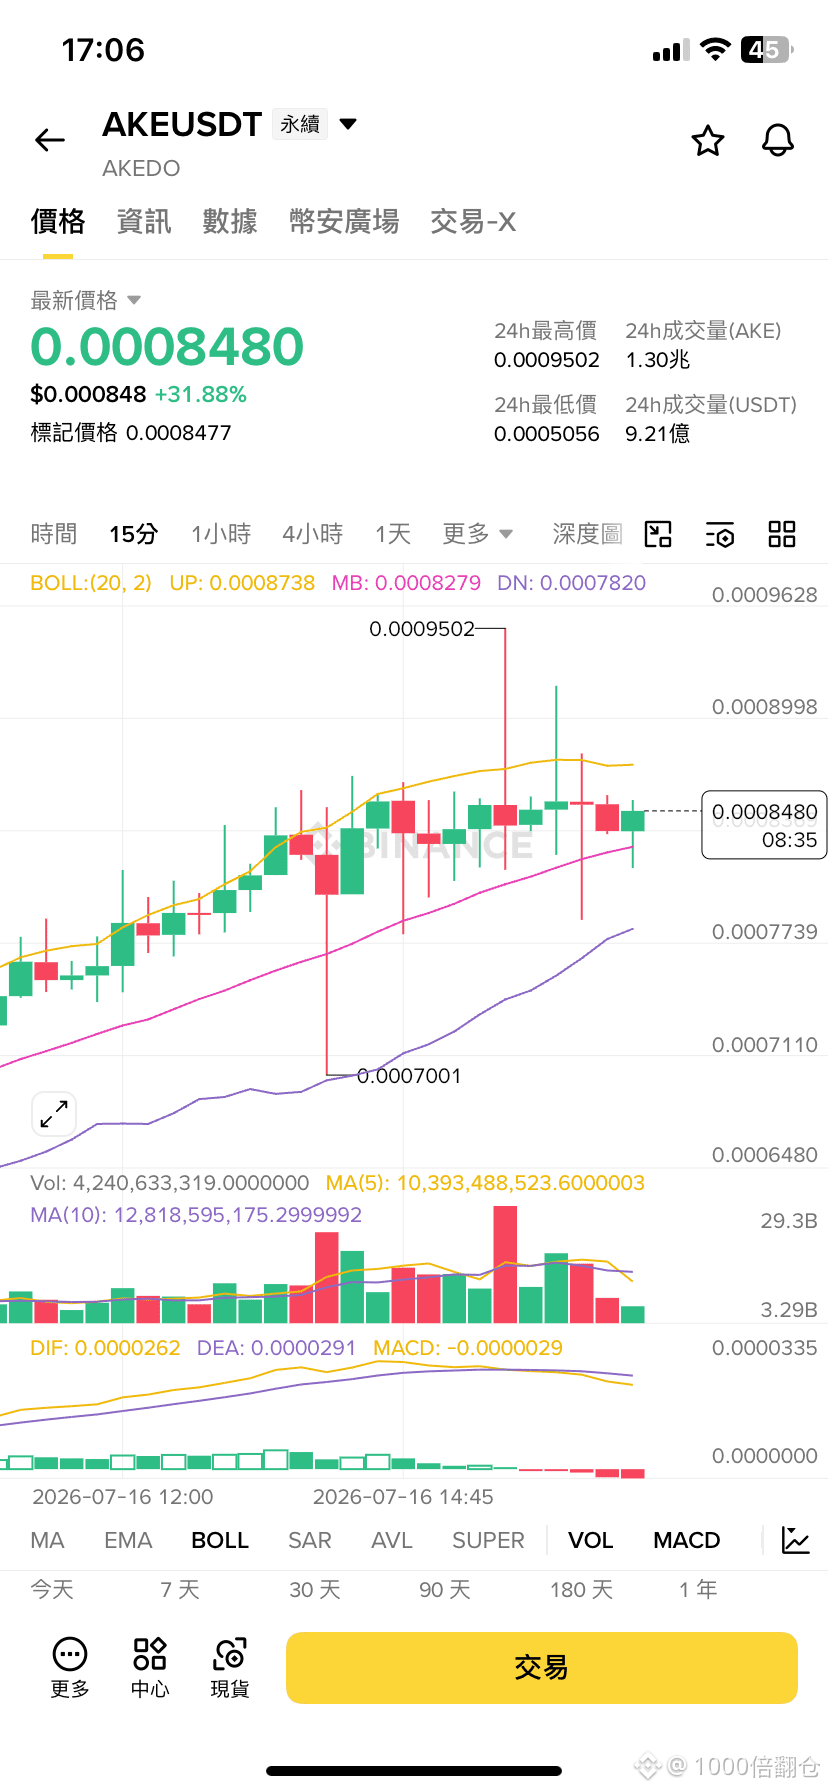
• Today, AKE has already risen by about 31.9%, which is the high point after a strong surge.
• The price previously spiked to around 0.0009502, then was quickly pushed back, leaving a long upper shadow line. This indicates there is heavy sell pressure near 0.00095.
• The most recent few 15-minute candlesticks show small real bodies, entering a sideways consolidation phase, suggesting bulls and bears are beginning to stalemate.
2. Trading volume is declining
Looking at volume:
• During the rally, large volume was released.
• After that, the volume gradually shrank.
This situation usually means chasing-buyers are decreasing; if there is no new demand, the price is more likely to pull back or trade sideways rather than continue to surge quickly.
3. MACD begins to weaken
In the chart, MACD:
• DIF has already crossed below DEA.
• The red histogram bars are gradually shortening.
This is a signal of weakening short-term momentum. It does not necessarily mean a big drop is guaranteed, but it does indicate that the pace of the rise is slowing down.
4. Bollinger Bands position
The current price is still between the upper and middle bands, and it has not broken below the middle band.
If within the next 1 hour:
• Breaking below the 0.000827 area (the middle band) would significantly increase the probability of a pullback.
• If it keeps holding above 0.00084, there is still a chance to challenge the 0.00090 area again.
My outlook for the next 1 hour
I will provide a probability assessment (not a definite outcome):
• 60%: After pulling back to around 0.00082–0.00083, it will likely range-trade.
• 30%: Continue consolidating sideways, fluctuating in the 0.00084–0.00087 range.
• 10%: Break above 0.00090 with volume, then surge again toward today’s high of 0.00095.
In addition, judging from the overall market, AKE has been extremely volatile recently. In the past 7 days, the cumulative gain has exceeded 300%, and the 24-hour trading volume has also surged significantly. This suggests it is a high-volatility, low-market-cap asset; in the short term, it can easily see rapid rallies and rapid pullbacks. 
If you are trading futures/contracts:
• I do not recommend blindly chasing longs at the current level.
• If you already hold long positions, watch whether 0.000827 holds; if it breaks and volume increases, you should be more cautious in the short term.
• If you are considering going short, don’t chase a short right away either—waiting for a rebound to the resistance area and watching for new weakening signals would be more prudent.
Specific analysis is as follows:
1. Short-term upward momentum is starting to weaken
• Today, AKE has already risen by about 31.9%, which is the high point after a strong surge.
• The price previously spiked to around 0.0009502, then was quickly pushed back, leaving a long upper shadow line. This indicates there is heavy sell pressure near 0.00095.
• The most recent few 15-minute candlesticks show small real bodies, entering a sideways consolidation phase, suggesting bulls and bears are beginning to stalemate.
2. Trading volume is declining
Looking at volume:
• During the rally, large volume was released.
• After that, the volume gradually shrank.
This situation usually means chasing-buyers are decreasing; if there is no new demand, the price is more likely to pull back or trade sideways rather than continue to surge quickly.
3. MACD begins to weaken
In the chart, MACD:
• DIF has already crossed below DEA.
• The red histogram bars are gradually shortening.
This is a signal of weakening short-term momentum. It does not necessarily mean a big drop is guaranteed, but it does indicate that the pace of the rise is slowing down.
4. Bollinger Bands position
The current price is still between the upper and middle bands, and it has not broken below the middle band.
If within the next 1 hour:
• Breaking below the 0.000827 area (the middle band) would significantly increase the probability of a pullback.
• If it keeps holding above 0.00084, there is still a chance to challenge the 0.00090 area again.
My outlook for the next 1 hour
I will provide a probability assessment (not a definite outcome):
• 60%: After pulling back to around 0.00082–0.00083, it will likely range-trade.
• 30%: Continue consolidating sideways, fluctuating in the 0.00084–0.00087 range.
• 10%: Break above 0.00090 with volume, then surge again toward today’s high of 0.00095.
In addition, judging from the overall market, AKE has been extremely volatile recently. In the past 7 days, the cumulative gain has exceeded 300%, and the 24-hour trading volume has also surged significantly. This suggests it is a high-volatility, low-market-cap asset; in the short term, it can easily see rapid rallies and rapid pullbacks. 
If you are trading futures/contracts:
• I do not recommend blindly chasing longs at the current level.
• If you already hold long positions, watch whether 0.000827 holds; if it breaks and volume increases, you should be more cautious in the short term.
• If you are considering going short, don’t chase a short right away either—waiting for a rebound to the resistance area and watching for new weakening signals would be more prudent.