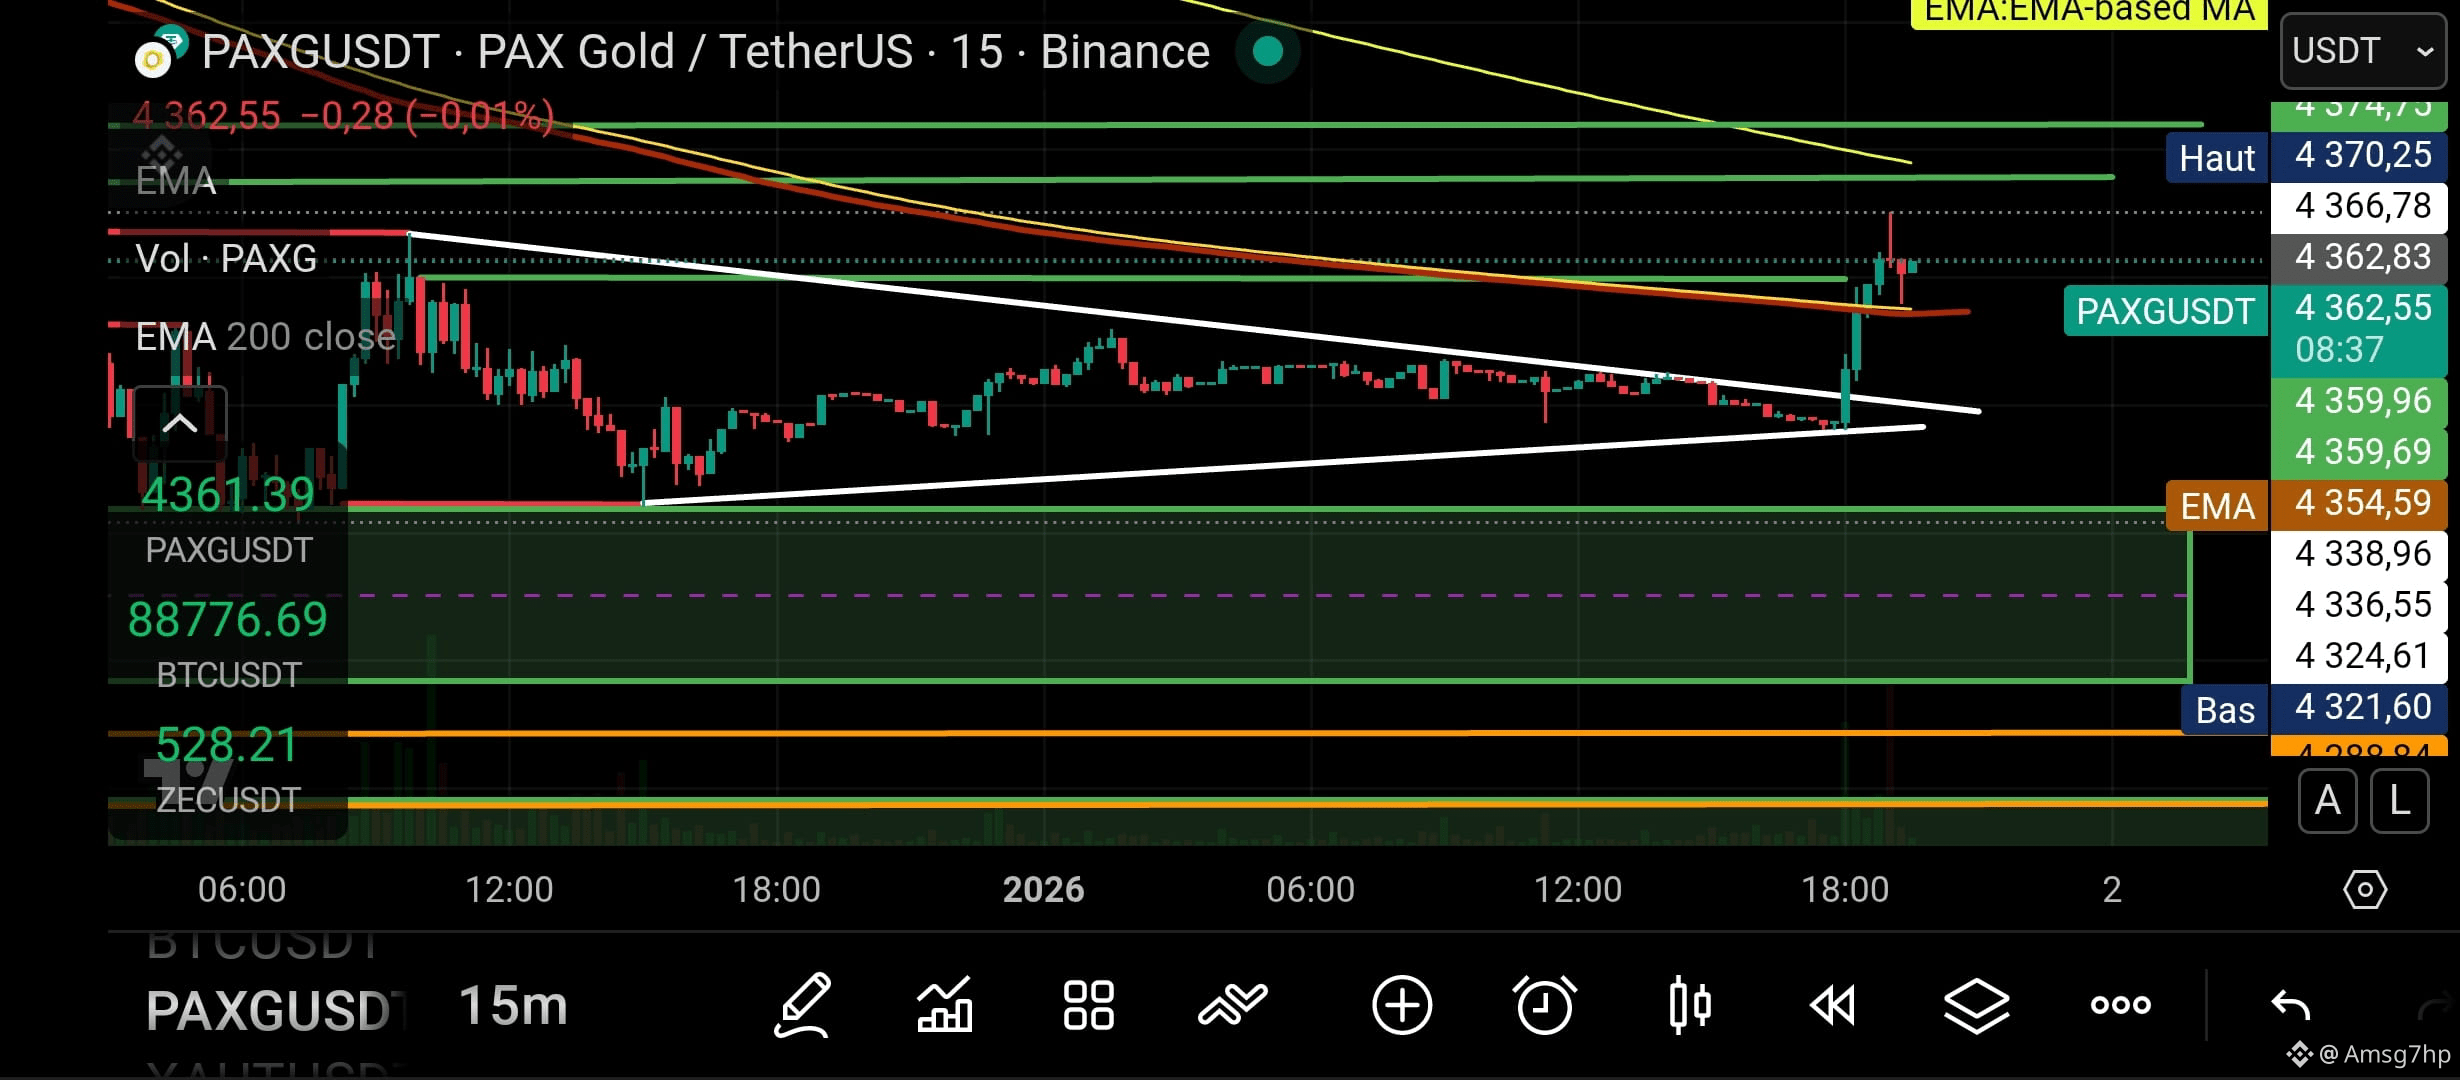
#PAXG Supports & Resistances to Monitor
The following levels are often used to define a realistic price structure:
Level, Type, Importance
~4,211–4,226 USD
Main Support
Short-term base 💡
~4,330 USD
Psychological Support
Level where buyers often return
~4,456–4,480 USD
Key Resistance
Zone where sellers reappear 🚧
~4,573–4,600 USD
Strong Resistance
Next zone if bullish breakout
If the resistance zone ~4,456–4,480 USD is breached with volume, this could open the door to a clearer bullish extension.
5. Technical Scenarios
Bullish Scenario
Price remains above short-term supports (~4,211–4,330 USD).
RSI does not rise too quickly → avoids overbought zone.
Immediate bullish target: ~4,456–4,600 USD.
Confirmation of a breakout can aim higher.
Neutral / Consolidation Scenario
Price oscillates between 4,211 and 4,456 USD without a clear direction.
RSI close to 50 indicates balance zone.
➡️ This often translates to an accumulation phase or indecision before a stronger move.
Bearish Scenario (Risk Off)
If the support ~4,211 USD is lost, we may see a correction towards lower levels. That said, the strong correlation with gold makes large pullbacks less likely without weakness in the yellow metal itself.
Correlation with Gold (Gold Spot)
PAXG is strongly correlated to the price of physical gold.
Thus, if the precious metal continues its bullish movement (e.g., uncertain macro-economy, geopolitical tensions), PAXG tends to follow. Conversely, a pullback in gold can pull PAXG down.
Long-term Conclusion
Even though PAXG is not a purely speculative asset like BTC/ETH, the current technical analysis shows:
General sentiment is positive on key indicators, with a critical zone to monitor around 4,456–4,480 USD to validate a bullish continuation. The support 4,211–4,330 USD remains key to avoid a deeper correction.
$PAXG
What do you think?
The following levels are often used to define a realistic price structure:
Level, Type, Importance
~4,211–4,226 USD
Main Support
Short-term base 💡
~4,330 USD
Psychological Support
Level where buyers often return
~4,456–4,480 USD
Key Resistance
Zone where sellers reappear 🚧
~4,573–4,600 USD
Strong Resistance
Next zone if bullish breakout
If the resistance zone ~4,456–4,480 USD is breached with volume, this could open the door to a clearer bullish extension.
5. Technical Scenarios
Bullish Scenario
Price remains above short-term supports (~4,211–4,330 USD).
RSI does not rise too quickly → avoids overbought zone.
Immediate bullish target: ~4,456–4,600 USD.
Confirmation of a breakout can aim higher.
Neutral / Consolidation Scenario
Price oscillates between 4,211 and 4,456 USD without a clear direction.
RSI close to 50 indicates balance zone.
➡️ This often translates to an accumulation phase or indecision before a stronger move.
Bearish Scenario (Risk Off)
If the support ~4,211 USD is lost, we may see a correction towards lower levels. That said, the strong correlation with gold makes large pullbacks less likely without weakness in the yellow metal itself.
Correlation with Gold (Gold Spot)
PAXG is strongly correlated to the price of physical gold.
Thus, if the precious metal continues its bullish movement (e.g., uncertain macro-economy, geopolitical tensions), PAXG tends to follow. Conversely, a pullback in gold can pull PAXG down.
Long-term Conclusion
Even though PAXG is not a purely speculative asset like BTC/ETH, the current technical analysis shows:
General sentiment is positive on key indicators, with a critical zone to monitor around 4,456–4,480 USD to validate a bullish continuation. The support 4,211–4,330 USD remains key to avoid a deeper correction.
$PAXG
What do you think?