

. Analyzing the charts (comparing timeframes):
The three images show the price action across different timeframes, which is excellent for understanding the trend:
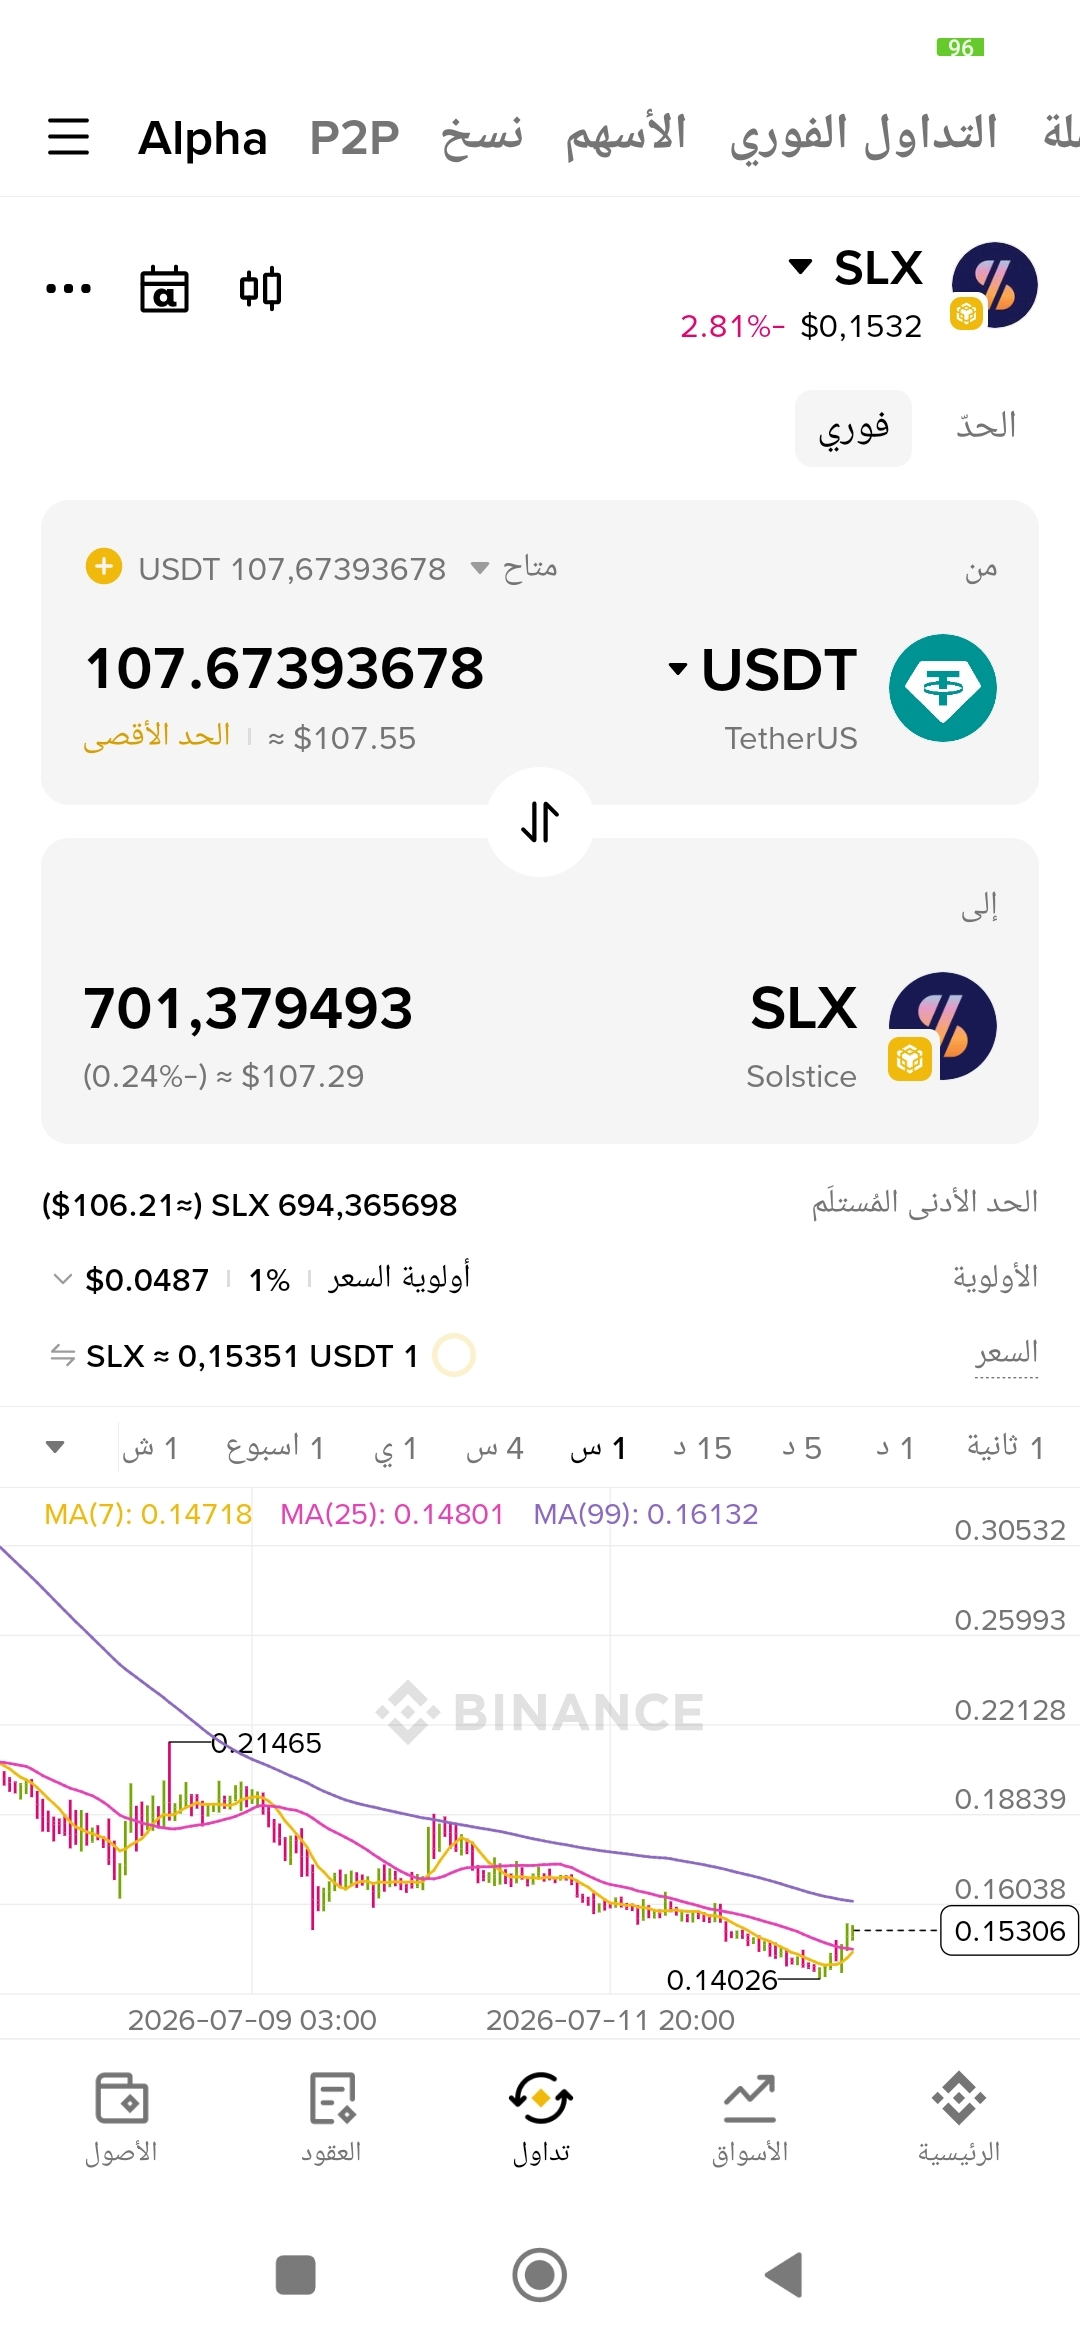
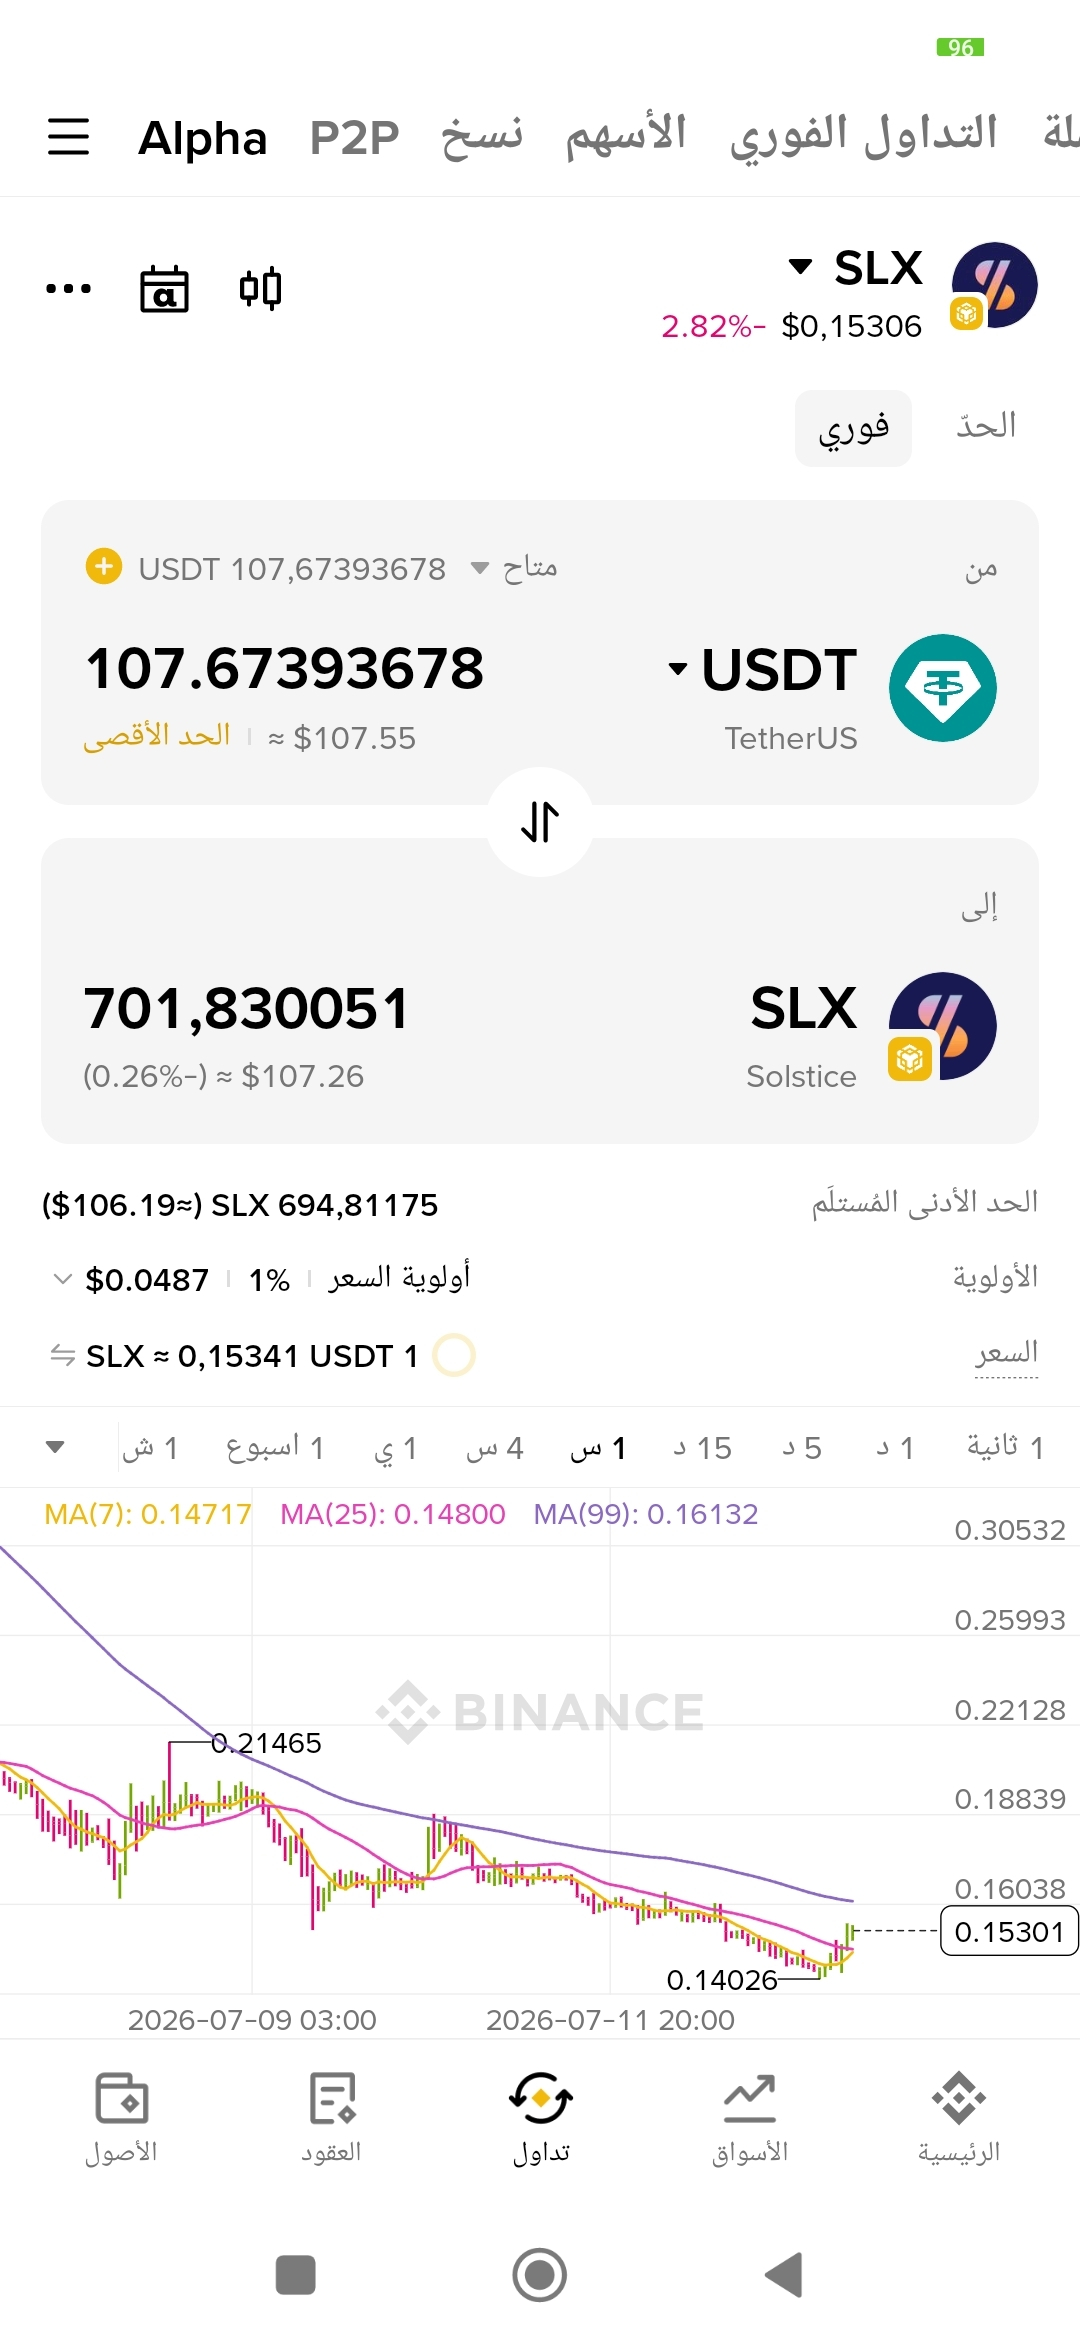
The first image (one-hour chart frame - 1h):It shows the price movement from July 9 to July 11, 2026.
It is clearly shown that the price is going through a short-term continuous downtrend (Downtrend), where it dropped from the 0.21$ levels down to a local low at 0.1402$, and has now started to stabilize and make a very slight bounce upward, touching the fast moving average lines (MA7 and MA25) at 0.153$.
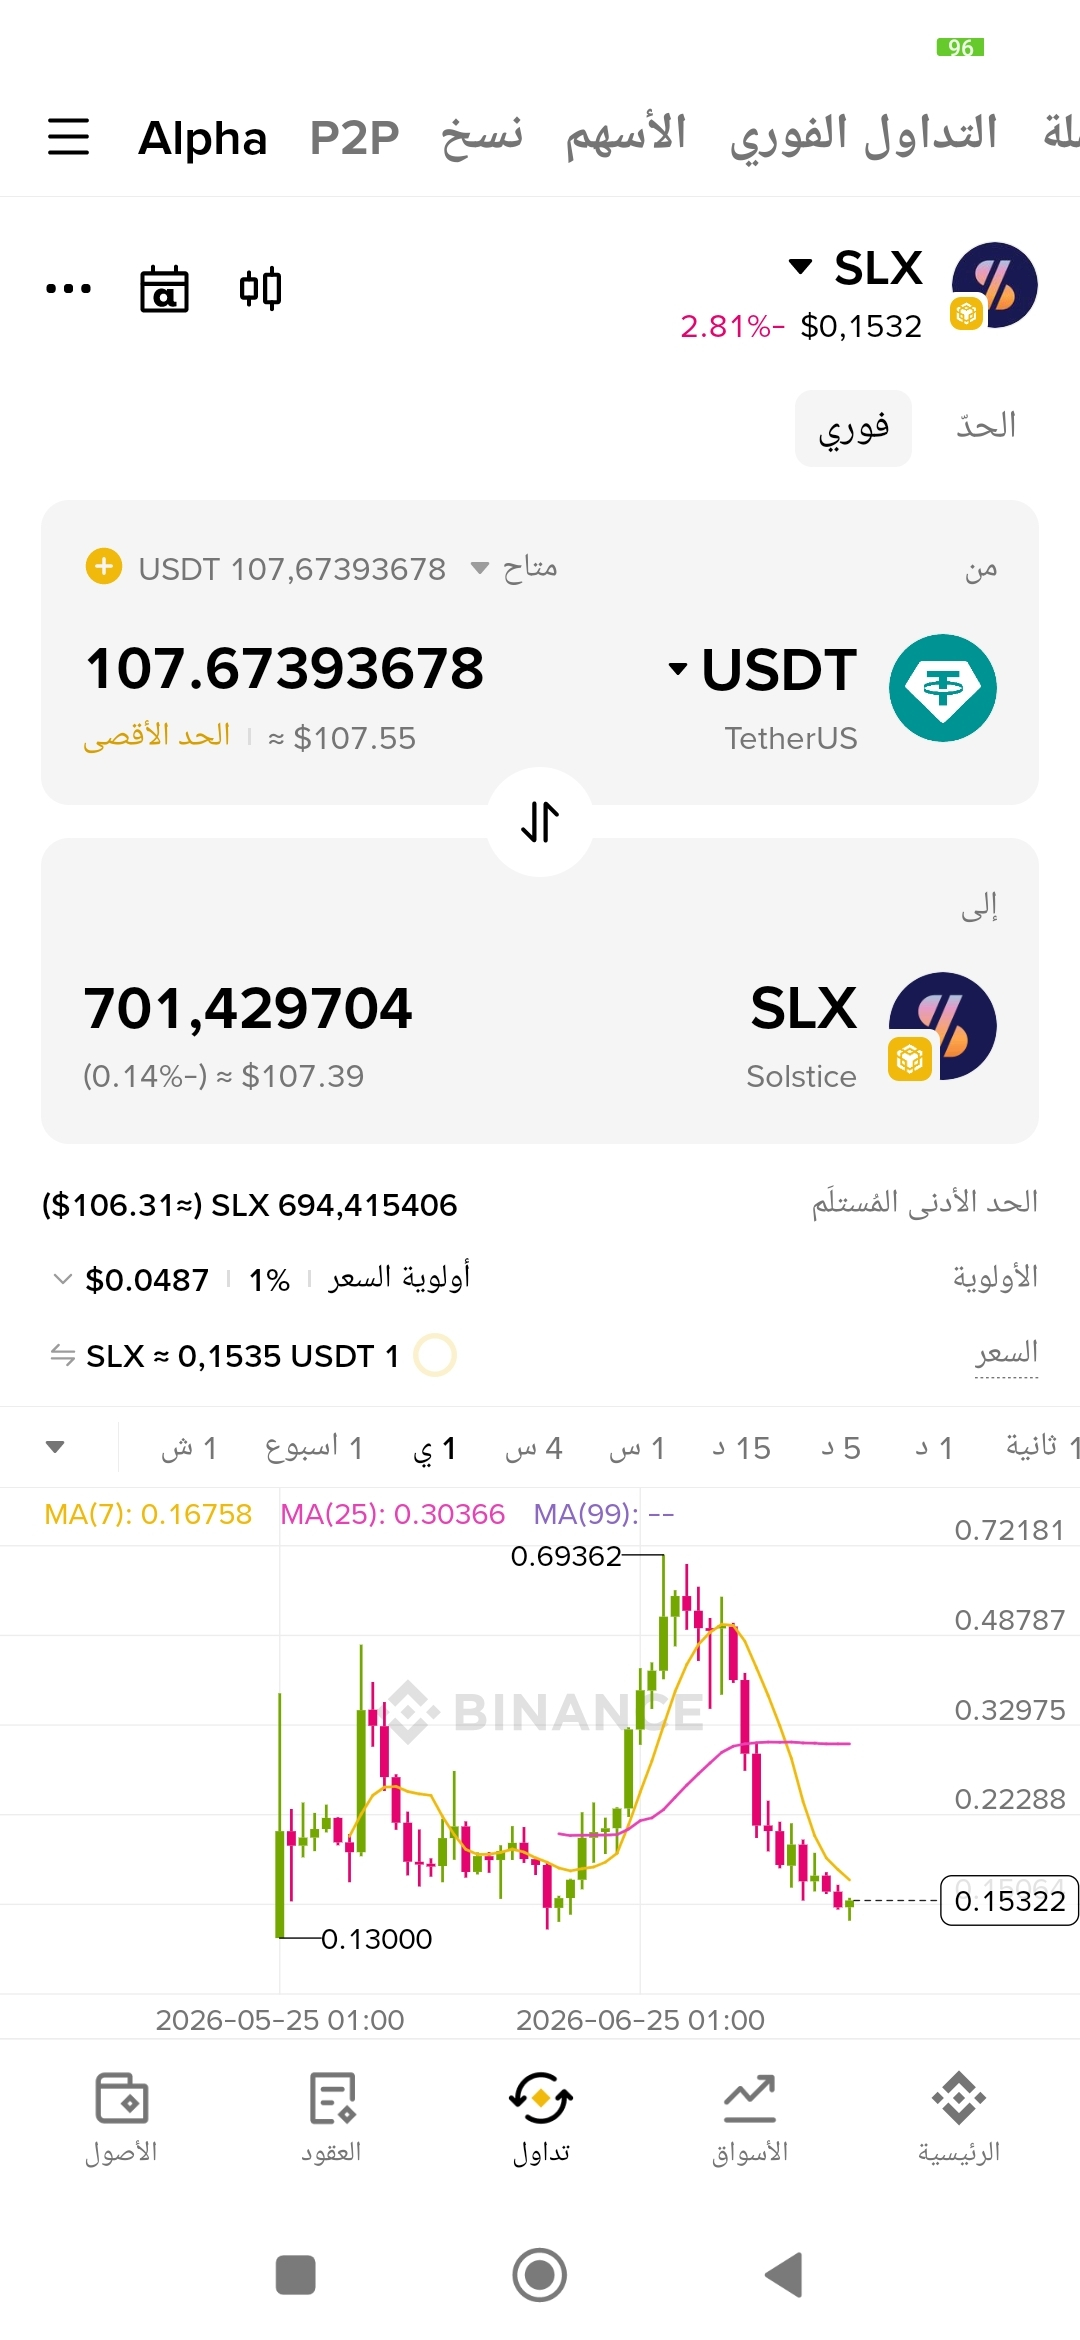
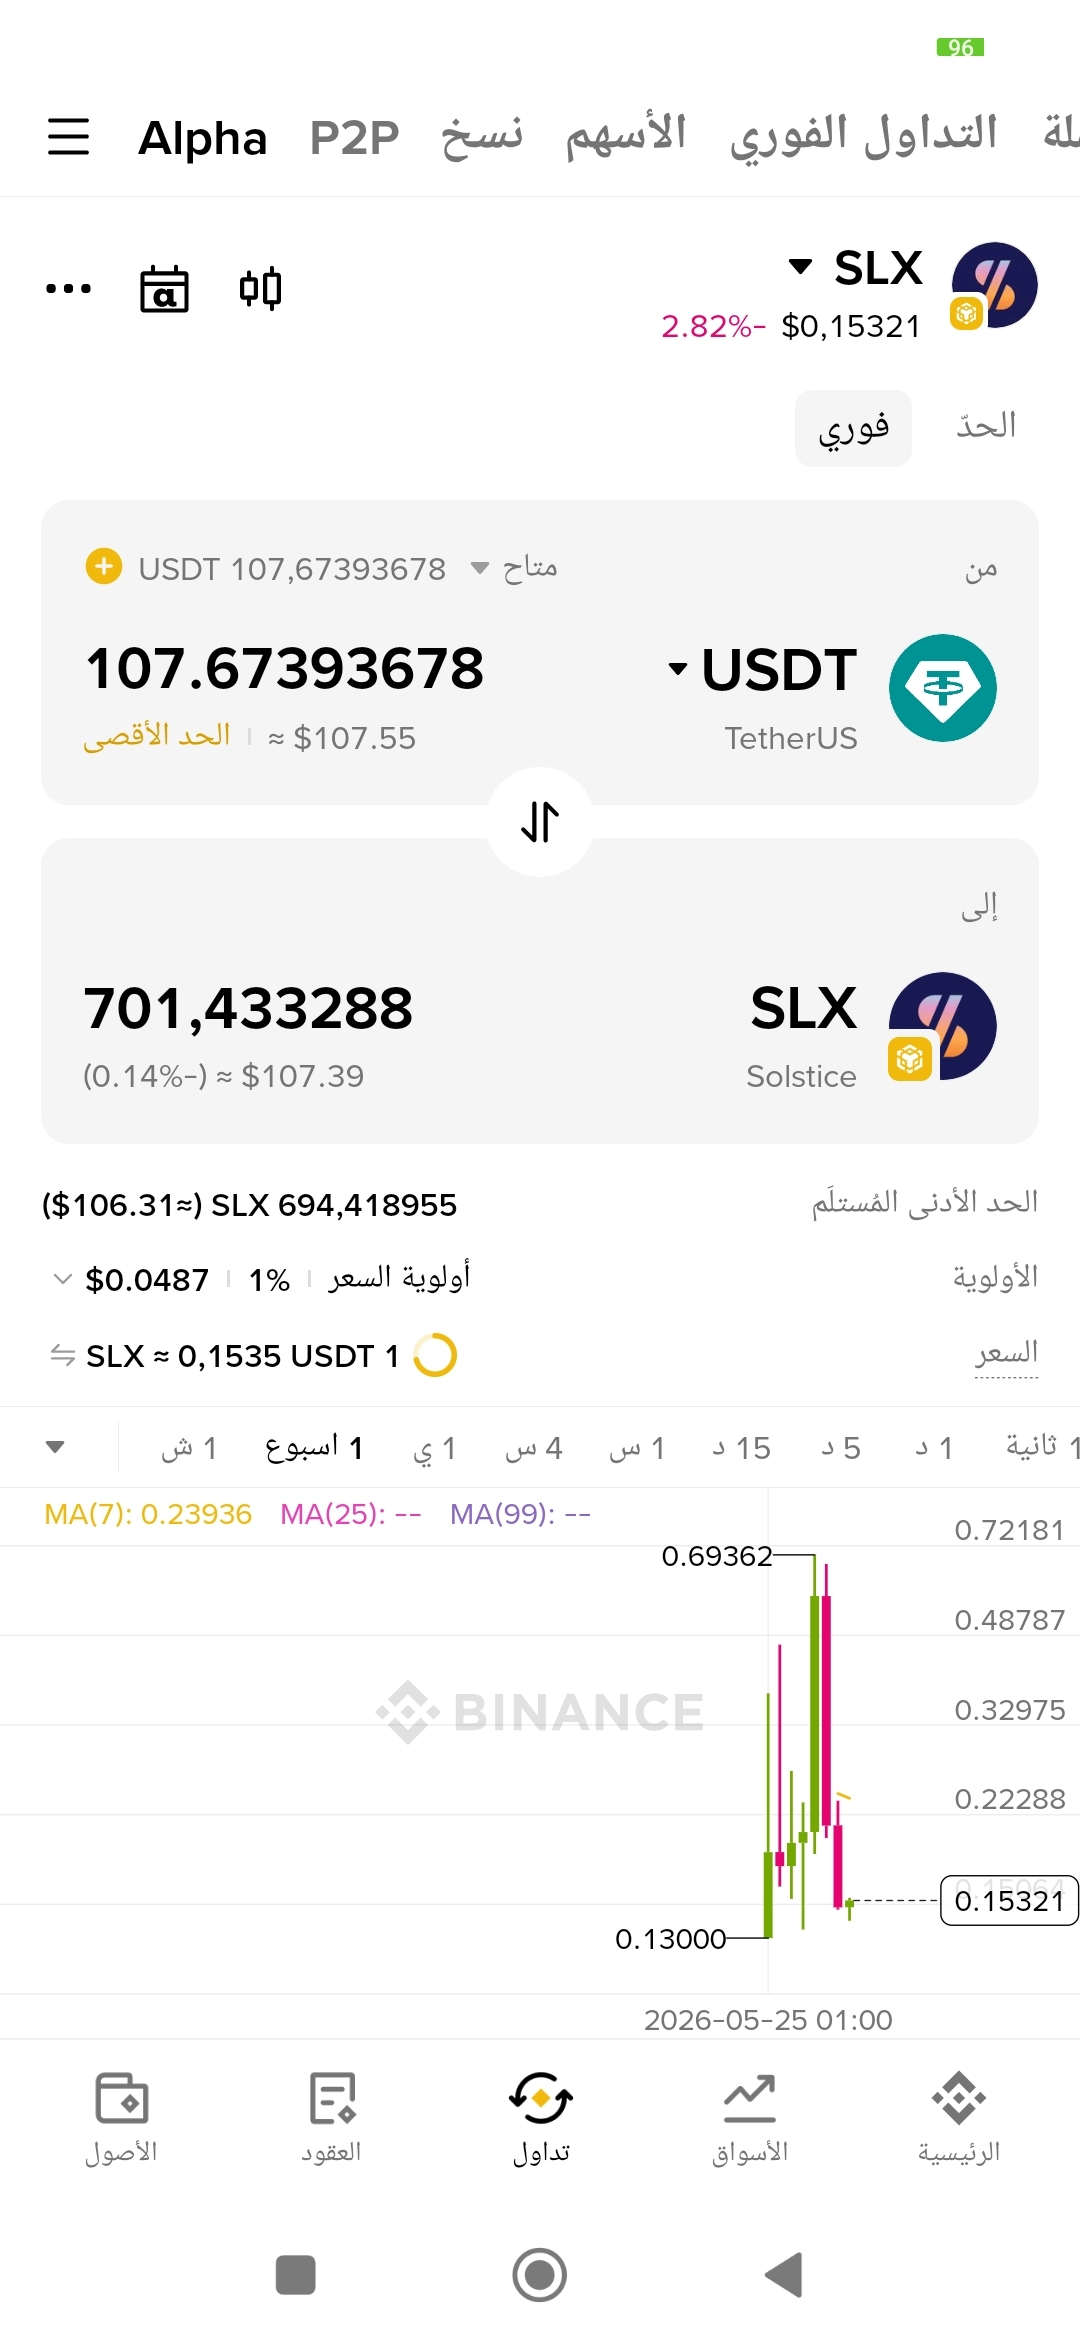
Second image (1-day frame - 1d):Shows the broader view (from May to July 2026).
We notice that the coin saw a strong jump (rocket-like rise) in June, reaching a peak at 0.6936$, but then entered a correction wave followed by a sharp, continuous decline until it reached the current price (0.153$). The price is now very close to the lowest historical trough visible on the chart, at 0.1300$.
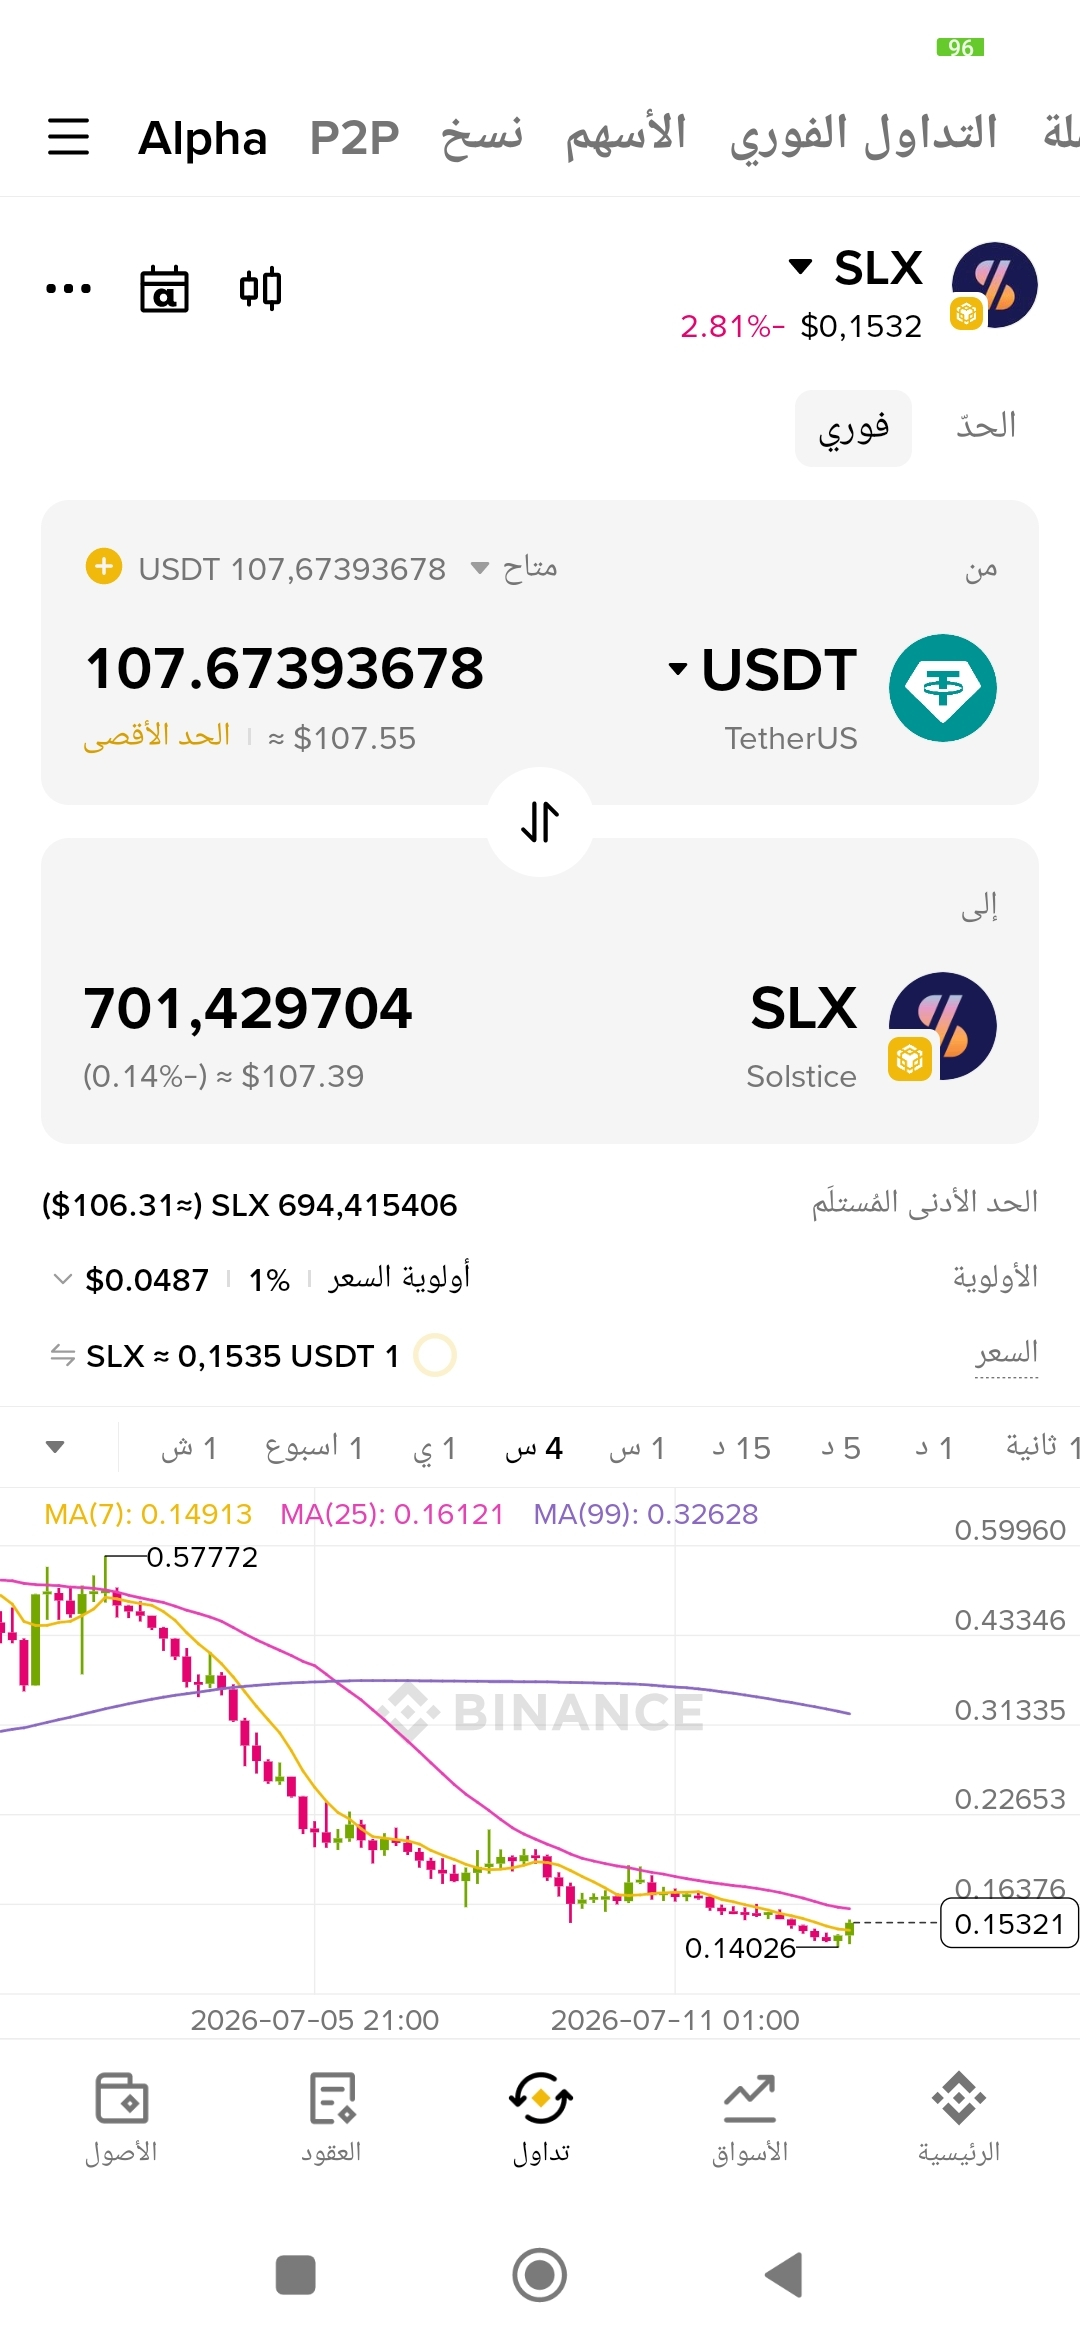
Third image (4-hour frame - 4h):Focuses on the last few days with greater accuracy.
Confirms the sharp drop from the 0.57$ level, and indicates that the most recent candles have started moving sideways (accumulation) above the 0.1402 support level.
Technical Summary & Recommendation:
Overall Trend: The coin is currently in a sharp bearish trend over the medium term, going through a decline phase after its previous peak in June.
Support Zones: The current price (0.153$) is close to the main support zones (0.140$ and 0.130$). If the price manages to consolidate above 0.140$, this could be a good "accumulation" area for a speculative rebound upward.
Risk:Buying during a continuing downtrend involves risk; therefore, it is always preferable to wait for a clear reversal signal (such as a break of the MA99 moving average line or candles rising above the average 25 days with strong trading volume) before entering with full liquidity.
 $GOOGLB