Technical Analysis of $BTC
The provided 1-hour (1h) chart shows the following key indicators:
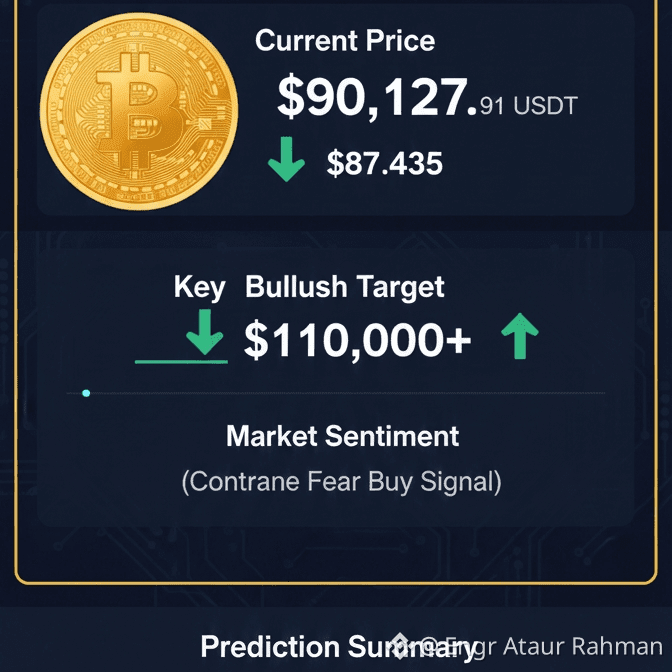
Current Price: $90,127.91, which represents a significant recovery from a recent low of $87,435.00.
Moving Averages (MA): The price is currently trading above its short-term MA(7) at $89,178.82 and MA(25) at $88,156.31. This alignment generally suggests a bullish short-term trend as buyers are in control of the recent average price.
Volume Spike: The large green candles at the far right of your chart indicate high buying volume, confirming that the current move toward $90,406.08 (the 24h high) has strong market participation.
Short-Term Prediction (Year-End 2025)
Bullish Target: If BTC can break and hold above the psychological resistance level of $92,292, it may open a path toward $110,000 by the very end of December.
Support Level: Your chart shows strong support at $87,435. If the price drops back below the MA(99) at $87,893.41, it could signal a reversal toward major support at $80,413.
Market Sentiment
Despite this recent recovery, the overall market sentiment for late December has been described as "Extreme Fear" (Fear & Greed Index around 24-27) due to persistent institutional outflows earlier in the month. This fear often acts as a contrarian signal, suggesting that current prices may be a "buy the dip" opportunity for a rally into early 2026.
#BTC90kChristmas
#USGDPUpdate #CPIWatch #BTCVSGOLD #USJobsData
The provided 1-hour (1h) chart shows the following key indicators:
Current Price: $90,127.91, which represents a significant recovery from a recent low of $87,435.00.
Moving Averages (MA): The price is currently trading above its short-term MA(7) at $89,178.82 and MA(25) at $88,156.31. This alignment generally suggests a bullish short-term trend as buyers are in control of the recent average price.
Volume Spike: The large green candles at the far right of your chart indicate high buying volume, confirming that the current move toward $90,406.08 (the 24h high) has strong market participation.
Short-Term Prediction (Year-End 2025)
Bullish Target: If BTC can break and hold above the psychological resistance level of $92,292, it may open a path toward $110,000 by the very end of December.
Support Level: Your chart shows strong support at $87,435. If the price drops back below the MA(99) at $87,893.41, it could signal a reversal toward major support at $80,413.
Market Sentiment
Despite this recent recovery, the overall market sentiment for late December has been described as "Extreme Fear" (Fear & Greed Index around 24-27) due to persistent institutional outflows earlier in the month. This fear often acts as a contrarian signal, suggesting that current prices may be a "buy the dip" opportunity for a rally into early 2026.
#BTC90kChristmas
#USGDPUpdate #CPIWatch #BTCVSGOLD #USJobsData