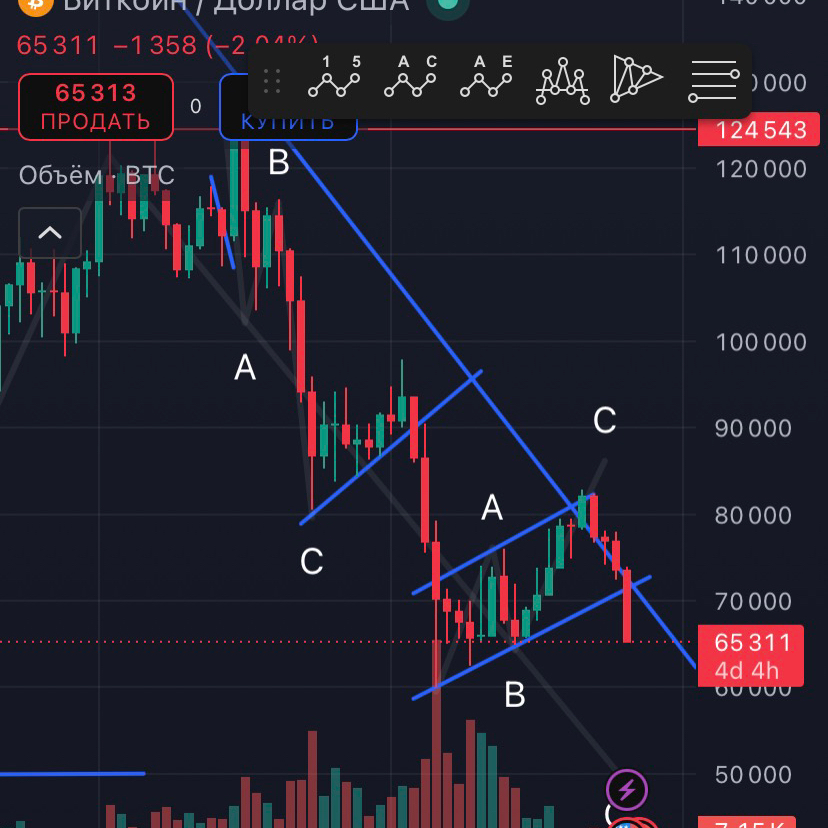
$BTC on the daily chart looks like the following. We have a drop in five waves down, and now a correction to this decline, since wave B has gone beyond the start of wave A. So it is quite possible that we will now see an impulse in five waves toward the 82000-85000 area, after which I expect another decline already toward the 45000 area—this will be wave C on the higher timeframe#btc


Post
--Bullish