


Sober Options Studio × Derive.XYZ Joint Production

Written by Sober Options Studio Analyst Jenna @Jenna_w5
I. Macroeconomic Overview: Risk Accumulation in a Low Volatility Environment and Potential Shocks in 2026
As the Christmas holiday trading cycle comes to an end, global financial markets appear to be operating in a state of high stability on the surface. Whether it is the VIX fear index continuing to operate in historically low ranges or major cryptocurrency asset prices oscillating within a narrow range, they all point to a strongly consensual market environment: systemic risks seem to be effectively suppressed in the short term. During December, U.S. stocks and cryptocurrency assets did not experience the concentrated selling pressure that some investors had previously anticipated, primarily due to U.S. macroeconomic data consistently demonstrating unexpected resilience, while major central bank policy expectations have been fully absorbed by the market.
However, from the perspective of volatility and option structure, the current low-volatility state does not reflect the disappearance of risks, but rather may indicate a temporary delay in the market's pricing of future uncertainties. As the timeline approaches 2026, asset prices operating within a highly compressed volatility range mean that potential risks are accumulating in a non-linear manner, which, once triggered, will have a significant impact on risk assets.
The continuation of the US 'golden girl' environment and its inherent fragility.
From a fundamental perspective, the US economy is currently in a relatively balanced phase among growth, inflation, and policy. Economic growth has not significantly elevated inflationary pressures, and economic activity has not shown signs of recession, providing continuous support for the valuation of high-risk assets.
GDP Performance and Growth Structure
Revised data from the US Bureau of Economic Analysis indicates that the year-on-year annualized GDP growth rate for the third quarter reached 4.3%, significantly higher than the market's previous general expectations. The growth momentum primarily stems from two aspects: first, household consumption remains quite resilient in a high-interest-rate environment, and second, the corporate sector continues to invest in AI-related infrastructure and capital expenditures. This combination effectively alleviates the market's prior concerns about a rapid economic downturn.
From the perspective of market pricing, the unexpectedly strong GDP performance reinforces the judgment that the US economy has relative independence in growth capacity, leading to no systemic reduction in risk exposure during the year-end phase, but rather continued allocation to US stocks and high-volatility assets.
Inflation Path and Monetary Policy Expectations
Marginal changes in inflation data also support market sentiment. The November unadjusted CPI year-on-year recorded 2.7%, while core CPI year-on-year was 2.6%, both lower than previous concerns about inflation rebound levels. This suggests that inflation recovery is more influenced by short-term factors rather than entering a new structural upward phase.
More critically, the Federal Reserve's reassessment of the quality of employment data. Powell recently publicly acknowledged that non-farm employment data may have systemic overestimation issues, indicating that the real tension in the labor market may be weaker than what the surface data suggests. Against this backdrop, marginal weakness in employment actually provides reasonable space for a shift in monetary policy, as the market begins to price in a more aggressive rate cut path for early 2026.
Impact on Risk Assets
Under the combined conditions of mild inflation, resilient economic growth, and increasingly clear expectations for interest rate cuts, the downside risk for risk assets is temporarily suppressed. Although Bitcoin and Ethereum have not experienced a trend increase, supported by the macro environment, price stability is maintained, and the bottom range is gradually rising, reflecting defensive allocation behavior as funds await the next phase of catalysts.
Main tail risks and structural shock sources facing 2026
Although the spot market remains stable, the options market has begun to reprice for long-term risks. The significantly lowered skew structure and demand for long-dated puts reflect institutional investors' heightened vigilance against potential systemic shocks in the first quarter of 2026. These risks do not evolve linearly but are more likely triggered in an event-driven manner that re-prices asset prices.
Japan's Monetary Policy Shift and Global Liquidity Changes
The Bank of Japan has raised its benchmark interest rate to 0.75%, reaching the highest level in nearly thirty years. Although policy communication has reduced short-term market volatility through forward guidance, the rate hike itself is continuously impacting the global liquidity environment.
As the US-Japan interest rate differential gradually converges, the funding advantage of yen carry trades is being systematically weakened. As a significant source of low-cost financing globally, the marginal inflow of yen funds will exert pressure on overvalued assets. In the current global asset environment, which is highly sensitive to liquidity, even in the absence of severe concentrated liquidations, persistent capital outflows may amplify price fluctuations during times of relatively weak liquidity.
Uncertainty of Tariff Policy Judicial Ruling
The US Supreme Court is about to make a final ruling on the legality of the aggressive tariff policy during the Trump administration. This event has a typical binary outcome characteristic, and its impact will directly transmit to the global trade system and inflation expectations.
If the ruling supports the tariff policy, the global supply chain costs will face reassessment, and rising import prices may trigger inflation expectations to rise again, thereby constraining the Federal Reserve's easing space; conversely, if the tariff policy is overturned, some asset allocation logic based on trade protection expectations will lose support. Regardless of the outcome, this ruling could become a key trigger point for the repricing of risk assets.
Fiscal Uncertainty and Data Availability Risk
The release cycle of economic data for the fourth quarter of 2025 is facing potential government shutdown risks. A government shutdown will not only disrupt actual economic activity but, more importantly, may lead to delays or omissions of key macro data. In the context of declining data transparency, the Federal Reserve will face significantly increased information constraints when formulating policy paths for early 2026, thereby raising the probability of policy misjudgment.
A Key Phase in Global Liquidity Structure Rebalancing
The current market is in a special liquidity rebalancing phase. On one hand, the Federal Reserve has further room for easing due to marginal weakness in employment; on the other hand, the Bank of Japan is gradually tightening the monetary environment under inflationary pressures. The directional divergence between the two has led to a highly unstable global liquidity environment.
The current low-volatility operation is fundamentally based on a highly assumed synergy of policies and controllable risks. In the context of asset valuations being high, any deviation in policy paths, macro data, or institutional events may trigger a rapid return of volatility. For this reason, maintaining continuous monitoring and hedging of tail risks before entering 2026 remains a core topic in options and multi-asset investment strategies.
II. In-depth Analysis of BTC & ETH Options Market Data
Based on chart data provided by Amberdata & Derive.XYZ, this week the BTC and ETH options market is gradually returning from previous macro gaming, but structural preferences still show investors' deep concern for 'black swan' events.
Skew: Short-term sentiment is warming, while long-term panic persists.
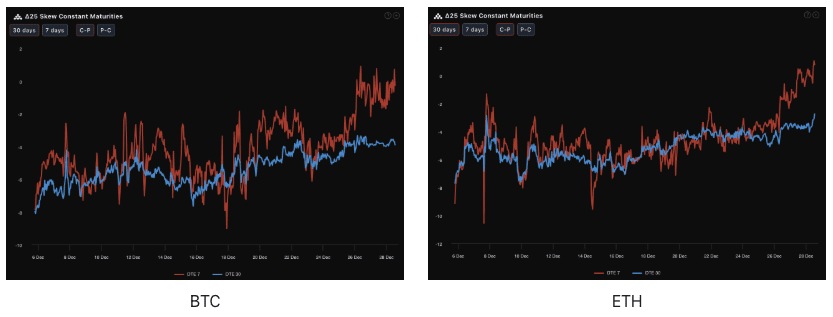
Observing Delta 25 Skew (Implied Volatility of Call Options - Implied Volatility of Put Options), the negative value reflects the market's hedging demand for downside tail risks.
Recent (DTE 7): The red curve has significantly rebounded, with the 7-day Skew of BTC approaching the 0 axis, and ETH even briefly breaking through the 0 axis to turn positive. This indicates a substantial decrease in short-term bearish protection demand for the year-end week, as traders believe the market will maintain oscillation or a slight rebound within the week, with short-term bullish sentiment recovering.
Forward (DTE 30): The blue curve remains in a deep negative range (approximately -4% to -6%). The deep red line is significantly higher than the light blue line, forming an inverted term structure of sentiment. This 'high near, low far' Skew structure is very intriguing, with the long-term deep negative Skew indicating that institutions are still heavily buying long-dated Puts (put options) as insurance, and structural bearish protection has not withdrawn.
Term Structure: Repricing of Mid-Term Risk Premium
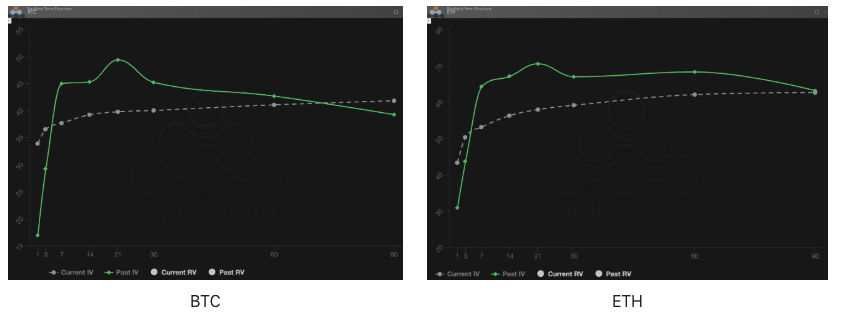
Term Structure shows the distribution of Implied Volatility (IV) across different expiration times.
Change in Shape: Compared to last week's Past IV forming a huge 'camel hump' at 14-21 days (usually pricing for specific risk events like interest rate meetings), this week's Current IV curve has returned to smooth, showing no typical Contango (low near, high far) perfect shape. Although Current IV has slightly declined at the near end, it has maintained a level comparable to, or even slightly higher than, its mid to long-term (30 days+) level, resulting in a flattening of the entire curve.
In-depth Analysis: A normal early bull market is usually accompanied by a steep Contango structure (recent IV is very low, long-term IV is high). The current flat structure suggests that the market believes mid-term volatility (14-30 days) will not easily diminish. This is the market pricing for potential liquidity tightening in January—traders expect liquidity to dry up from December to January, compounded by the lagging effects of yen interest rate hikes, which could lead to significant mid-term price fluctuations.
Volatility Risk Premium (VRP): Excess fear premium, window period for sellers?
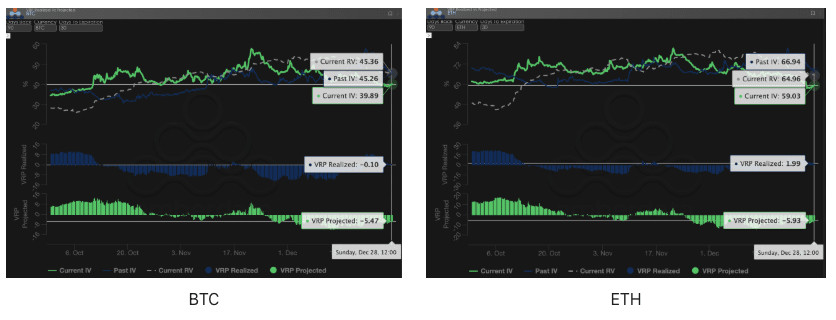
VRP (Volatility Risk Premium = Implied Volatility IV - Realized Volatility RV) is an important indicator for measuring whether option pricing is reasonable. The current market is in a correction period.
Numerical Comparison: The week before last, VRP Realized was deeply negative, and the market was in extreme panic; last week, VRP Projected reached an extreme value of -10. This week, the negative value of BTC VRP Projected has significantly converged, rising to around -5.47. VRP Realized (blue bar) is close to 0, with ETH even slightly turning positive.
In-depth analysis: The change of VRP Projected from -10 to -5 indicates that the market is no longer blindly paying excessively high premiums to panic buy options, and panic sentiment is fading. The market gradually perceives that future volatility is 'predictable.' When VRP returns from deep negative to normal, it often signifies the end of a one-sided crash, increasing the probability of the market entering wide oscillations.
III. Options Strategy Recommendation: Collar Strategy for Locking Downside Risk
Given the macro view of 'short-term stability, long-term peril,' and the current state of put options being relatively expensive, simply buying Puts for protection is too costly, while naked selling Calls faces potential 'Trump trade' rebound risks. Therefore, this week we recommend constructing a collar strategy aimed at locking in profits for 2025 at low cost, to smoothly navigate the uncertainties of 2026.
Strategy Structure (using BTC as an example):
Holding Spot (Long Spot): Assuming you hold BTC spot.
Buying Put Options (Long Put): Purchase OTM Put with DTE of 30 days, Delta -0.25.
Logic: Utilizing the characteristics of deep negative forward Skew, although Puts are slightly expensive, they can effectively guard against the potential epic liquidation brought about by yen liquidity shocks.
Selling Call Options (Short Call): Sell OTM Call with DTE of 30 days, Delta 0.20.
Logic: The premium received from selling Calls is used to offset the cost of buying Puts. Due to the recent recovery in bullish sentiment (the near end of Skew warming), decent prices can also be obtained on the Call side.
Strategy Advantages:
Low cost or even zero cost: Financing the purchase of Puts by selling Calls greatly reduces hedging costs.
Locking in Range: As long as the BTC price remains within the oscillation range in January 2026, the strategy not only breaks even but can also profit from the spot.
Defending against Black Swans: Once the Supreme Court's ruling or a yen crisis triggers a crash, the Puts on hand will provide solid bottom protection.
IV. Disclaimer
This report is based on public market data and options theoretical models, aiming to provide investors with market information and professional analytical perspectives. All content is for reference and communication purposes only and does not constitute any form of investment advice. Cryptocurrency and options trading carry high volatility and risks, which may lead to total loss of principal. Before adopting any trading strategy, investors should fully understand the characteristics, risk attributes of options products, and their own risk tolerance, and must consult professional financial advisors. The analysts of this report do not bear responsibility for any direct or indirect losses arising from the use of this report's content. Past market performance does not predict future results; please make rational decisions.
Co-produced by: Sober Options Studio × Derive.XYZ