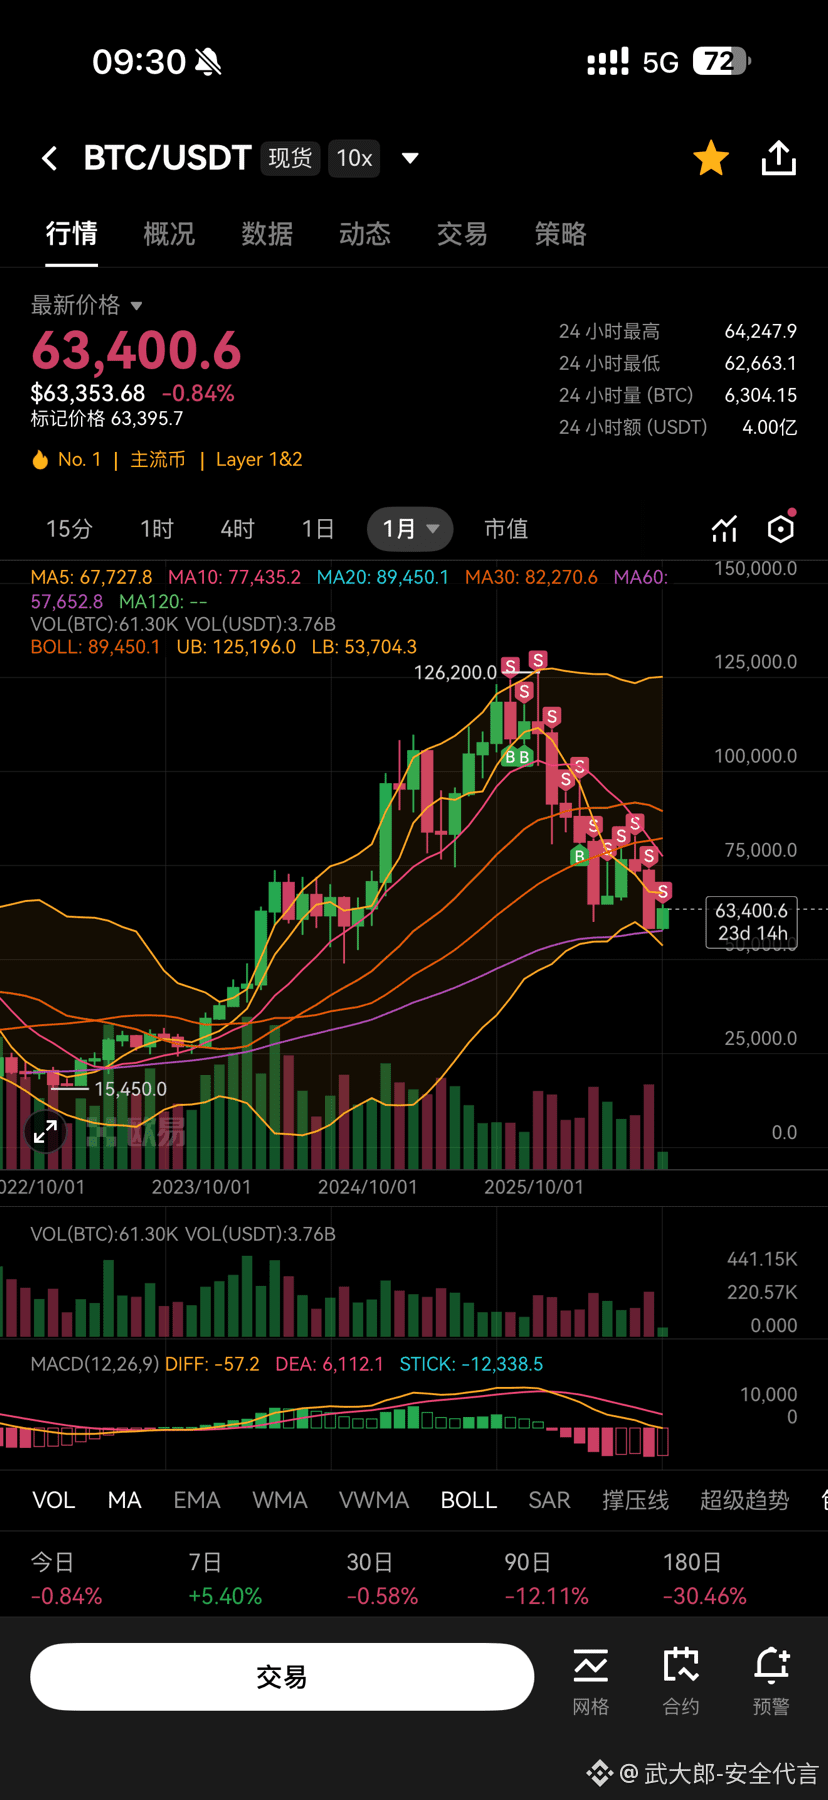
Revisited Bitcoin’s monthly chart and found an interesting pattern:
2011.11 🐻 Bear bottom
↓ 24 months
2013.11 🐂 Bull top
↓ 14 months
2015.01 🐻 Bear bottom
↓ 35 months
2017.12 🐂 Bull top
↓ 12 months
2018.12 🐻 Bear bottom
↓ 35 months
2021.11 🐂 Bull top
↓ 12 months
2022.11 🐻 Bear bottom
↓ 35 months
2025.10 🐂 Bull top
↓ 12 months?
2026.10 🐻 Bear bottom?
If history continues to follow the rhythm of the past three cycles, then around October this year may be an important time window for this bear market.