
赤影 SkullXBT
645 Posts

赤影 SkullXBT
Report
Block User
“Crypto Markets I SOL Holder I Web 3.0 | BNB • ETH - “5 Years of Experience”
Open Trade
Frequent Trader
1 Years
22 Following
6.6K+ Followers
20.4K+ Liked
Posts
Portfolio
All
Quotes
Live
·
--
Guys, I have some news that I'm really happy to share with you 🤍
I just created a chat group for everyone who wants to learn about crypto trading, and it's called @SkullXBT Teachings.
This is the place where we can talk about every piece of knowledge you need about trading. You can ask me about my setups, like why I took a trade, where I entered, and what I was seeing on the chart.
You can also ask me anything about $BTC or other altcoins, or about what's going on in the market right now. Whatever you want to know, just ask me there.
So if you want to learn with me, join the group and let's grow together ❤️
Guys, I have some news that I'm really happy to share with you 🤍
I just created a chat group for everyone who wants to learn about crypto trading, and it's called @SkullXBT Teachings.
This is the place where we can talk about every piece of knowledge you need about trading. You can ask me about my setups, like why I took a trade, where I entered, and what I was seeing on the chart.
You can also ask me anything about $BTC or other altcoins, or about what's going on in the market right now. Whatever you want to know, just ask me there.
So if you want to learn with me, join the group and let's grow together ❤️
I just created a chat group for everyone who wants to learn about crypto trading, and it's called @SkullXBT Teachings.
This is the place where we can talk about every piece of knowledge you need about trading. You can ask me about my setups, like why I took a trade, where I entered, and what I was seeing on the chart.
You can also ask me anything about $BTC or other altcoins, or about what's going on in the market right now. Whatever you want to know, just ask me there.
So if you want to learn with me, join the group and let's grow together ❤️

6
5
298
·
--
Bearish
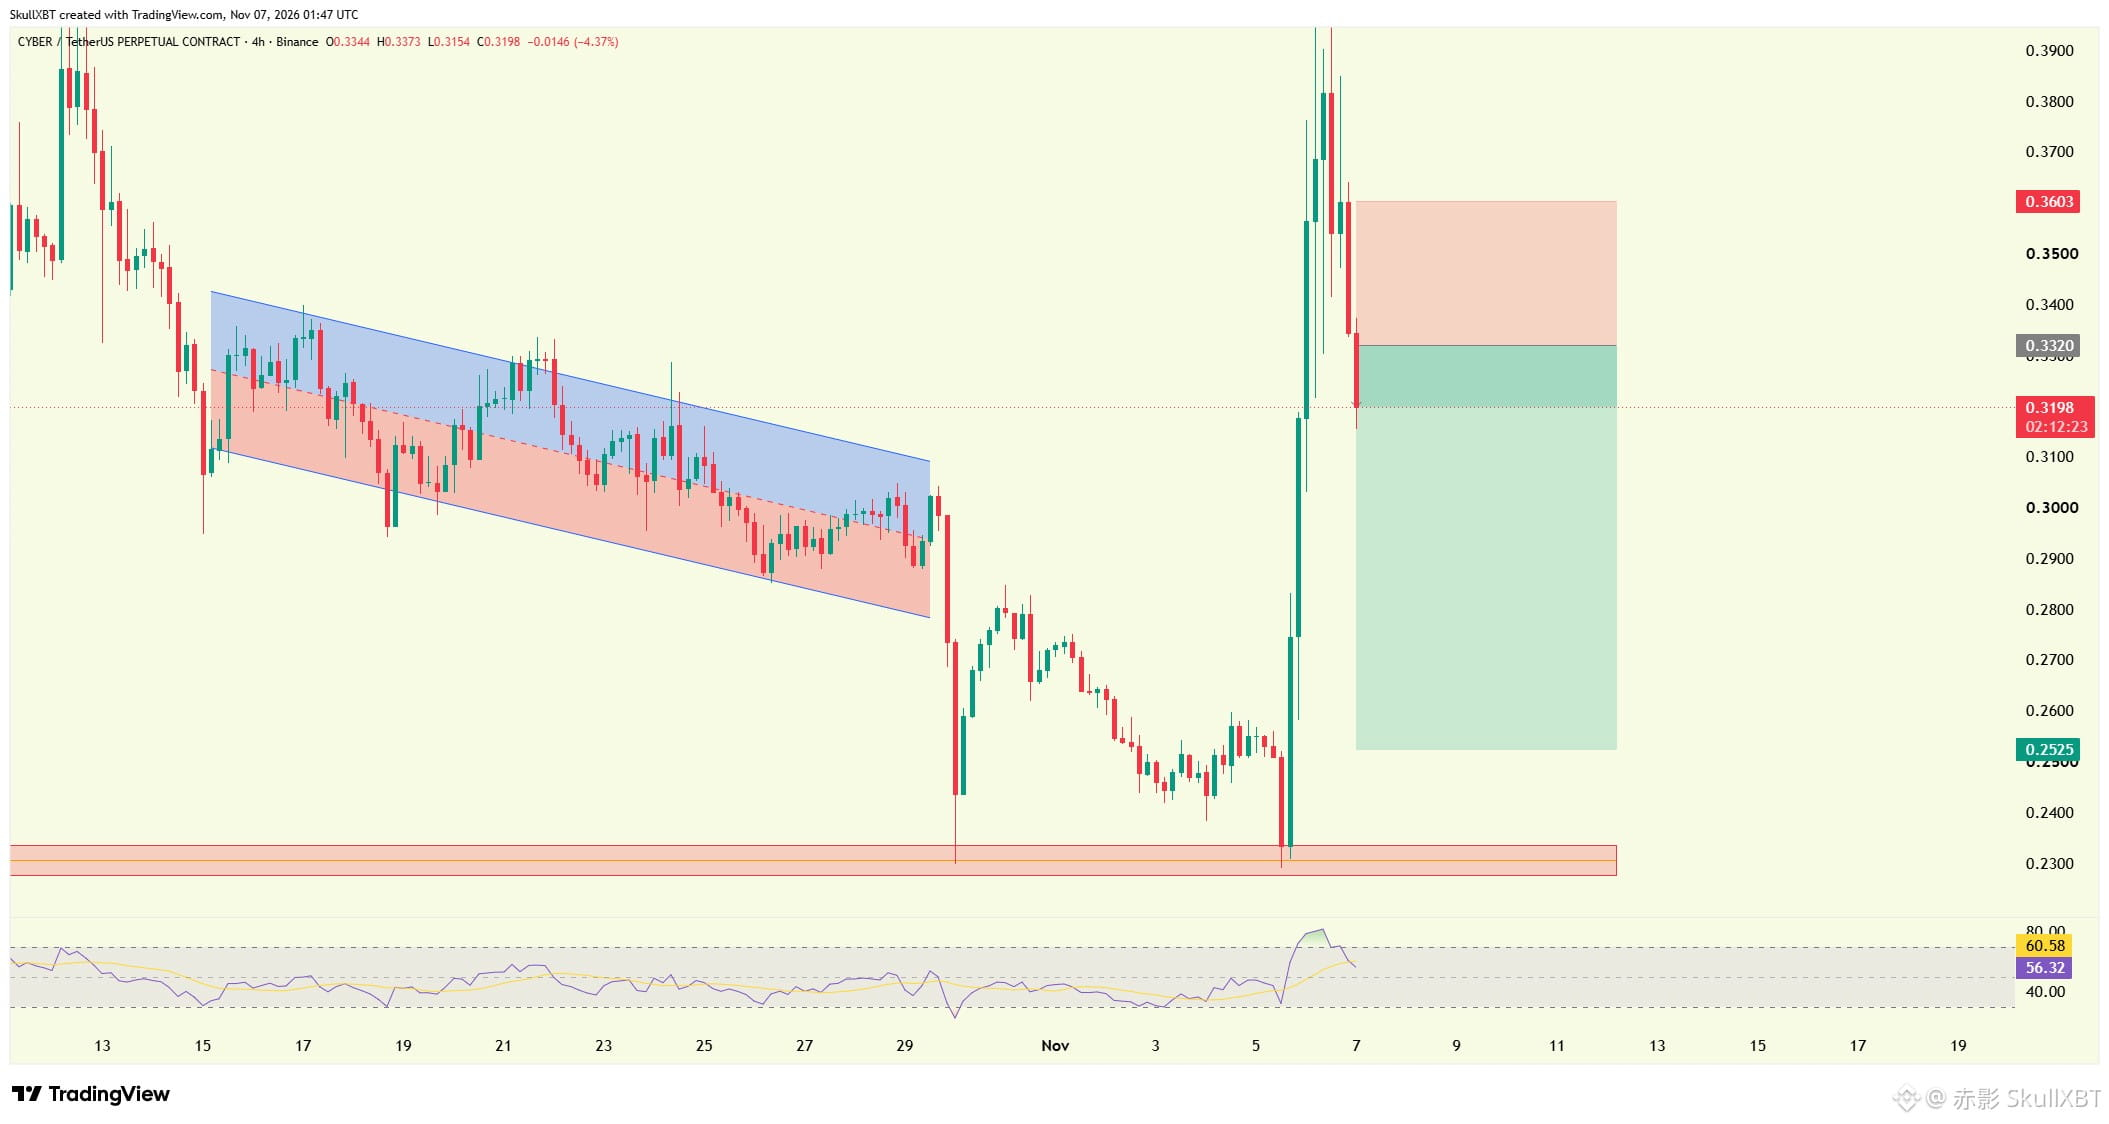
Buyers are still waiting for $CYBER to bounce back. Price seems to have other plans. 👀
I'm opening a SHORT on CYBER here, around 0.32.
TP: 0.290 - 0.252
Invalidation: 0.360 👇🏻
{future}(CYBERUSDT)
The reversal has been strong, and price is already pushing itself lower instead of waiting for buyers to show up. Dip buyers haven't taken control back yet, and that's the part I'm watching.
If CYBER keeps rolling over, it could give back the whole buyers' move and head into that 0.290 - 0.252 zone.
A move back above 0.360 and the idea is wrong. Simple as that.
So are buyers ready to defend this area, or is it already too late?
Buyers are still waiting for $CYBER to bounce back. Price seems to have other plans. 👀
I'm opening a SHORT on CYBER here, around 0.32.
TP: 0.290 - 0.252
Invalidation: 0.360 👇🏻
The reversal has been strong, and price is already pushing itself lower instead of waiting for buyers to show up. Dip buyers haven't taken control back yet, and that's the part I'm watching.
If CYBER keeps rolling over, it could give back the whole buyers' move and head into that 0.290 - 0.252 zone.
A move back above 0.360 and the idea is wrong. Simple as that.
So are buyers ready to defend this area, or is it already too late?
I'm opening a SHORT on CYBER here, around 0.32.
TP: 0.290 - 0.252
Invalidation: 0.360 👇🏻
The reversal has been strong, and price is already pushing itself lower instead of waiting for buyers to show up. Dip buyers haven't taken control back yet, and that's the part I'm watching.
If CYBER keeps rolling over, it could give back the whole buyers' move and head into that 0.290 - 0.252 zone.
A move back above 0.360 and the idea is wrong. Simple as that.
So are buyers ready to defend this area, or is it already too late?
8
1
5
626
·
--
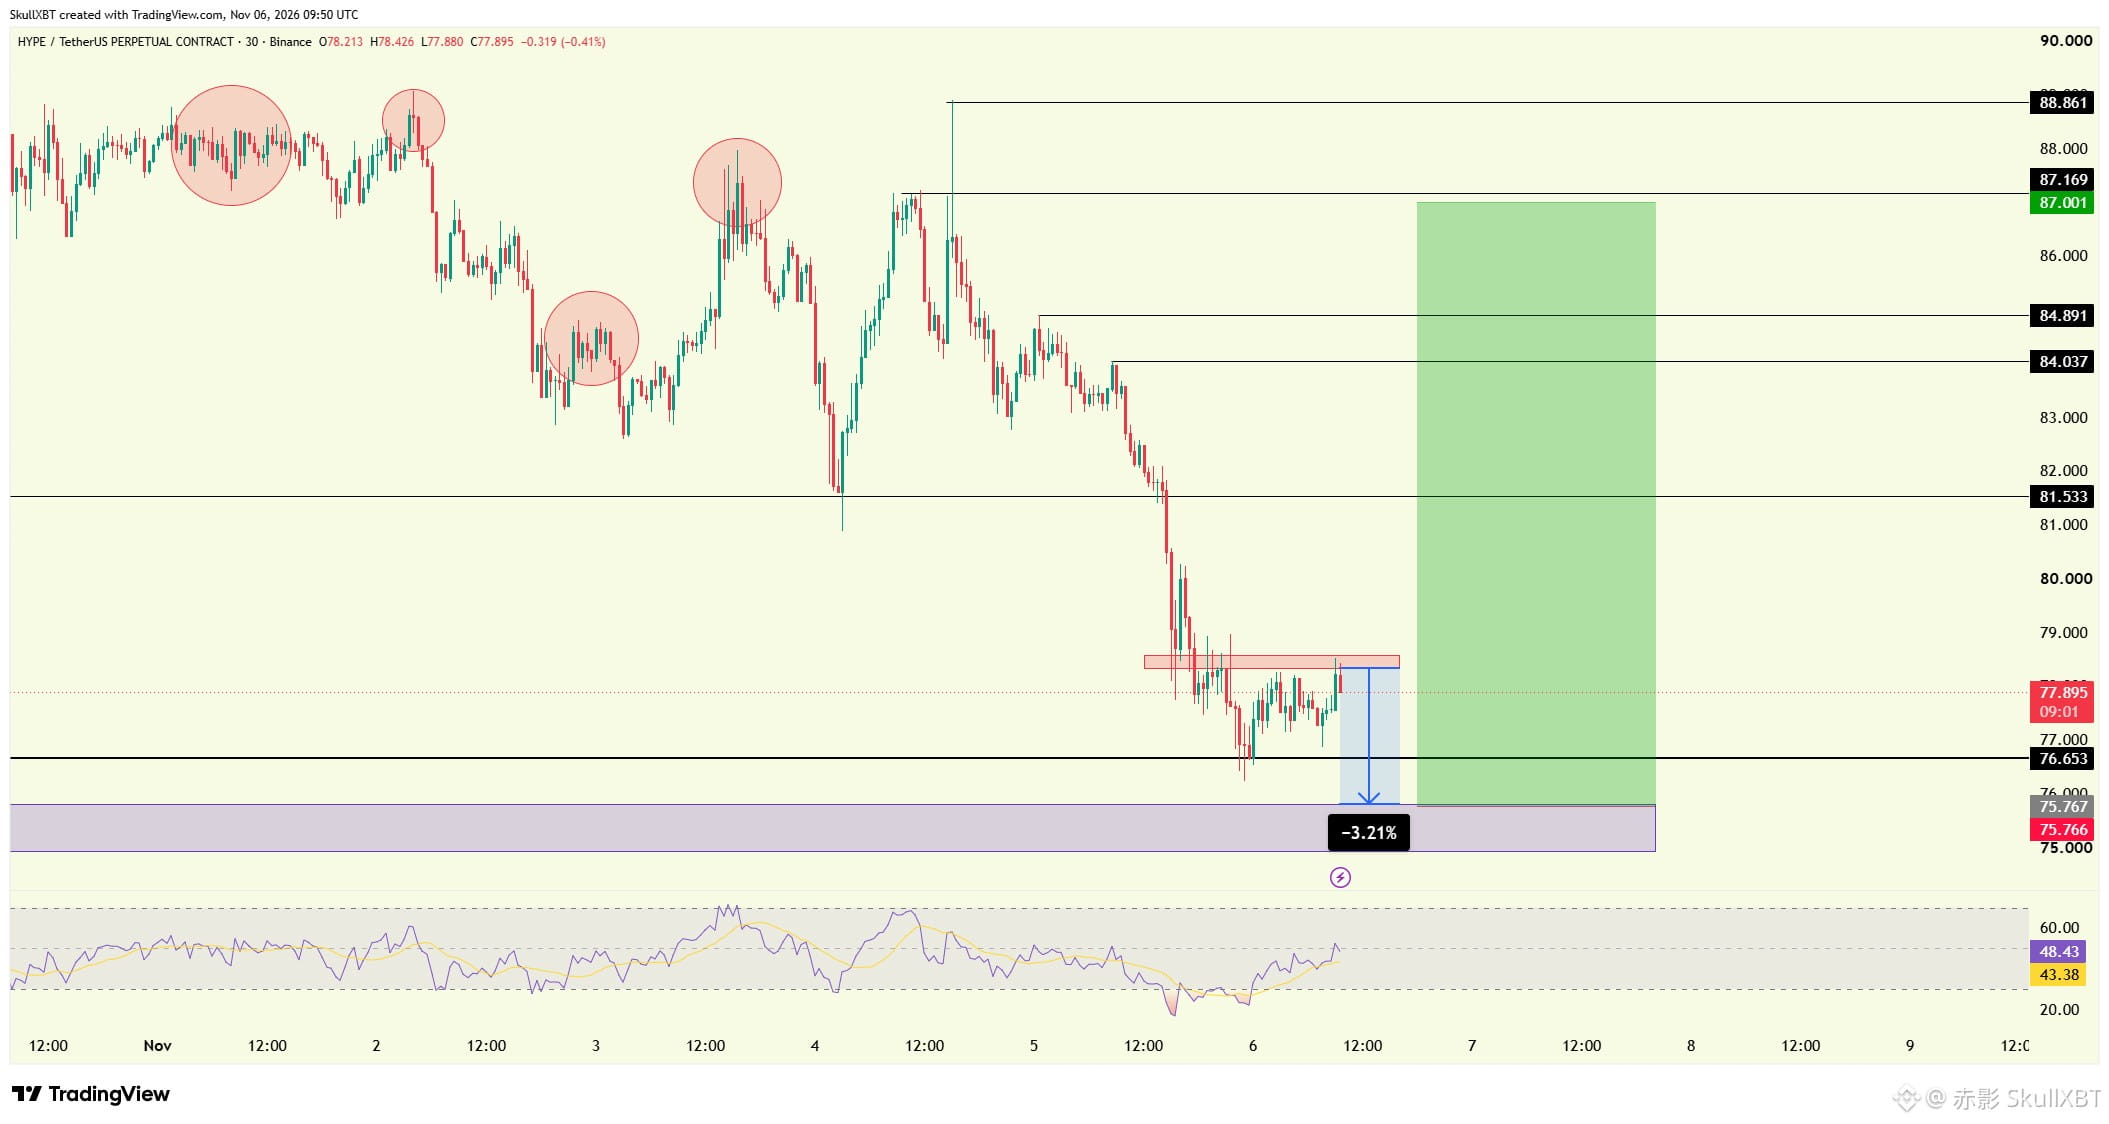
Guys, there's a big opportunity forming on $HYPE, and I want to walk you through how I'm planning it 🔥
Price already dumped very hard, but I always remind myself of one thing. What falls hard usually pulls back, and $HYPE is getting ready for a strong move upside.
Before that happens, I'm expecting a rejection from the resistance. So first, I'm opening a short-term short toward $75.8.
After that comes the second part. I'm placing a limit at $75.76, and from there I'm going for the targets at the upside liquidity zones, with $87 as my last target.
On the way up, I'm taking partials with a full DCA plan. My risk stays at 2-5% of my capital, because I manage that carefully.
So it's a short first, then a bounce. Let's see how $HYPE plays it ❗️
{future}(HYPEUSDT)
Guys, there's a big opportunity forming on $HYPE , and I want to walk you through how I'm planning it 🔥
Price already dumped very hard, but I always remind myself of one thing. What falls hard usually pulls back, and $HYPE is getting ready for a strong move upside.
Before that happens, I'm expecting a rejection from the resistance. So first, I'm opening a short-term short toward $75.8.
After that comes the second part. I'm placing a limit at $75.76, and from there I'm going for the targets at the upside liquidity zones, with $87 as my last target.
On the way up, I'm taking partials with a full DCA plan. My risk stays at 2-5% of my capital, because I manage that carefully.
So it's a short first, then a bounce. Let's see how $HYPE plays it ❗️
Price already dumped very hard, but I always remind myself of one thing. What falls hard usually pulls back, and $HYPE is getting ready for a strong move upside.
Before that happens, I'm expecting a rejection from the resistance. So first, I'm opening a short-term short toward $75.8.
After that comes the second part. I'm placing a limit at $75.76, and from there I'm going for the targets at the upside liquidity zones, with $87 as my last target.
On the way up, I'm taking partials with a full DCA plan. My risk stays at 2-5% of my capital, because I manage that carefully.
So it's a short first, then a bounce. Let's see how $HYPE plays it ❗️
16
1
5
1.5k
·
--
Bullish
Everything below $NEAR has already been swept, and that matters more than most people think 🔥
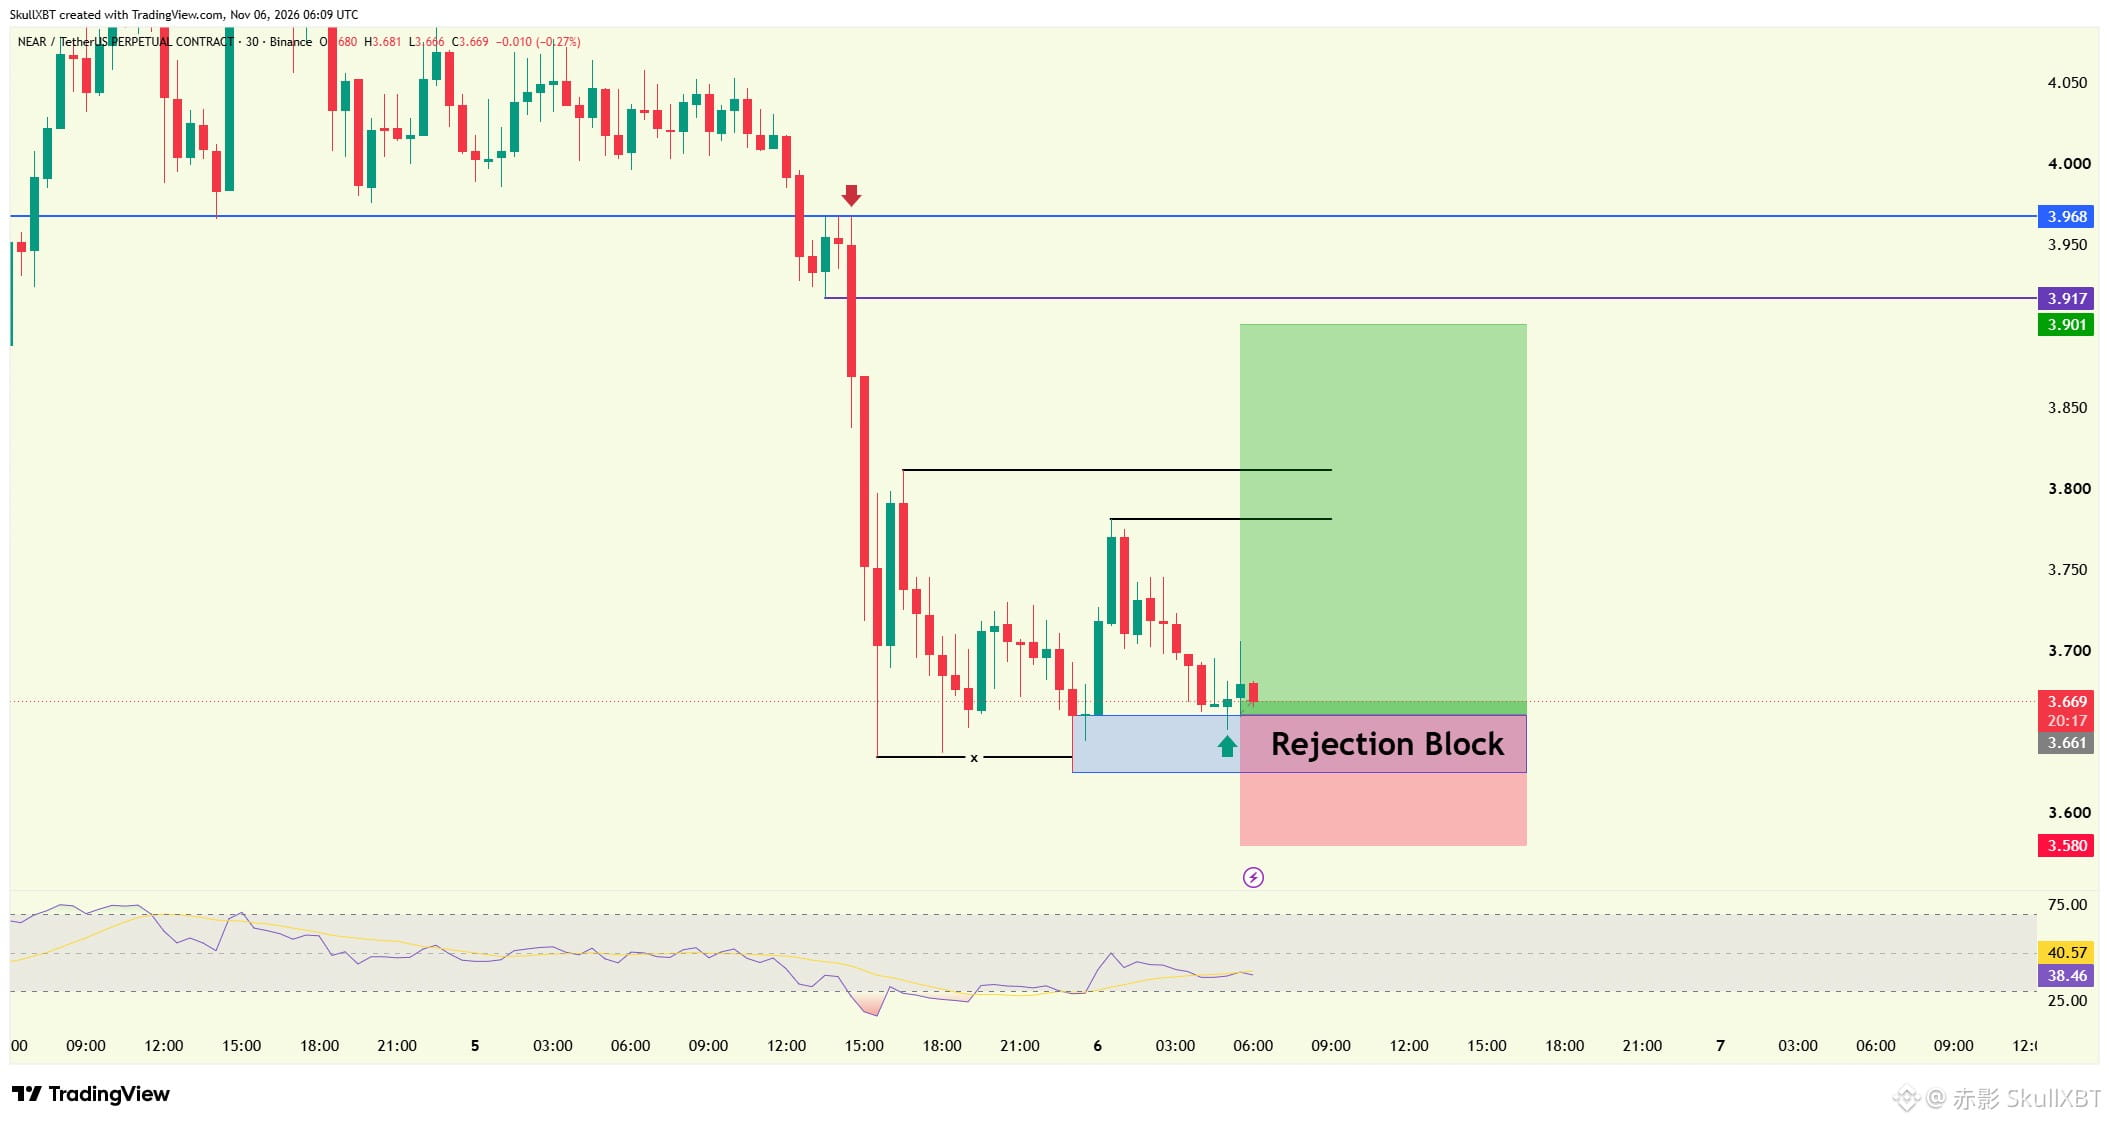
I'm opening a BIG LONG on $NEAR here.
TP: 3.80-3.90
Invalidation: 3.58
{future}(NEARUSDT)
Price already took the whole liquidity from the downside, so there is nothing left down there to pull it lower. That's why I think a pullback upside is coming from here.
Now look at the chart itself. Price is sitting on a rejection block, and the wick is showing strong volume, which tells me buyers are stepping in with real force ❗️
When the downside liquidity is gone and a wick like that shows up, I like to follow the move upside and not stand in front of it. I think it can wipe out the sellers' dump completely 💯
Everything below $NEAR has already been swept, and that matters more than most people think 🔥
I'm opening a BIG LONG on $NEAR here.
TP: 3.80-3.90
Invalidation: 3.58
Price already took the whole liquidity from the downside, so there is nothing left down there to pull it lower. That's why I think a pullback upside is coming from here.
Now look at the chart itself. Price is sitting on a rejection block, and the wick is showing strong volume, which tells me buyers are stepping in with real force ❗️
When the downside liquidity is gone and a wick like that shows up, I like to follow the move upside and not stand in front of it. I think it can wipe out the sellers' dump completely 💯
I'm opening a BIG LONG on $NEAR here.
TP: 3.80-3.90
Invalidation: 3.58
Price already took the whole liquidity from the downside, so there is nothing left down there to pull it lower. That's why I think a pullback upside is coming from here.
Now look at the chart itself. Price is sitting on a rejection block, and the wick is showing strong volume, which tells me buyers are stepping in with real force ❗️
When the downside liquidity is gone and a wick like that shows up, I like to follow the move upside and not stand in front of it. I think it can wipe out the sellers' dump completely 💯
13
1
7
2.8k
·
--
Bullish
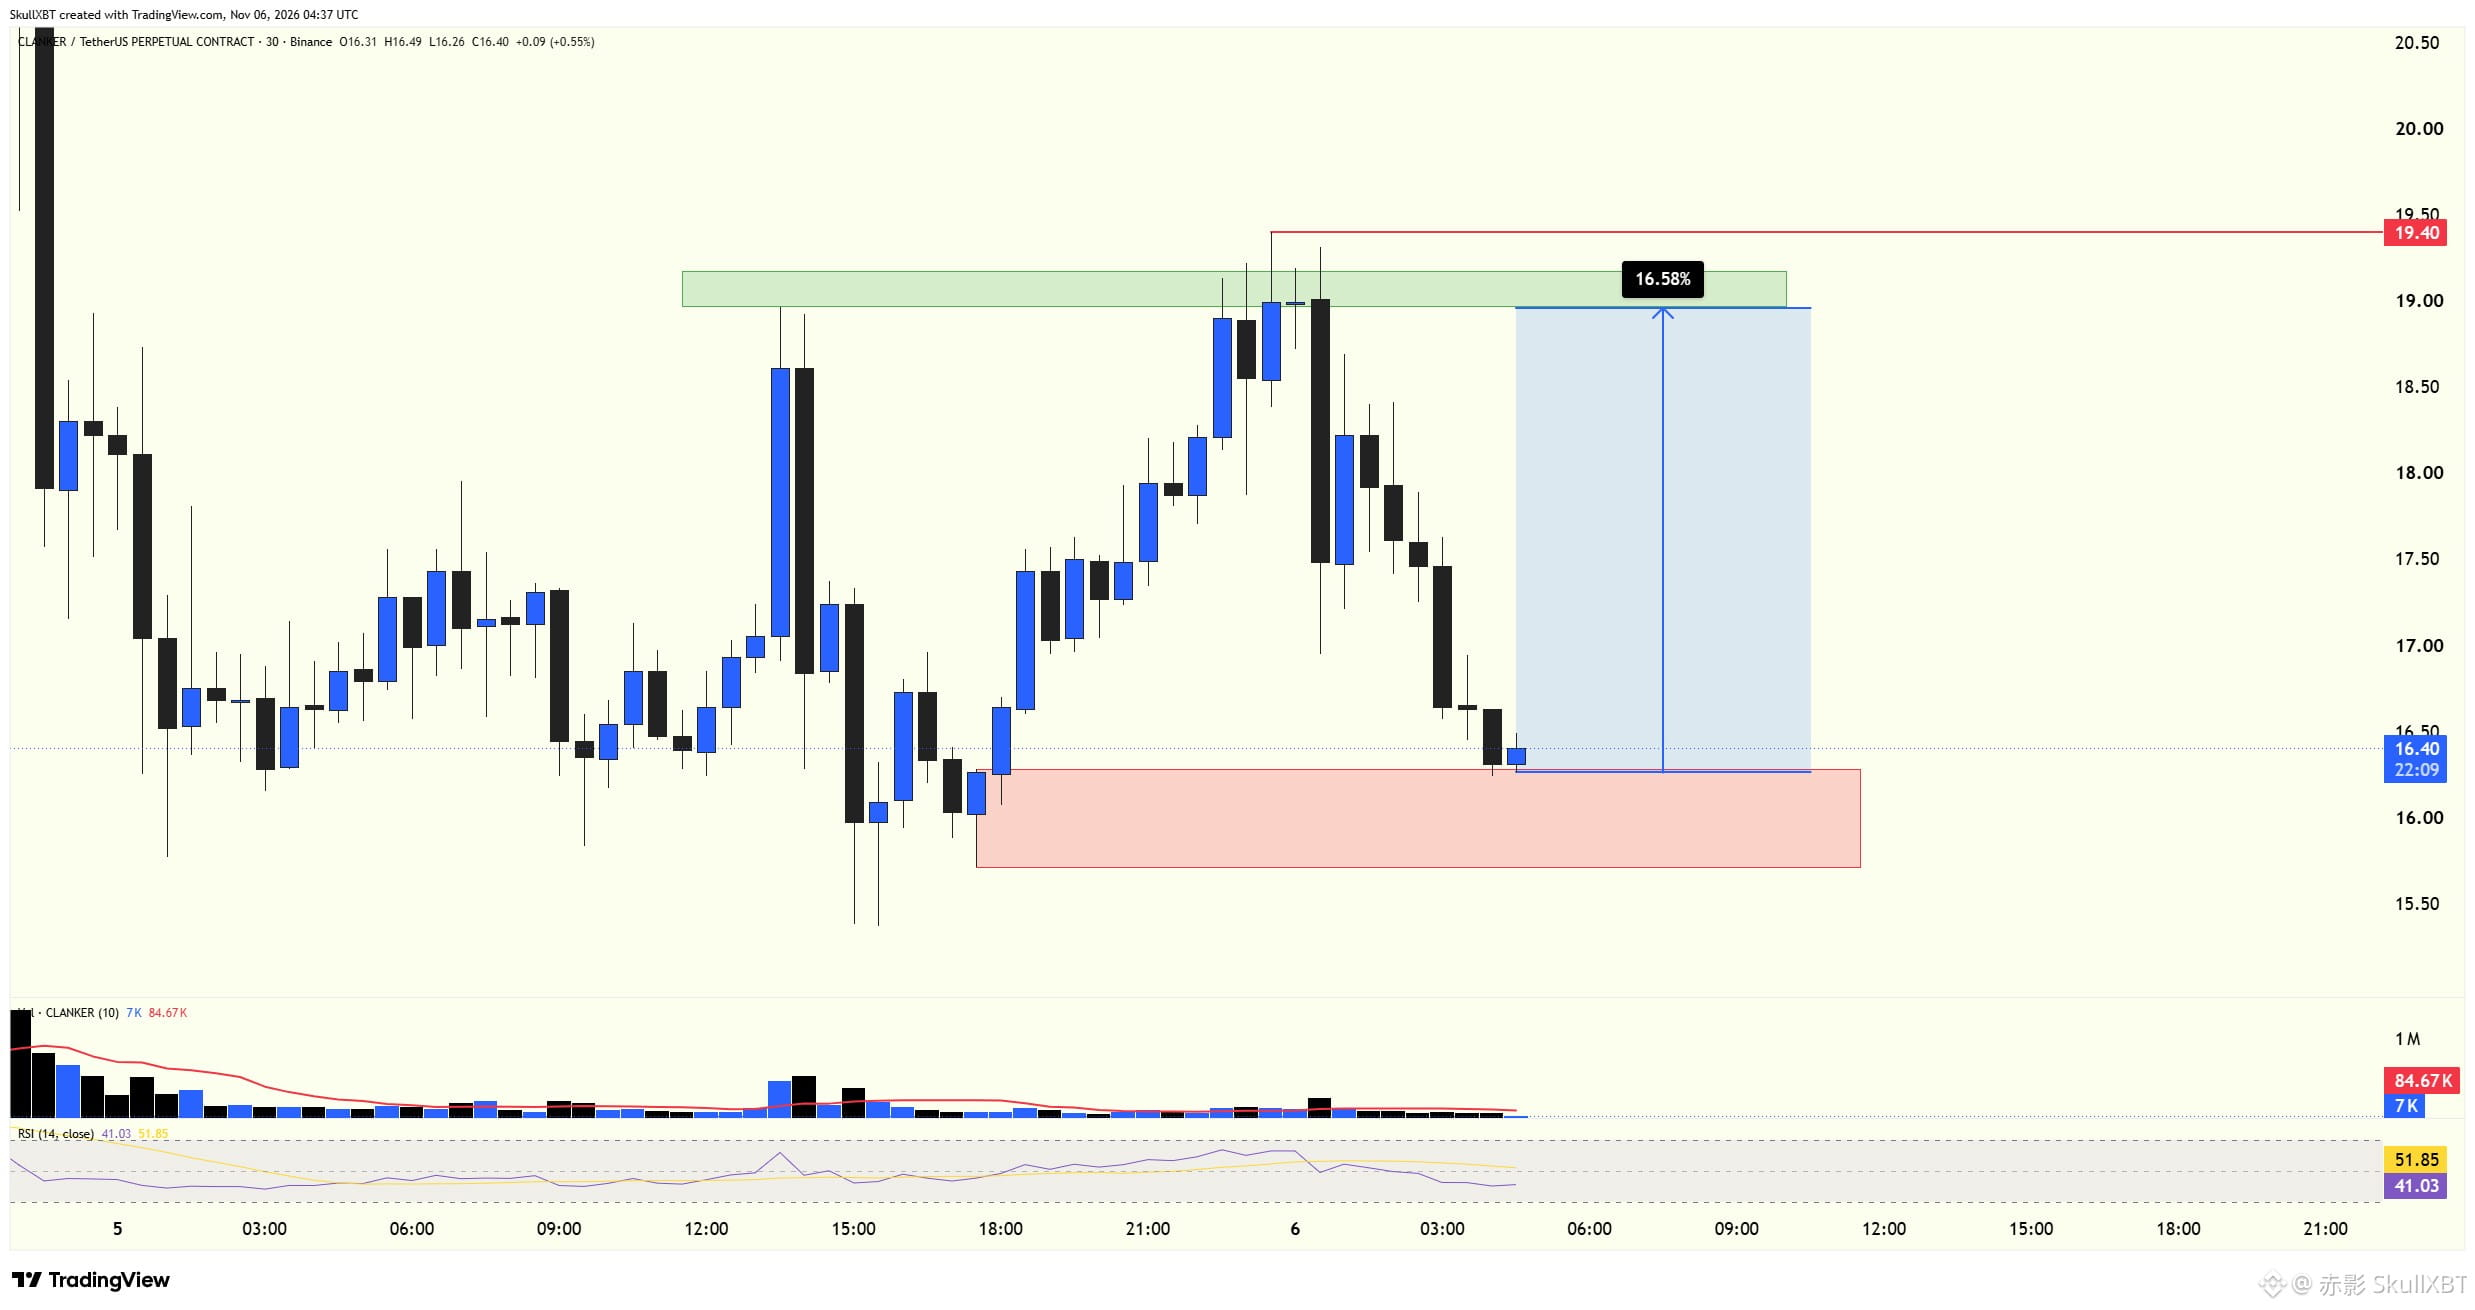
$CLANKER is getting ready for a bounce, and I'm watching it closely 🔥
Price is sitting on a demand zone right now, and it is already getting rejected toward the upside from there. That tells me buyers are stepping in at this level. The first area I'm watching is $16.1-16.2, and from there I think price can push directly toward $19.0, near the resistance at the recent high on the lower timeframe ❗️
I'll be honest with you, guys, there are some bricks on the way up, so it won't be a smooth ride. That's why I'm planning to take some partials along the way, and I'll let the rest of the position keep running 💯
{future}(CLANKERUSDT)
$CLANKER is getting ready for a bounce, and I'm watching it closely 🔥
Price is sitting on a demand zone right now, and it is already getting rejected toward the upside from there. That tells me buyers are stepping in at this level. The first area I'm watching is $16.1-16.2, and from there I think price can push directly toward $19.0, near the resistance at the recent high on the lower timeframe ❗️
I'll be honest with you, guys, there are some bricks on the way up, so it won't be a smooth ride. That's why I'm planning to take some partials along the way, and I'll let the rest of the position keep running 💯
Price is sitting on a demand zone right now, and it is already getting rejected toward the upside from there. That tells me buyers are stepping in at this level. The first area I'm watching is $16.1-16.2, and from there I think price can push directly toward $19.0, near the resistance at the recent high on the lower timeframe ❗️
I'll be honest with you, guys, there are some bricks on the way up, so it won't be a smooth ride. That's why I'm planning to take some partials along the way, and I'll let the rest of the position keep running 💯
15
1
6
2.3k
·
--
Bearish
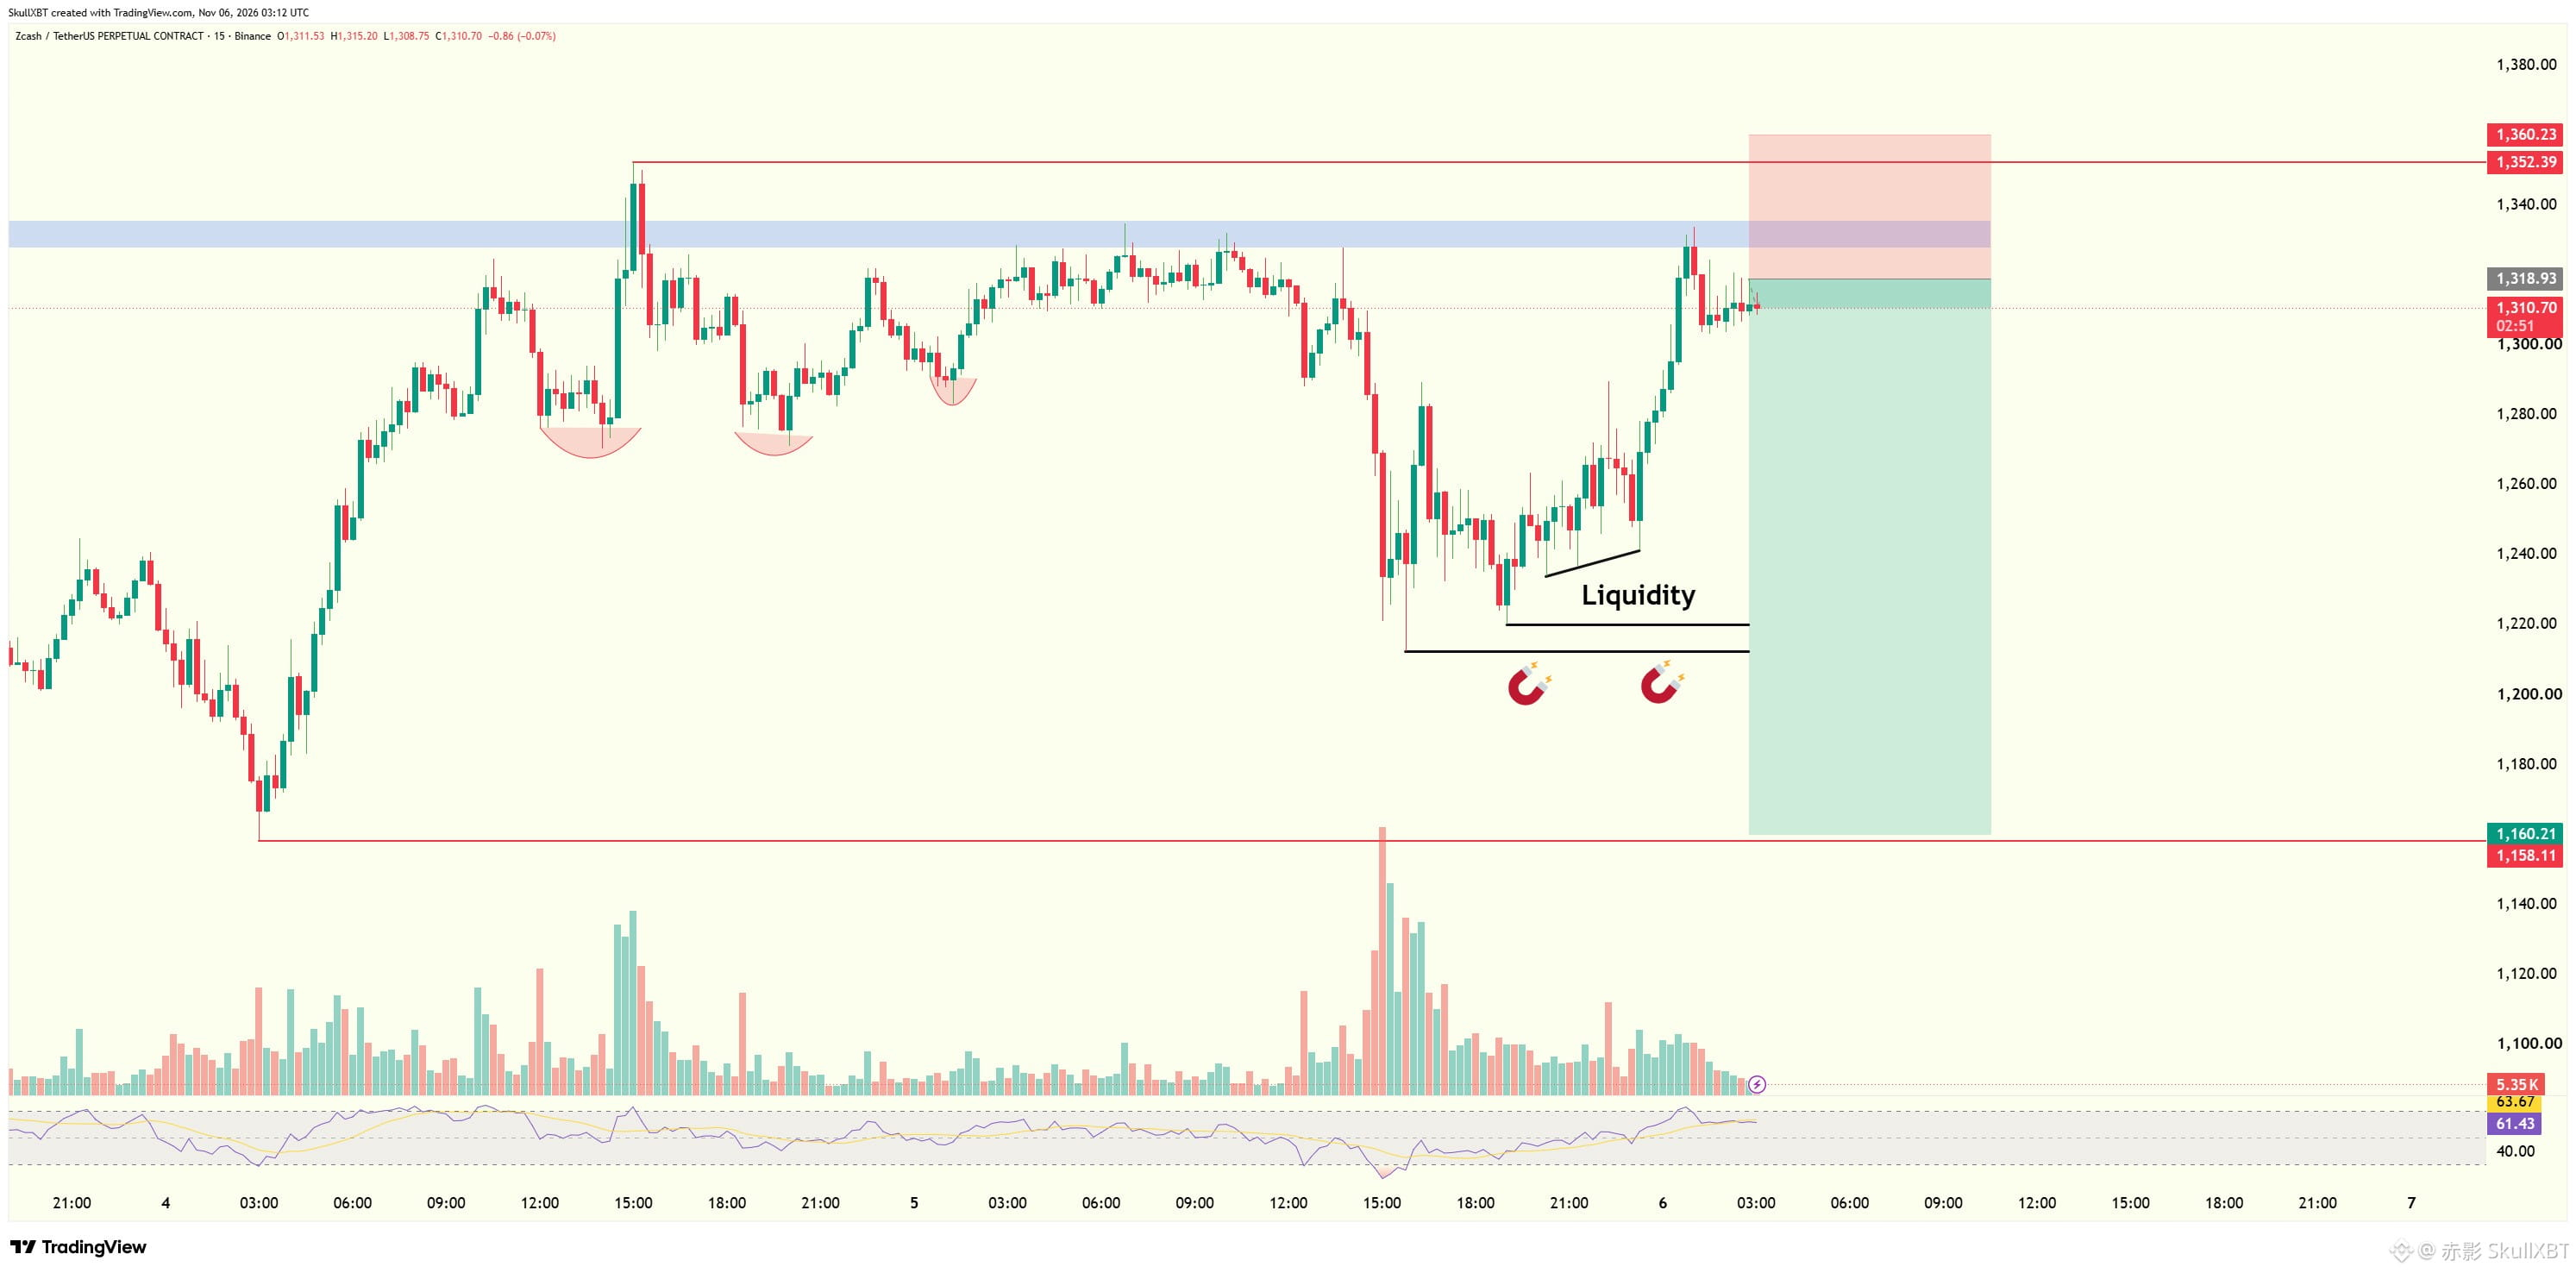
Sellers on $ZEC are finally showing their hand, and I don't think this rejection is random 🚨
I'm opening a BIG SHORT on $ZEC here.
TP: 1,240 - 1,160
Invalidation: 1,360
{future}(ZECUSDT)
Price is getting rejected from a resistance zone, and that is the first thing that caught my eye. When sellers push back at the same area again and again, it usually means the buyers are running out of energy.
Now look at my invalidation. It sits above the weekly liquidity, so it is a safe place, and a small wick won't be enough to take me out.
Then look below. There is a strong liquidity pool sitting downside, and it works like a magnet, because price loves to go and grab liquidity like that. That's why I think a strong fallback is possible from here ‼️
Sellers on $ZEC are finally showing their hand, and I don't think this rejection is random 🚨
I'm opening a BIG SHORT on $ZEC here.
TP: 1,240 - 1,160
Invalidation: 1,360
Price is getting rejected from a resistance zone, and that is the first thing that caught my eye. When sellers push back at the same area again and again, it usually means the buyers are running out of energy.
Now look at my invalidation. It sits above the weekly liquidity, so it is a safe place, and a small wick won't be enough to take me out.
Then look below. There is a strong liquidity pool sitting downside, and it works like a magnet, because price loves to go and grab liquidity like that. That's why I think a strong fallback is possible from here ‼️
I'm opening a BIG SHORT on $ZEC here.
TP: 1,240 - 1,160
Invalidation: 1,360
Price is getting rejected from a resistance zone, and that is the first thing that caught my eye. When sellers push back at the same area again and again, it usually means the buyers are running out of energy.
Now look at my invalidation. It sits above the weekly liquidity, so it is a safe place, and a small wick won't be enough to take me out.
Then look below. There is a strong liquidity pool sitting downside, and it works like a magnet, because price loves to go and grab liquidity like that. That's why I think a strong fallback is possible from here ‼️
17
1
9
3.4k
·
--
Guys, yesterday was a banger 😁 and it came right after I took a day off to rest. Proof that a little rest can pay us back 💯
The whole market crashed yesterday, and we caught some good trades in the middle of it.
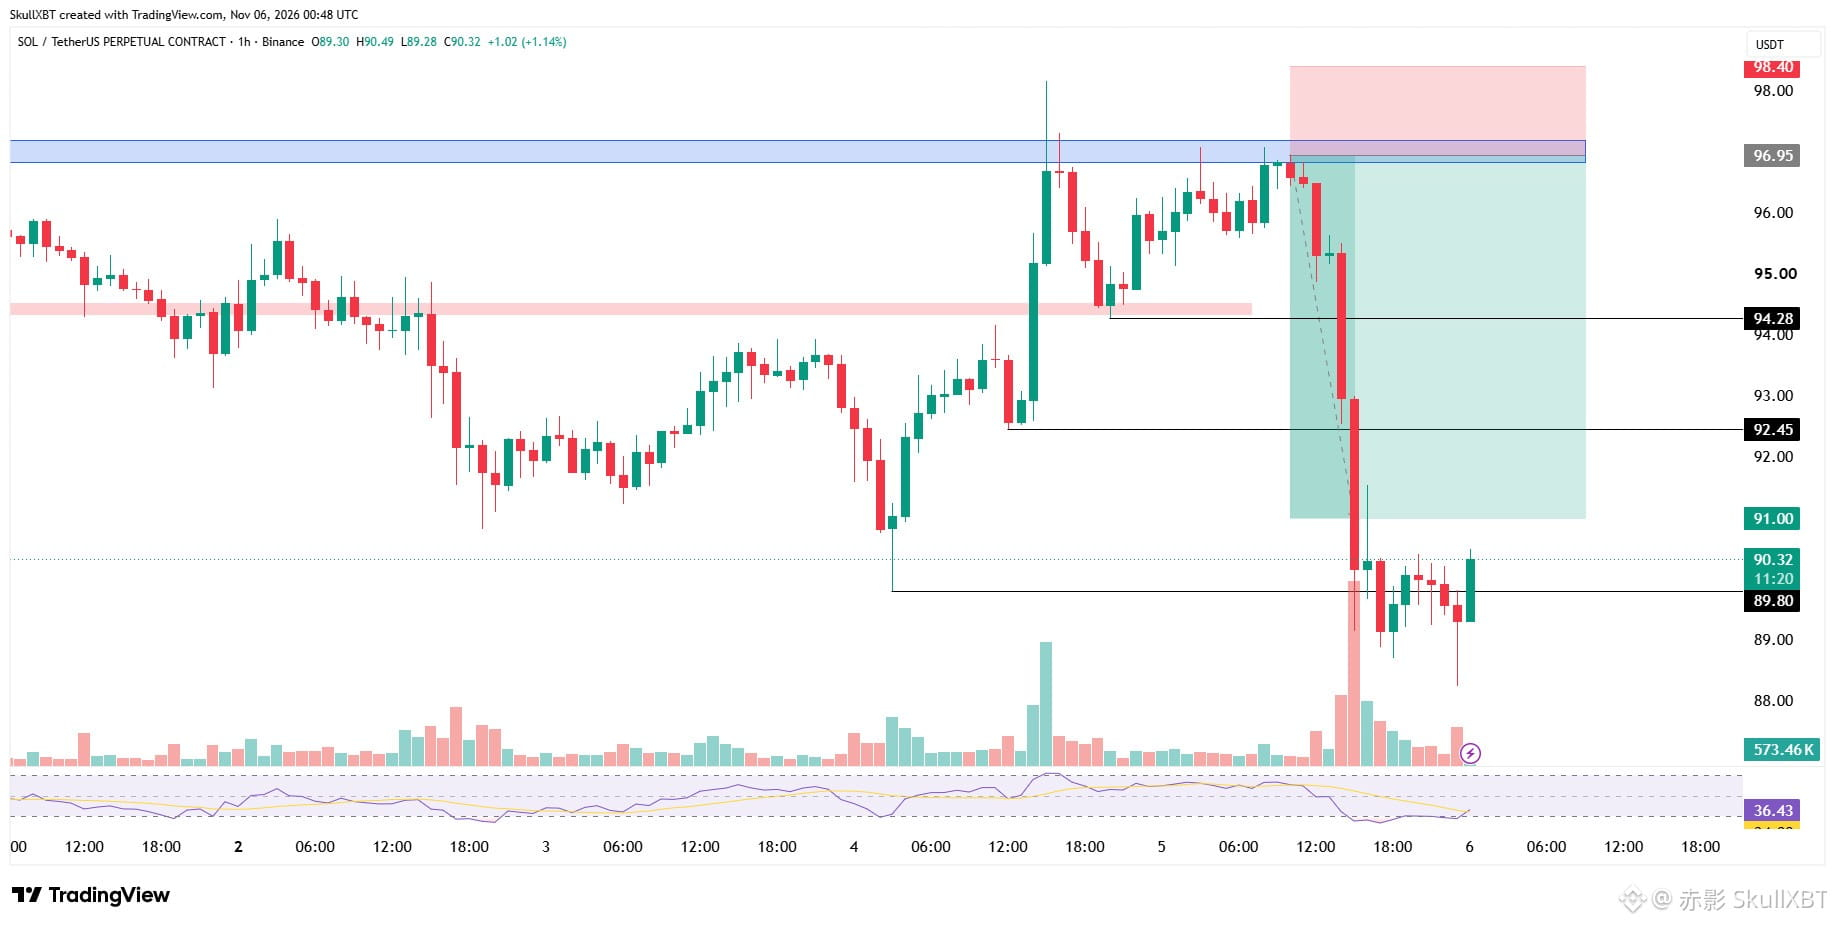
$SOL crashed from the exact point we told you about, and it hit all the targets on the way down.
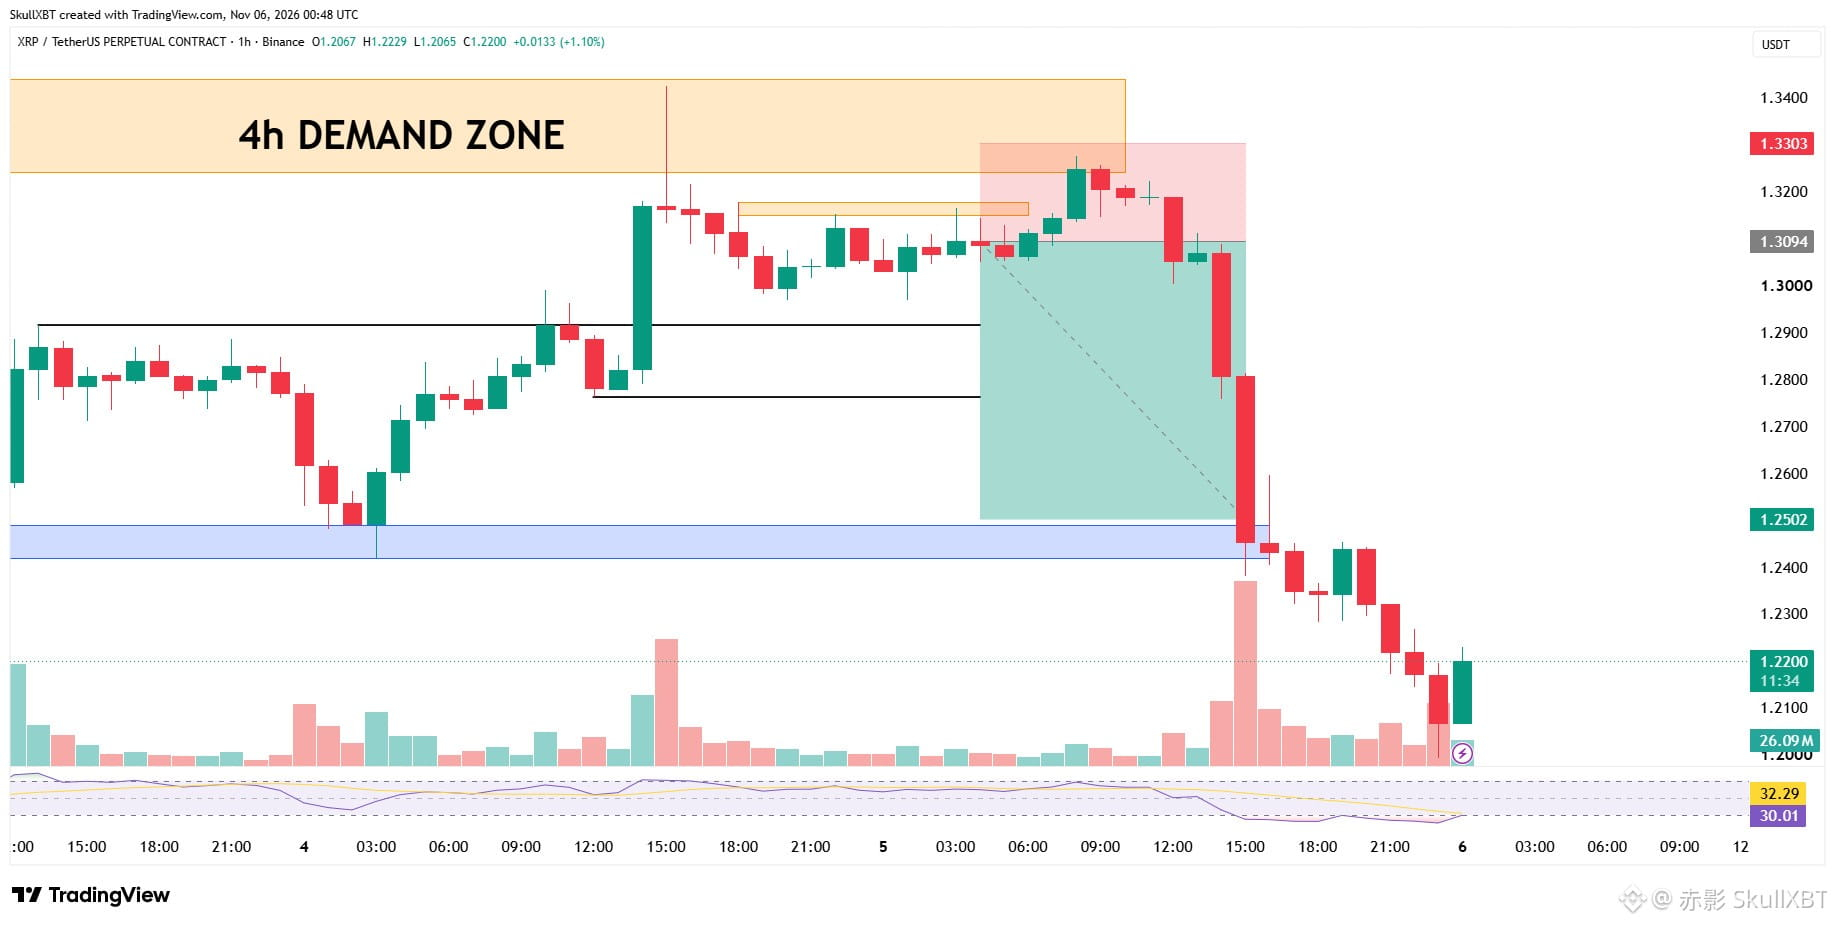
$XRP went straight into the TPs. We took it early, and the price ranged a little above our entry for a while, but it still hit all the targets in the end.
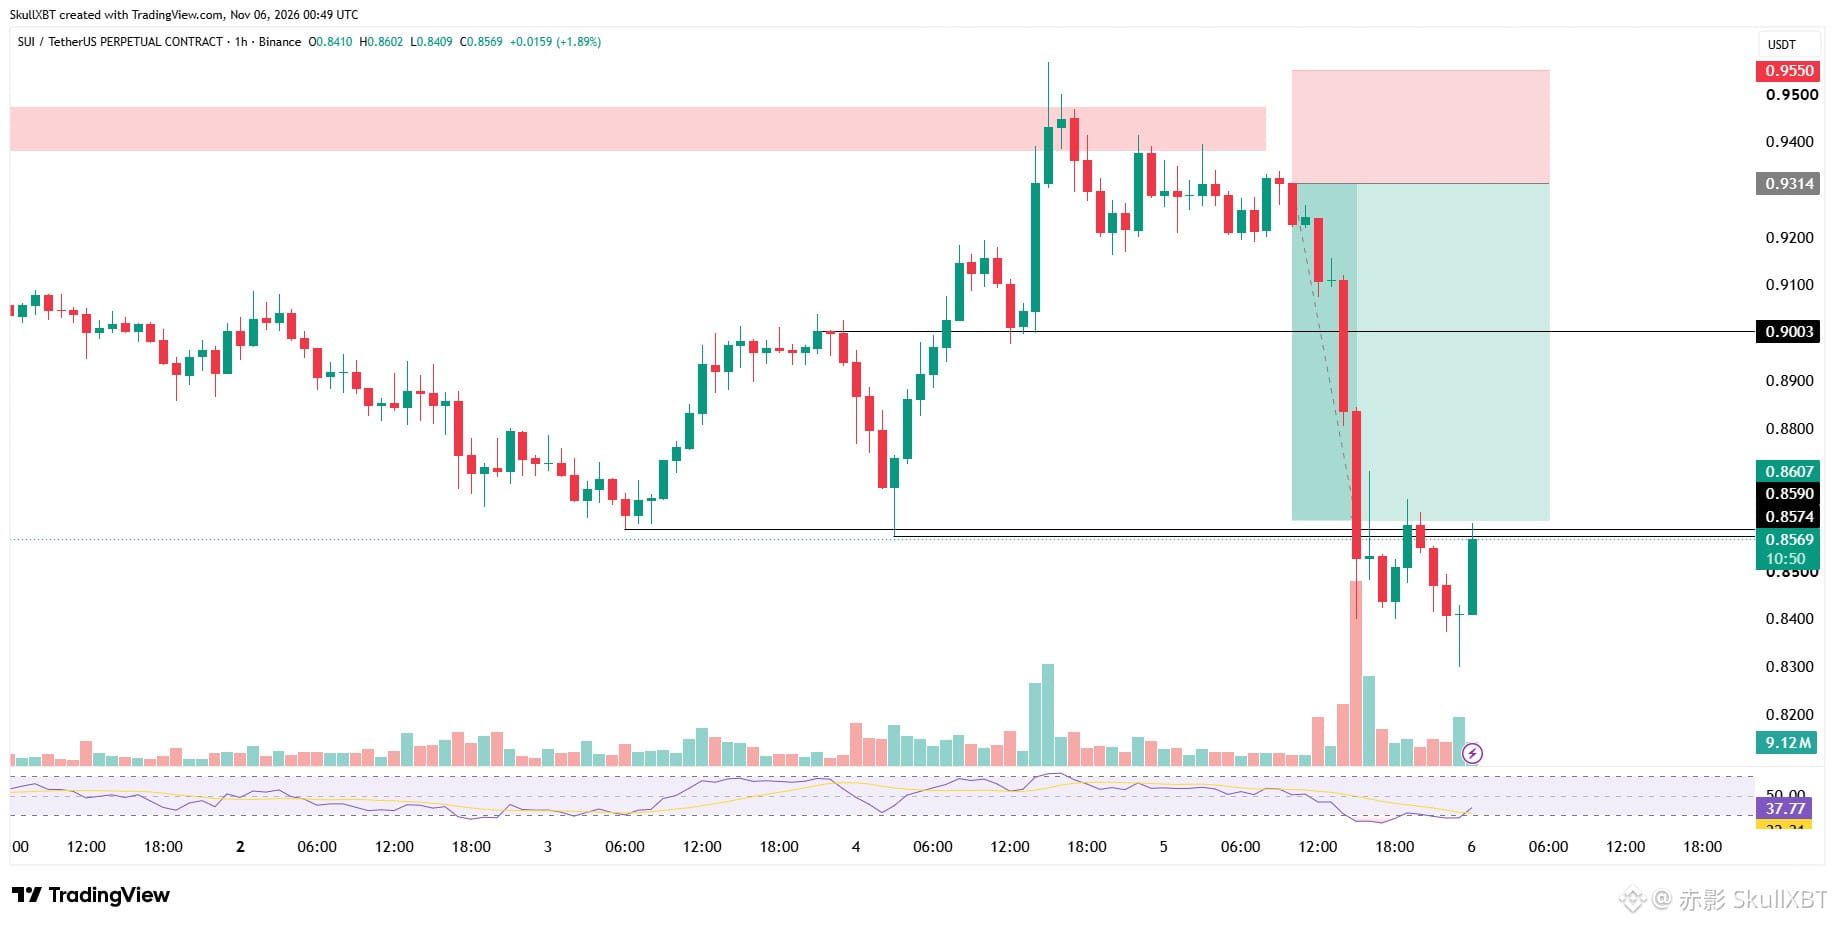
$SUI was phenomenal. It followed my candle reading exactly and moved straight down 🔥
We are going to give our best today too. If you want profits like these, just follow me and stay with the setups. More are coming, and I'm expecting more insane profits ❗️
{future}(SOLUSDT)
{future}(SUIUSDT)
{future}(XRPUSDT)
Guys, yesterday was a banger 😁 and it came right after I took a day off to rest. Proof that a little rest can pay us back 💯
The whole market crashed yesterday, and we caught some good trades in the middle of it.
$SOL crashed from the exact point we told you about, and it hit all the targets on the way down.
$XRP went straight into the TPs. We took it early, and the price ranged a little above our entry for a while, but it still hit all the targets in the end.
$SUI was phenomenal. It followed my candle reading exactly and moved straight down 🔥
We are going to give our best today too. If you want profits like these, just follow me and stay with the setups. More are coming, and I'm expecting more insane profits ❗️
The whole market crashed yesterday, and we caught some good trades in the middle of it.
$SOL crashed from the exact point we told you about, and it hit all the targets on the way down.
$XRP went straight into the TPs. We took it early, and the price ranged a little above our entry for a while, but it still hit all the targets in the end.
$SUI was phenomenal. It followed my candle reading exactly and moved straight down 🔥
We are going to give our best today too. If you want profits like these, just follow me and stay with the setups. More are coming, and I'm expecting more insane profits ❗️
18
1
5
2.6k
·
--
Bearish
Everyone keeps saying this is just a continuation of the bullish trend 👀 I don't think so.
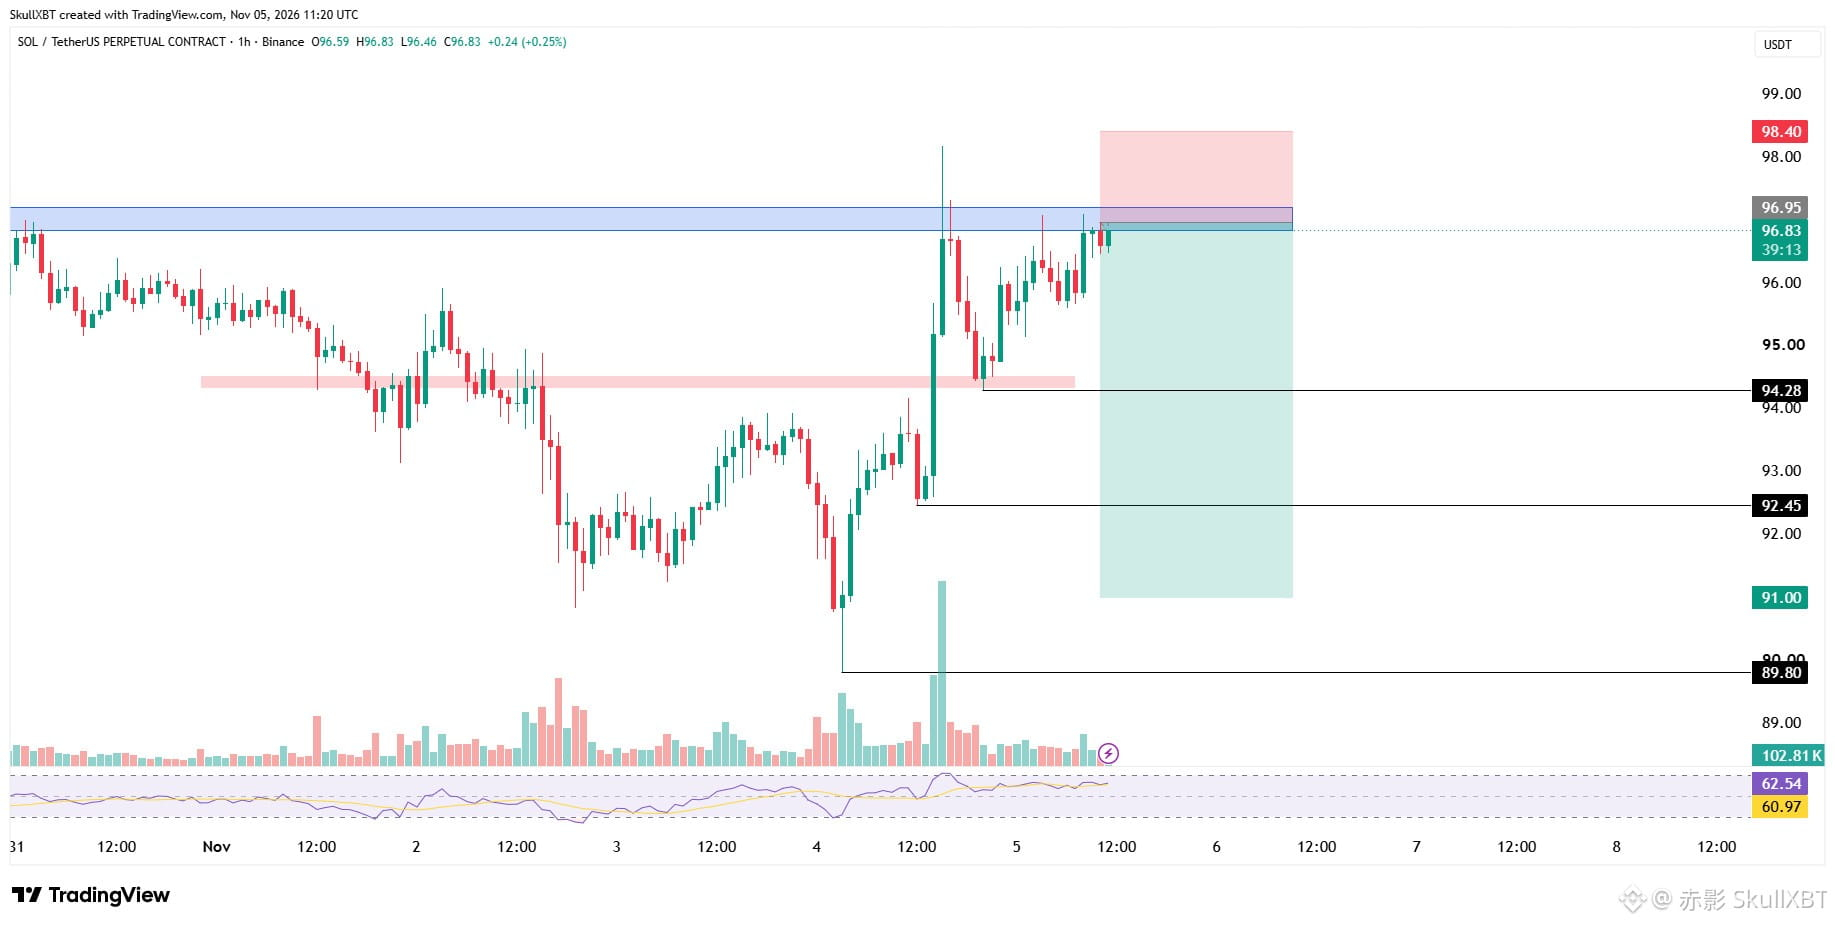
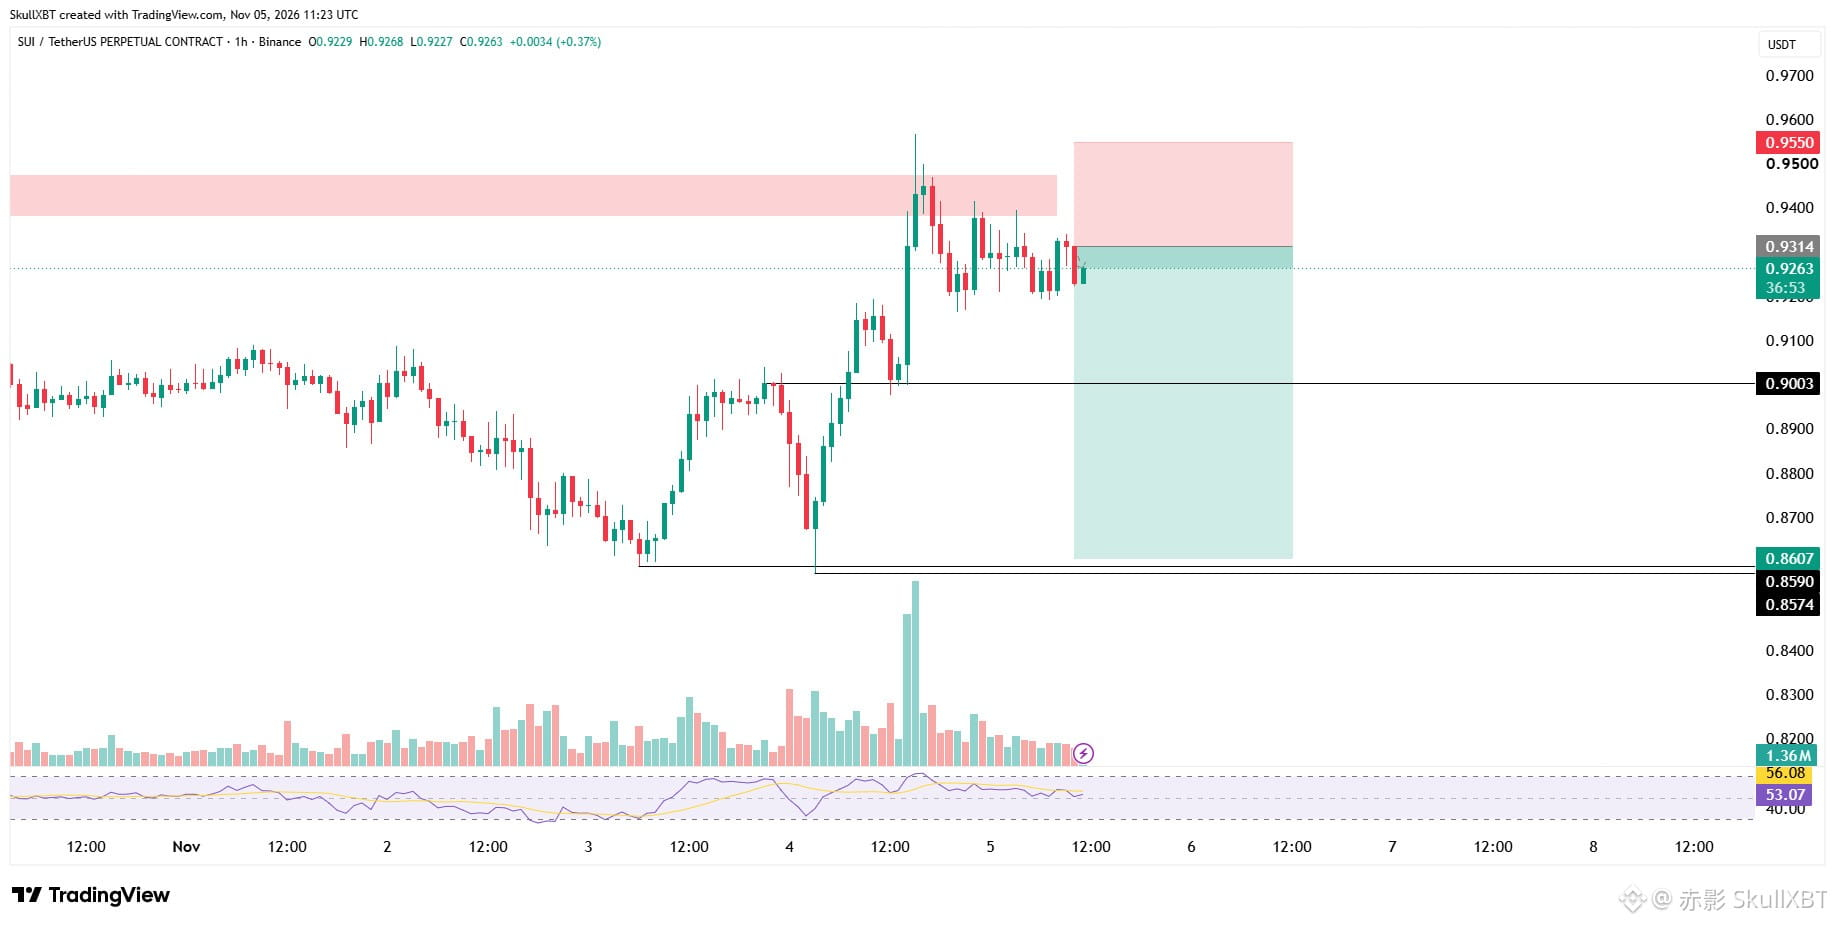
The market has already pumped a lot, and price looks strong here, but look at what's still left on the chart: there's liquidity sitting below that hasn't been taken yet. Price tends to go and clear that liquidity first, and only after that can we see what the market really wants to do. Calling this a clean continuation from this area is too early for me.
That's why I have two short trades 👇🏻
$SOL SHORT
SL: $98.4
TP: $93.5 – $91.0
$SUI SHORT
SL: $0.955
TP: $0.890 – $0.860
{future}(SUIUSDT)
{future}(SOLUSDT)
If price sweeps the downside liquidity and then holds strong, I'll change my view without any problem. Keep your size small and use a proper stop on both 🙏
Everyone keeps saying this is just a continuation of the bullish trend 👀 I don't think so.
The market has already pumped a lot, and price looks strong here, but look at what's still left on the chart: there's liquidity sitting below that hasn't been taken yet. Price tends to go and clear that liquidity first, and only after that can we see what the market really wants to do. Calling this a clean continuation from this area is too early for me.
That's why I have two short trades 👇🏻
$SOL SHORT
SL: $98.4
TP: $93.5 – $91.0
$SUI SHORT
SL: $0.955
TP: $0.890 – $0.860
If price sweeps the downside liquidity and then holds strong, I'll change my view without any problem. Keep your size small and use a proper stop on both 🙏
The market has already pumped a lot, and price looks strong here, but look at what's still left on the chart: there's liquidity sitting below that hasn't been taken yet. Price tends to go and clear that liquidity first, and only after that can we see what the market really wants to do. Calling this a clean continuation from this area is too early for me.
That's why I have two short trades 👇🏻
$SOL SHORT
SL: $98.4
TP: $93.5 – $91.0
$SUI SHORT
SL: $0.955
TP: $0.890 – $0.860
If price sweeps the downside liquidity and then holds strong, I'll change my view without any problem. Keep your size small and use a proper stop on both 🙏
15
1
10
2.6k
·
--
Bullish
$JCT pushed higher the whole day 📈 and then came the dump. Price went down very hard and a lot of people started calling it finished.
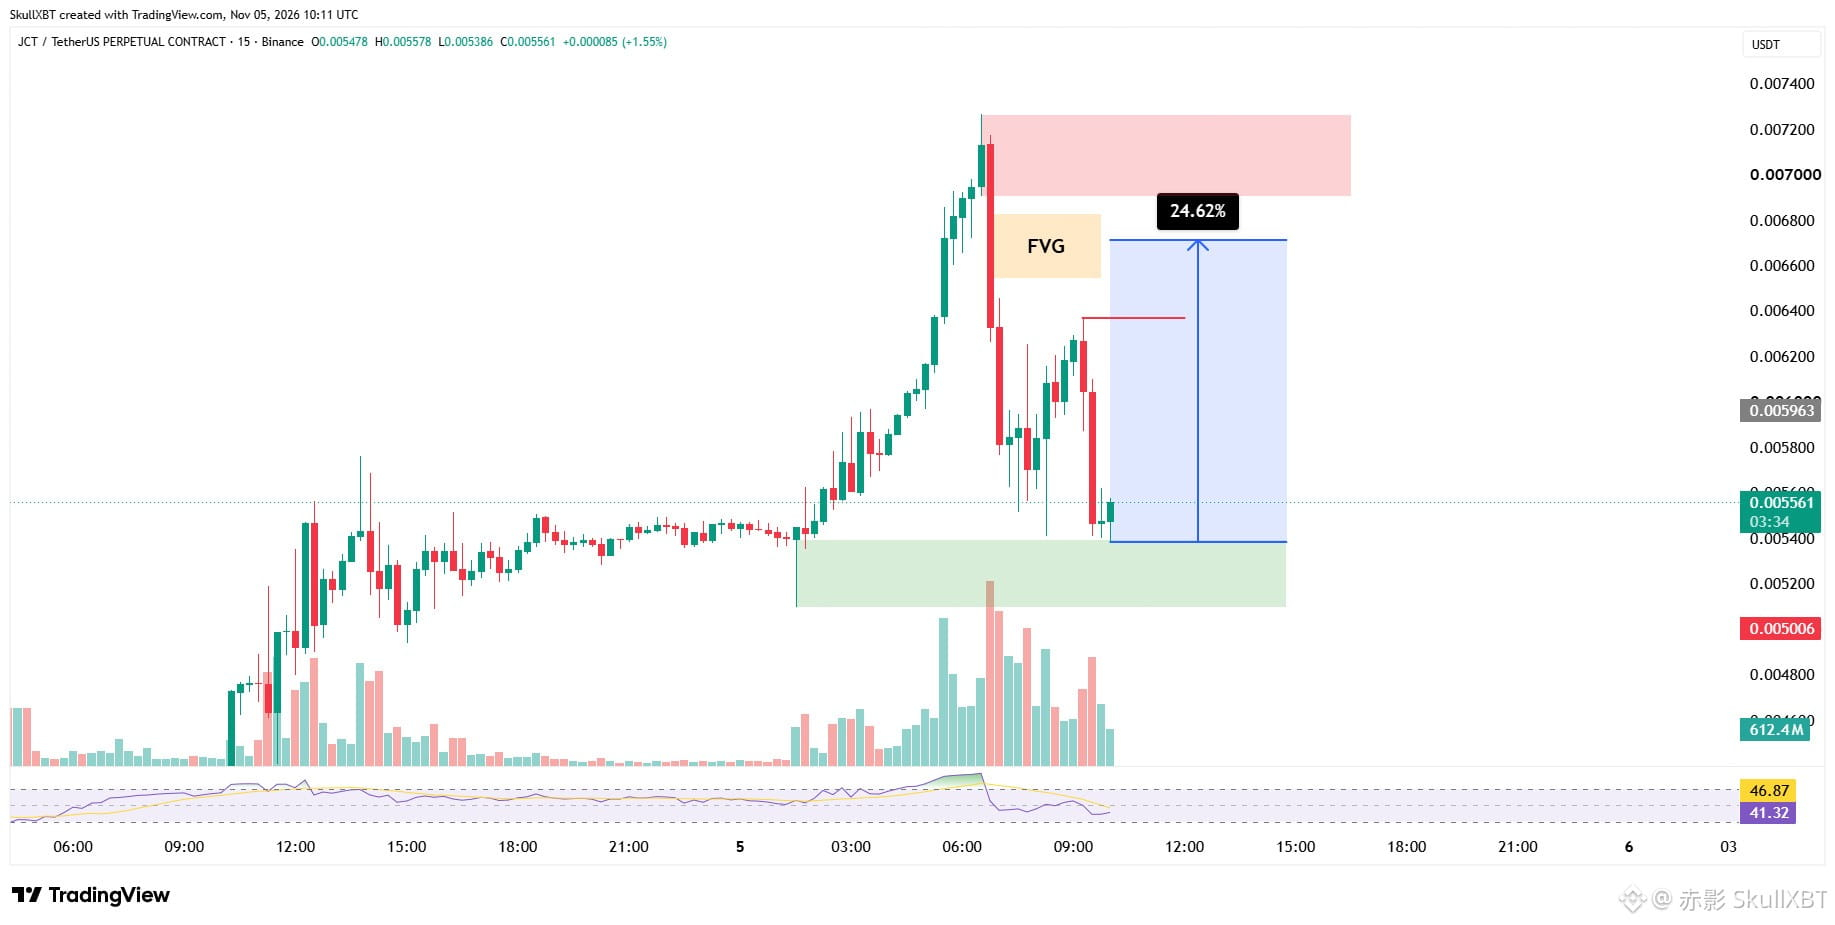
But look at what's happening now 👀 Price is getting buying momentum from a rejection wick zone. A rejection wick means sellers pushed price down there but buyers refused to give it up and pushed it back. When that happens after a hard dump, it often shows that the selling pressure is running out.
According to my analysis of this chart, I'm expecting a push of around 24% upside from here, toward $0.0067 🎯
{future}(JCTUSDT)
This is my analysis and not a trade setup, so there's no exact entry, TP or SL. If you take it yourself, keep the risk small and don't trade it with a liquidation price close to your entry 🙏
I'll update you when price reaches that area.
$JCT pushed higher the whole day 📈 and then came the dump. Price went down very hard and a lot of people started calling it finished.
But look at what's happening now 👀 Price is getting buying momentum from a rejection wick zone. A rejection wick means sellers pushed price down there but buyers refused to give it up and pushed it back. When that happens after a hard dump, it often shows that the selling pressure is running out.
According to my analysis of this chart, I'm expecting a push of around 24% upside from here, toward $0.0067 🎯
This is my analysis and not a trade setup, so there's no exact entry, TP or SL. If you take it yourself, keep the risk small and don't trade it with a liquidation price close to your entry 🙏
I'll update you when price reaches that area.
But look at what's happening now 👀 Price is getting buying momentum from a rejection wick zone. A rejection wick means sellers pushed price down there but buyers refused to give it up and pushed it back. When that happens after a hard dump, it often shows that the selling pressure is running out.
According to my analysis of this chart, I'm expecting a push of around 24% upside from here, toward $0.0067 🎯
This is my analysis and not a trade setup, so there's no exact entry, TP or SL. If you take it yourself, keep the risk small and don't trade it with a liquidation price close to your entry 🙏
I'll update you when price reaches that area.
12
1
5
2.9k
·
--
Some days the market just gives you everything at once 🔥
Today was one of those days. Every setup played out exactly the way we planned it.
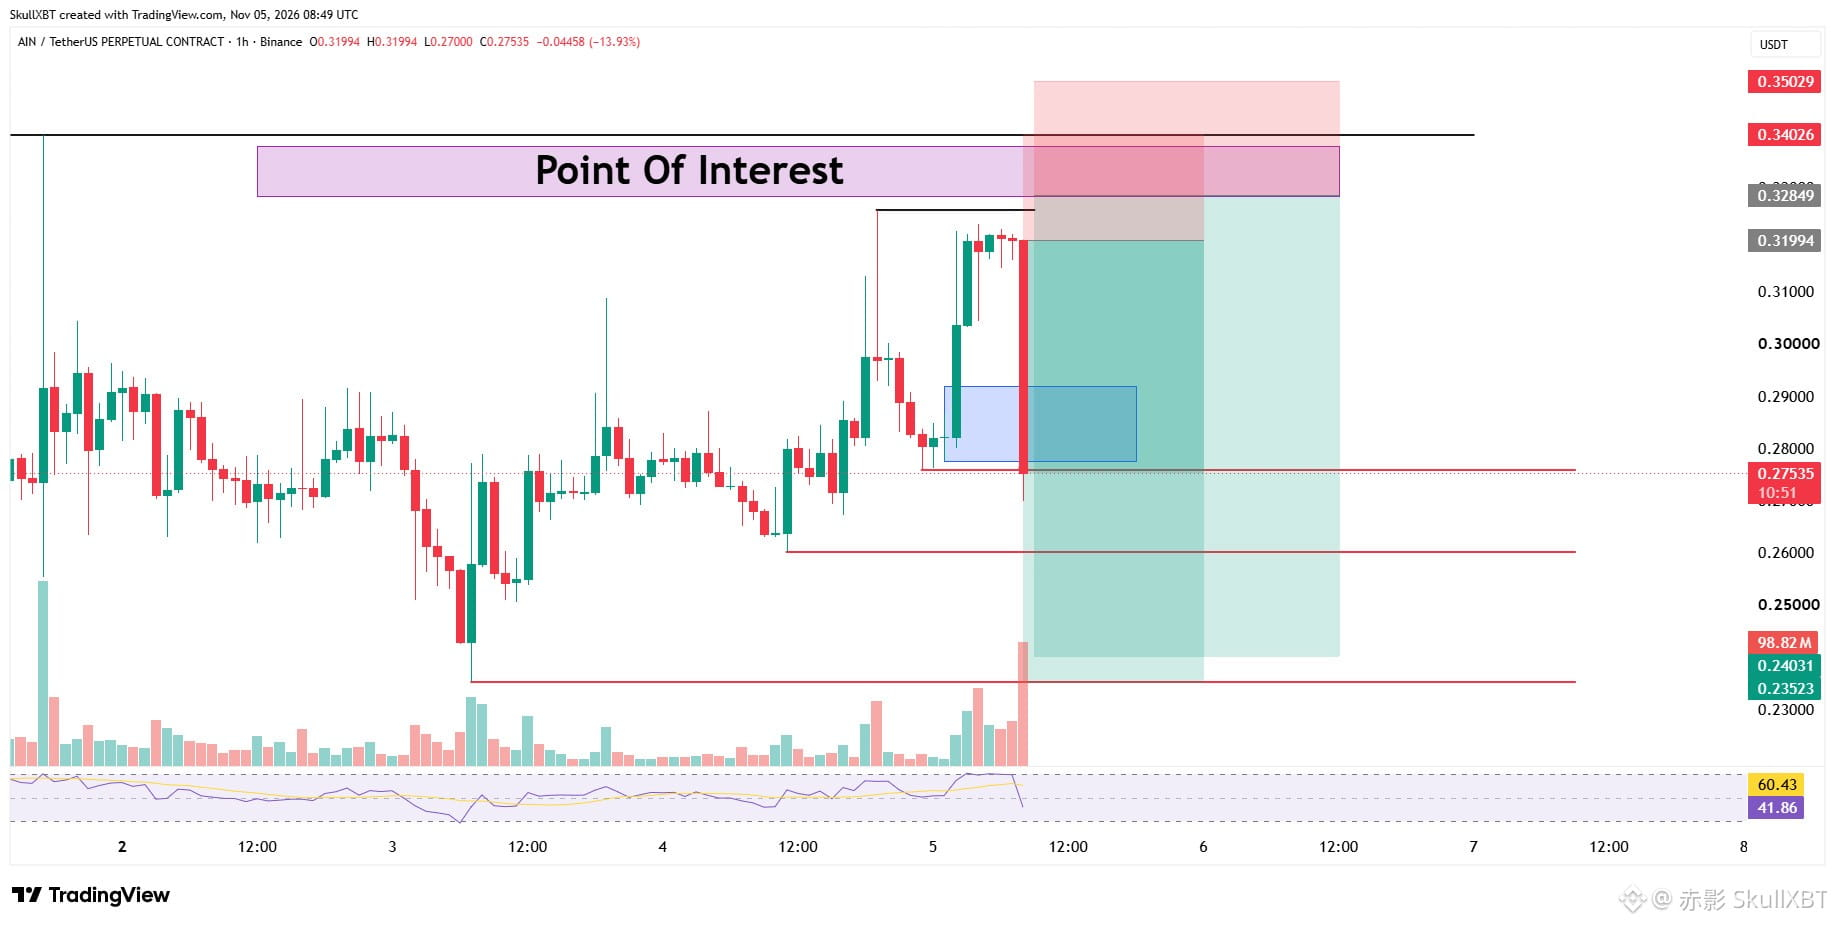
$AIN gave us the impulsive dump we were waiting for. One single candle came down and hit our first 2 targets without giving anyone time to breathe 😁
{future}(AINUSDT)
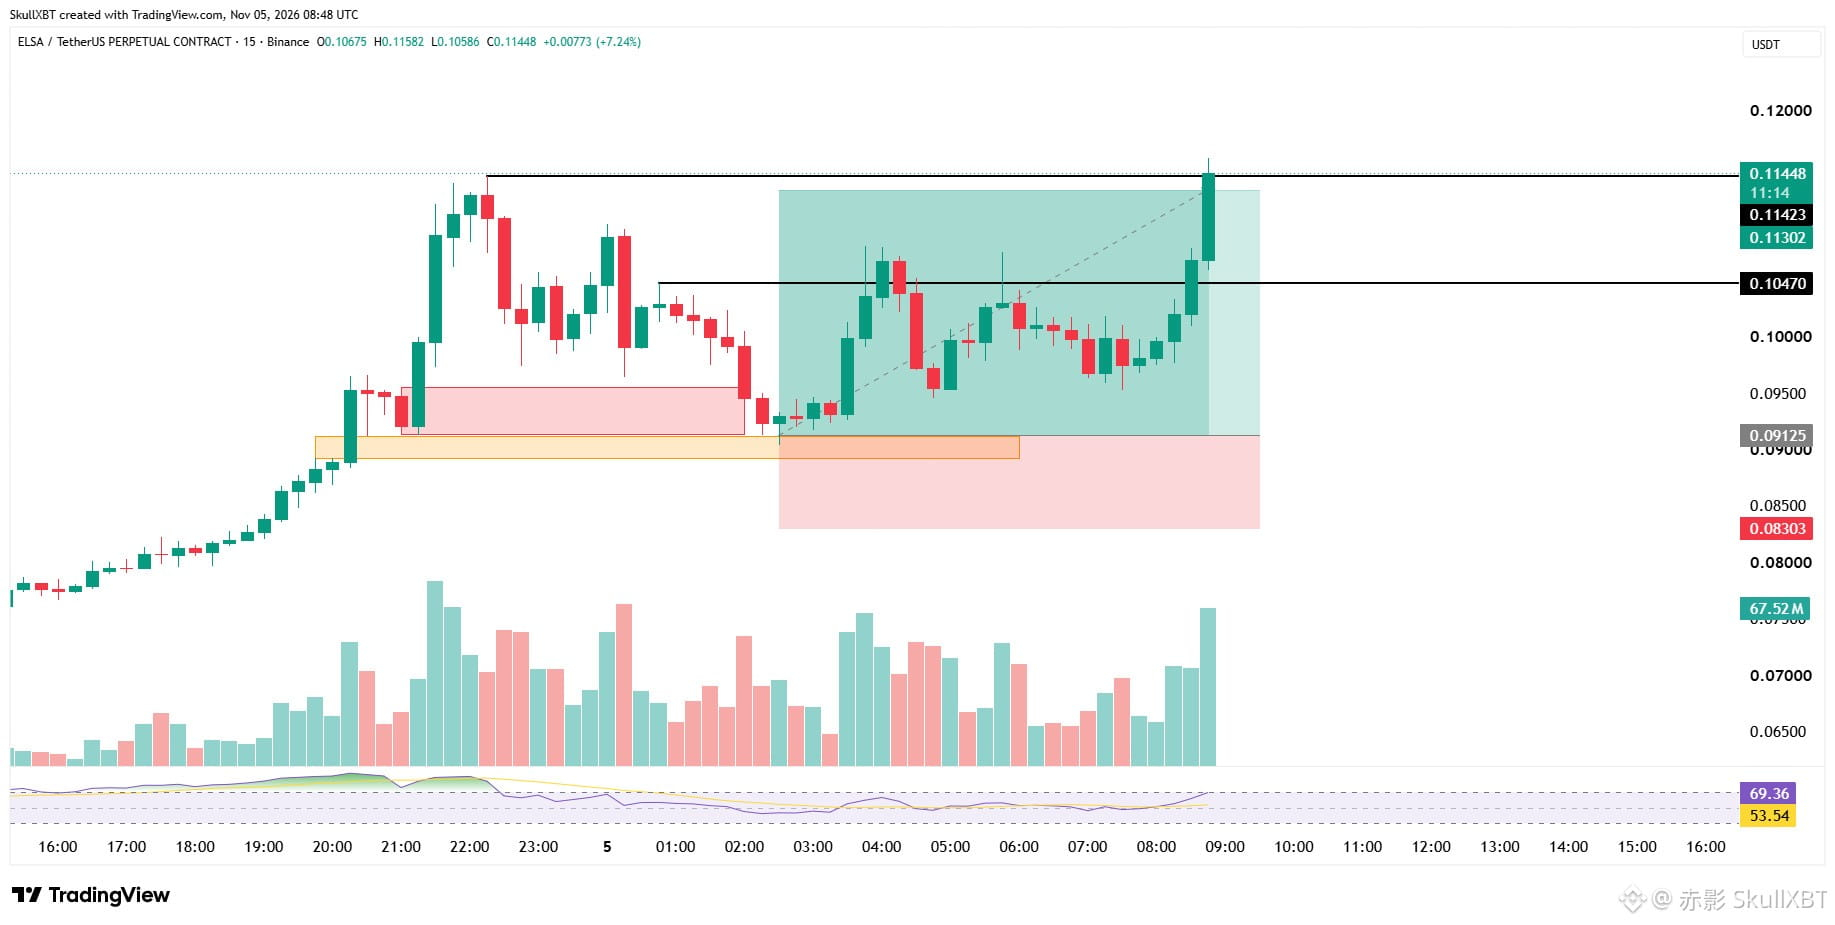
Then $ELSA started pumping and went through ALL of our targets one by one. Clean trade, clean execution 🎯
{future}(ELSAUSDT)
And the best part? This week had its losses, and that's part of trading, but today we recovered every one of them. We're now back in profit for the week, and the day isn't even over yet 👀
This is why I never rush after a loss or increase my risk to get it back fast. I stick to the setups, wait for the levels to be reached and let the market do the work.
Thank you to everyone who stayed with the trades 🙏 If you took AIN or ELSA with us, drop your results in the comments, I want to see how you did 💪
Some days the market just gives you everything at once 🔥
Today was one of those days. Every setup played out exactly the way we planned it.
$AIN gave us the impulsive dump we were waiting for. One single candle came down and hit our first 2 targets without giving anyone time to breathe 😁
Then $ELSA started pumping and went through ALL of our targets one by one. Clean trade, clean execution 🎯
And the best part? This week had its losses, and that's part of trading, but today we recovered every one of them. We're now back in profit for the week, and the day isn't even over yet 👀
This is why I never rush after a loss or increase my risk to get it back fast. I stick to the setups, wait for the levels to be reached and let the market do the work.
Thank you to everyone who stayed with the trades 🙏 If you took AIN or ELSA with us, drop your results in the comments, I want to see how you did 💪
Today was one of those days. Every setup played out exactly the way we planned it.
$AIN gave us the impulsive dump we were waiting for. One single candle came down and hit our first 2 targets without giving anyone time to breathe 😁
Then $ELSA started pumping and went through ALL of our targets one by one. Clean trade, clean execution 🎯
And the best part? This week had its losses, and that's part of trading, but today we recovered every one of them. We're now back in profit for the week, and the day isn't even over yet 👀
This is why I never rush after a loss or increase my risk to get it back fast. I stick to the setups, wait for the levels to be reached and let the market do the work.
Thank you to everyone who stayed with the trades 🙏 If you took AIN or ELSA with us, drop your results in the comments, I want to see how you did 💪
14
1
6
2.8k
·
--
Bearish
$Q has been very good to me before 😋 so I keep a close eye on it. This is NOT a trade setup, only my analysis 👇🏻
{future}(QUSDT)
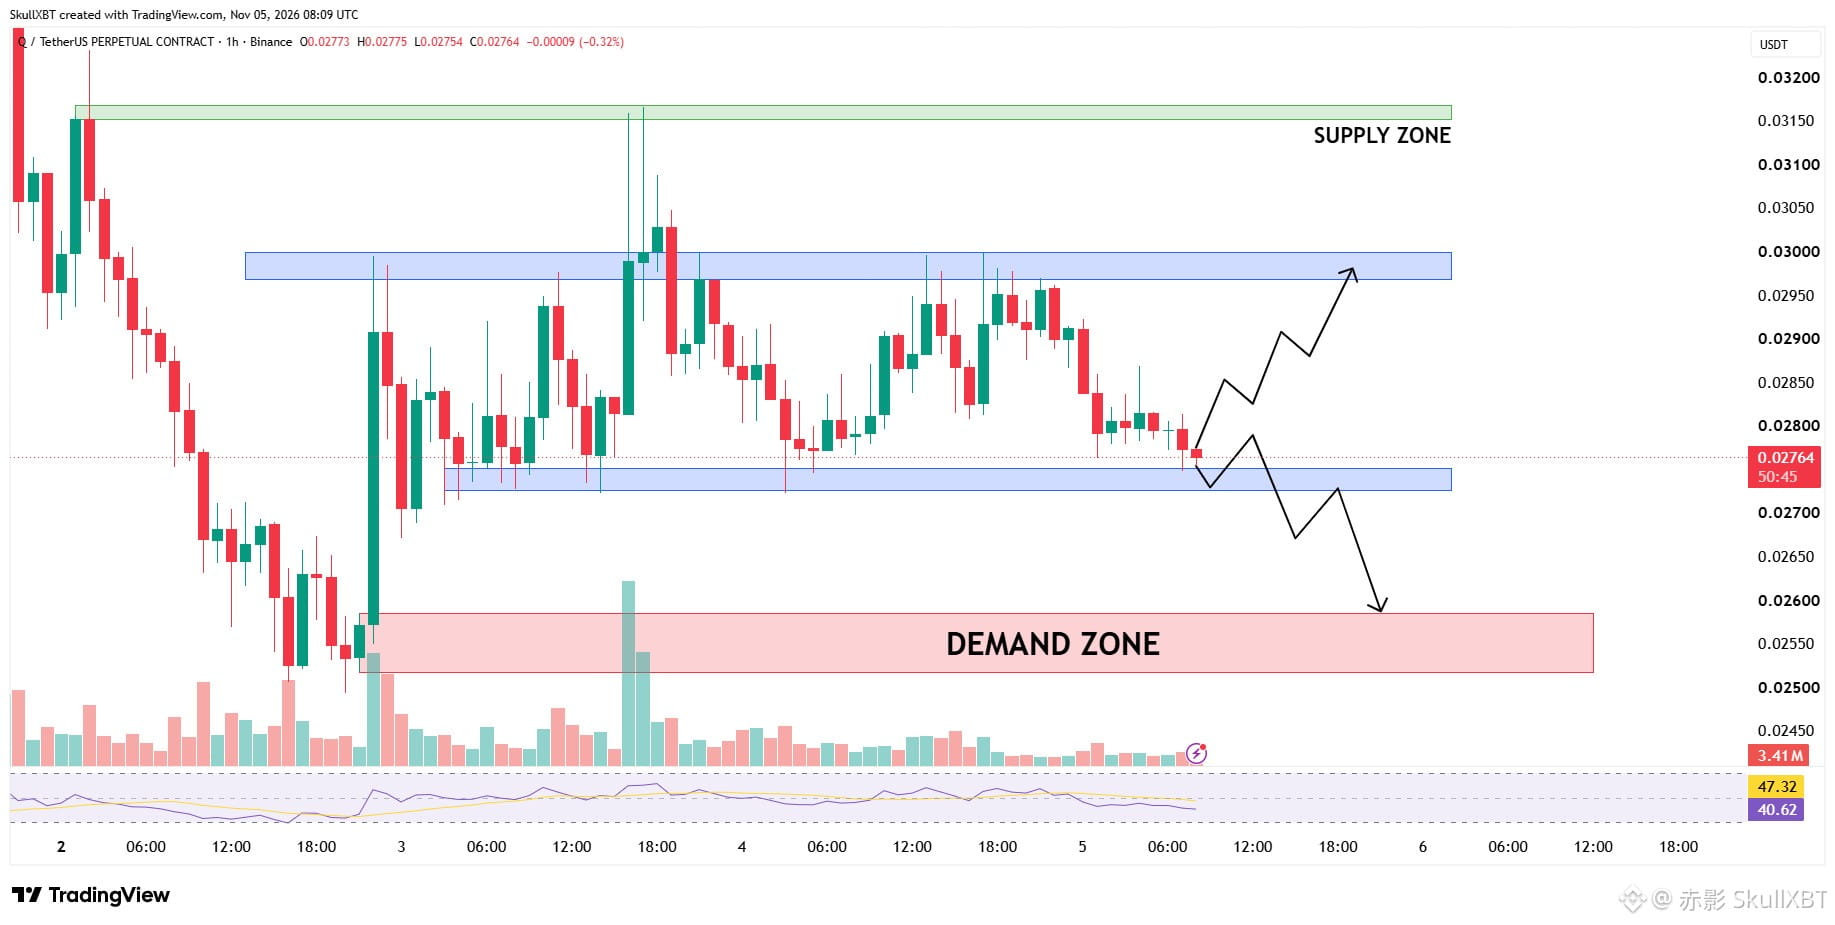
Right now price is sitting on a support zone, but look at how it reacts: it keeps getting rejected from the area and can't build strength. There's a chance support breaks and price pushes up from here, and I'm not hiding that. I don't have an exact view on the next candle, but I'm still leaning bearish.
The reason is the demand zone at $0.026 🎯 In my view it's the easier area for price to reach. A demand zone like that holds resting orders, and price likes to move toward them first. Only after that do I expect a real bounce.
If that happens, the bounce can push up toward the resistance zone at $0.030 and then the supply zone at $0.0315 above it. That's where sellers can show up again, so I'll be watching it closely.
The map for me looks like this:
Support now → demand zone $0.026 → bounce → resistance $0.030 → supply $0.0315
If price starts accepting above $0.030 instead, I'd drop the lower move completely. No entry, no TP, no SL here, just the zones I'm watching 👀
$Q has been very good to me before 😋 so I keep a close eye on it. This is NOT a trade setup, only my analysis 👇🏻
Right now price is sitting on a support zone, but look at how it reacts: it keeps getting rejected from the area and can't build strength. There's a chance support breaks and price pushes up from here, and I'm not hiding that. I don't have an exact view on the next candle, but I'm still leaning bearish.
The reason is the demand zone at $0.026 🎯 In my view it's the easier area for price to reach. A demand zone like that holds resting orders, and price likes to move toward them first. Only after that do I expect a real bounce.
If that happens, the bounce can push up toward the resistance zone at $0.030 and then the supply zone at $0.0315 above it. That's where sellers can show up again, so I'll be watching it closely.
The map for me looks like this:
Support now → demand zone $0.026 → bounce → resistance $0.030 → supply $0.0315
If price starts accepting above $0.030 instead, I'd drop the lower move completely. No entry, no TP, no SL here, just the zones I'm watching 👀
Right now price is sitting on a support zone, but look at how it reacts: it keeps getting rejected from the area and can't build strength. There's a chance support breaks and price pushes up from here, and I'm not hiding that. I don't have an exact view on the next candle, but I'm still leaning bearish.
The reason is the demand zone at $0.026 🎯 In my view it's the easier area for price to reach. A demand zone like that holds resting orders, and price likes to move toward them first. Only after that do I expect a real bounce.
If that happens, the bounce can push up toward the resistance zone at $0.030 and then the supply zone at $0.0315 above it. That's where sellers can show up again, so I'll be watching it closely.
The map for me looks like this:
Support now → demand zone $0.026 → bounce → resistance $0.030 → supply $0.0315
If price starts accepting above $0.030 instead, I'd drop the lower move completely. No entry, no TP, no SL here, just the zones I'm watching 👀
11
1
4
2.2k
·
--
Bearish
🎯 Most traders place their entry AFTER the move. I'm placing mine BEFORE it.
I'm putting a limit SHORT on $AIN 👇🏻
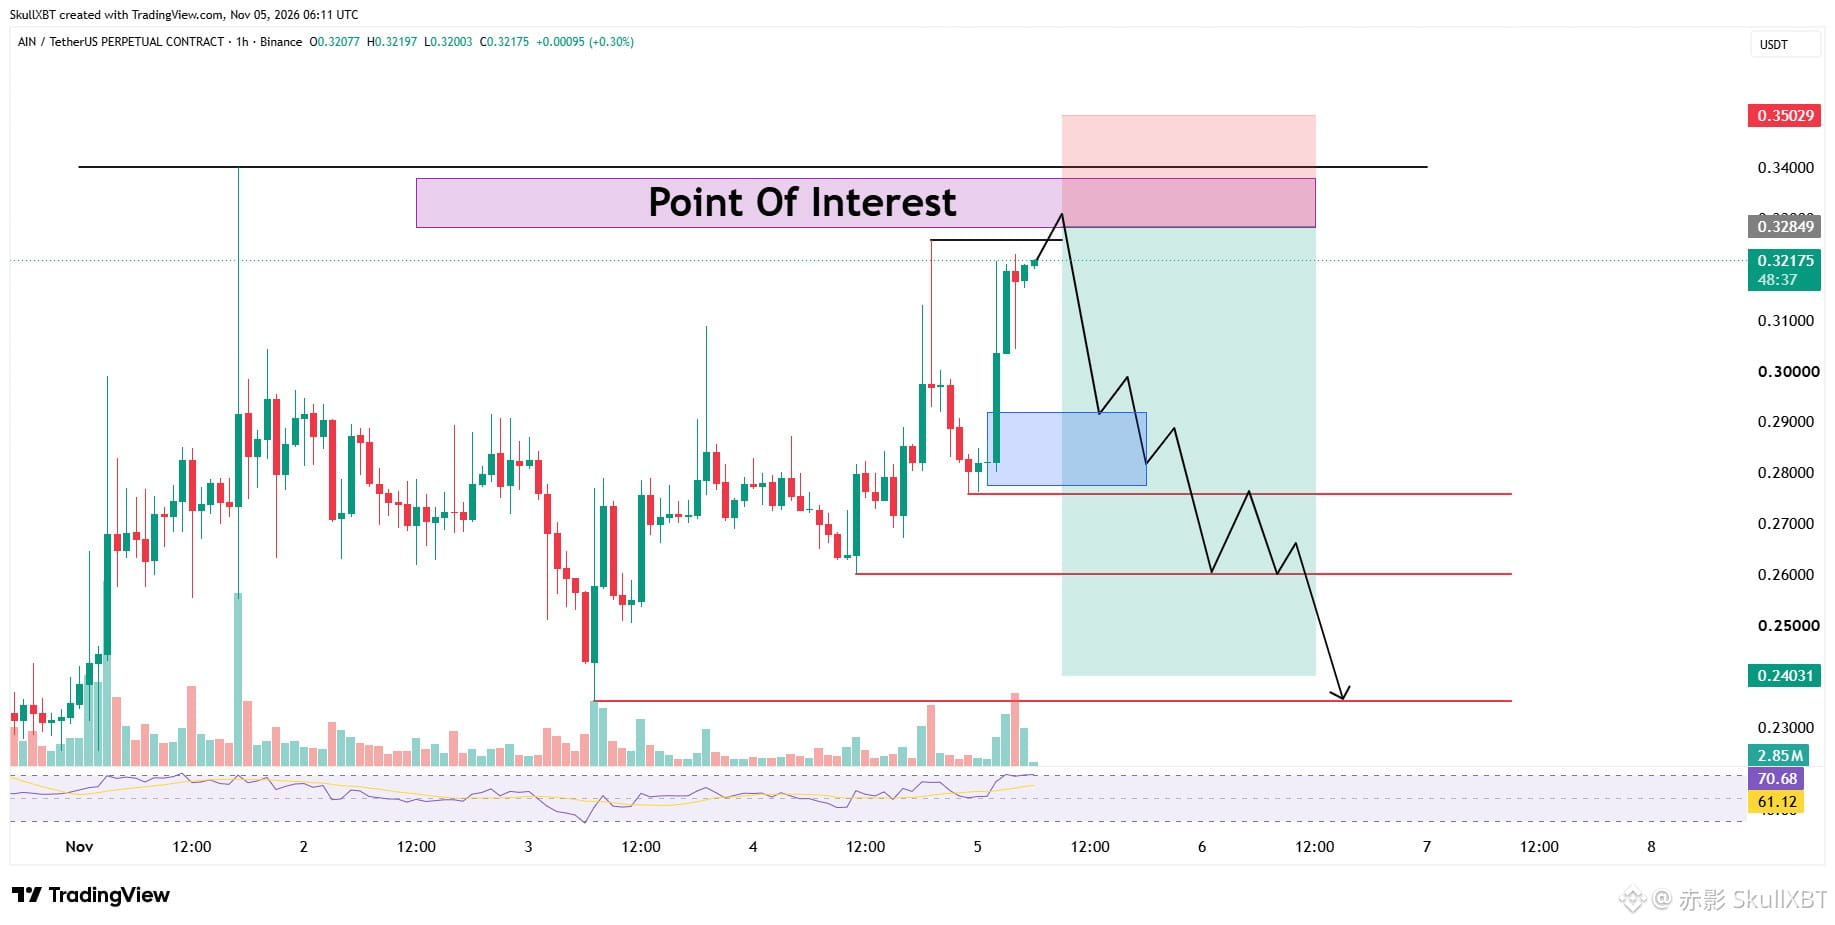
Entry: $0.328
TP: $0.290 – $0.270 – $0.240
SL: $0.350
{future}(AINUSDT)
Here's the setup, and a small lesson inside it 📚
Price is very close to sweeping its highest point. Right before that high there's a small resistance, and together they form a strong point of interest, a zone where sellers are ready to step in and push price down.
Why does this matter? Above the highs, stop orders and breakout buyers are sitting there. That's liquidity. Once price takes it, there's nothing left above to attract the market, and price always moves toward liquidity. The next closest pool is below, so the downside becomes the easy direction.
Now the interesting part 👀 I don't need to wait for a confirmation candle. Sometimes price shows stronger volume before it even reaches my entry, and that's the activation point. That's why I'm using a limit order: I'm already waiting there when it comes.
If price never touches $0.328 I'm not in the trade. If it fills and holds above $0.350 the idea is wrong and I'm out ✅
🎯 Most traders place their entry AFTER the move. I'm placing mine BEFORE it.
I'm putting a limit SHORT on $AIN 👇🏻
Entry: $0.328
TP: $0.290 – $0.270 – $0.240
SL: $0.350
Here's the setup, and a small lesson inside it 📚
Price is very close to sweeping its highest point. Right before that high there's a small resistance, and together they form a strong point of interest, a zone where sellers are ready to step in and push price down.
Why does this matter? Above the highs, stop orders and breakout buyers are sitting there. That's liquidity. Once price takes it, there's nothing left above to attract the market, and price always moves toward liquidity. The next closest pool is below, so the downside becomes the easy direction.
Now the interesting part 👀 I don't need to wait for a confirmation candle. Sometimes price shows stronger volume before it even reaches my entry, and that's the activation point. That's why I'm using a limit order: I'm already waiting there when it comes.
If price never touches $0.328 I'm not in the trade. If it fills and holds above $0.350 the idea is wrong and I'm out ✅
I'm putting a limit SHORT on $AIN 👇🏻
Entry: $0.328
TP: $0.290 – $0.270 – $0.240
SL: $0.350
Here's the setup, and a small lesson inside it 📚
Price is very close to sweeping its highest point. Right before that high there's a small resistance, and together they form a strong point of interest, a zone where sellers are ready to step in and push price down.
Why does this matter? Above the highs, stop orders and breakout buyers are sitting there. That's liquidity. Once price takes it, there's nothing left above to attract the market, and price always moves toward liquidity. The next closest pool is below, so the downside becomes the easy direction.
Now the interesting part 👀 I don't need to wait for a confirmation candle. Sometimes price shows stronger volume before it even reaches my entry, and that's the activation point. That's why I'm using a limit order: I'm already waiting there when it comes.
If price never touches $0.328 I'm not in the trade. If it fills and holds above $0.350 the idea is wrong and I'm out ✅
15
1
7
3.6k
·
--
Bearish
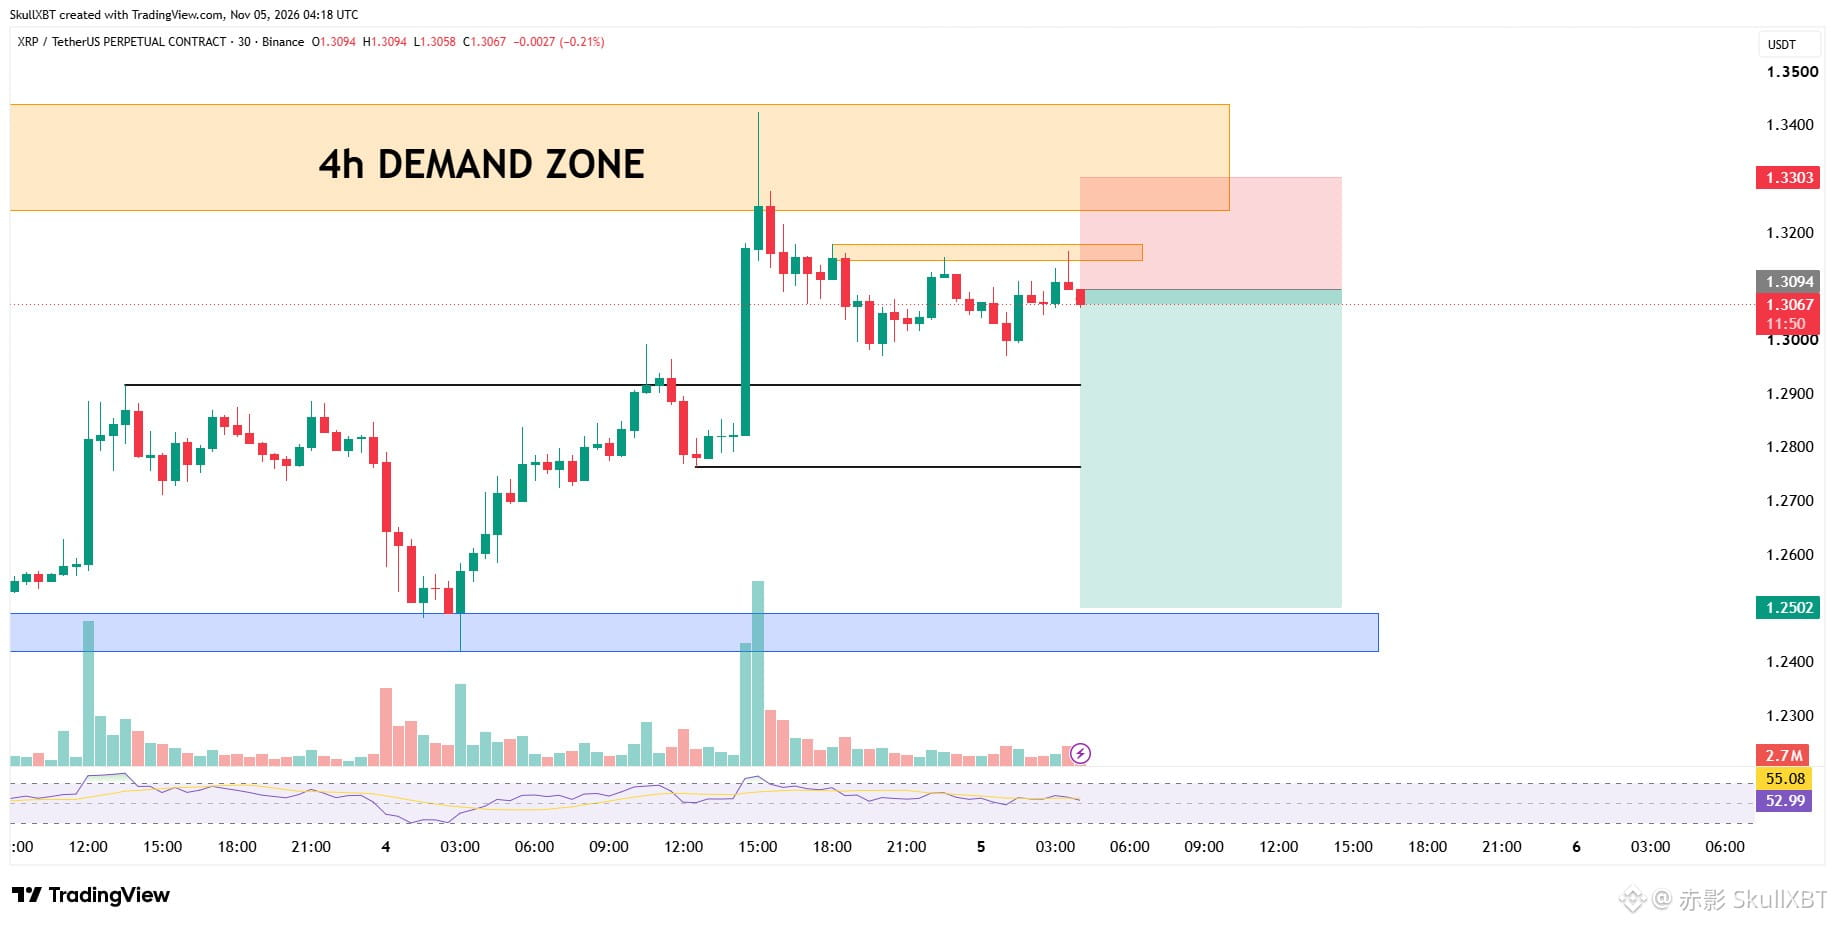
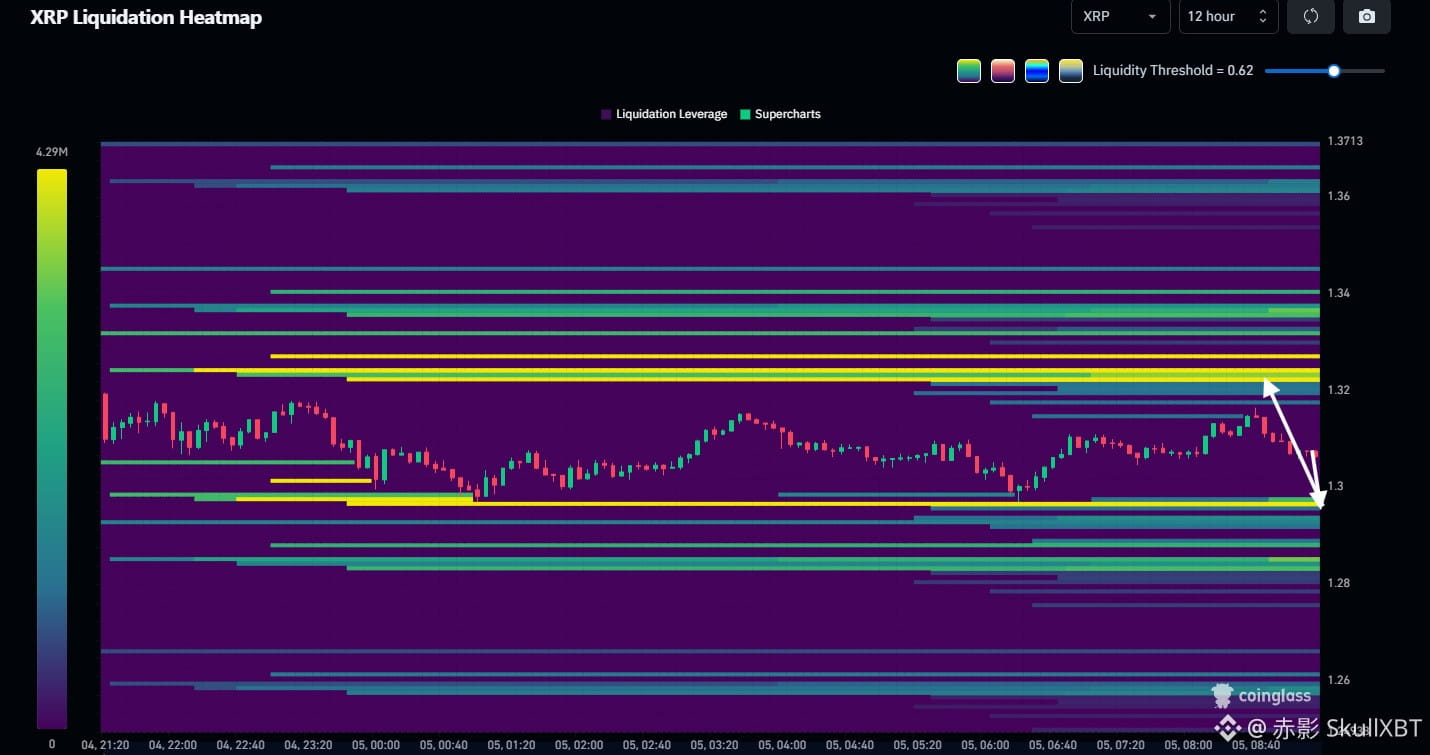
$XRP is sitting inside a higher-timeframe demand zone, and that's the main reason I'm not turning bearish for the bigger picture. 👀
But look at the liquidity heatmap. There's strong liquidity sitting above price, and some below it as well. In my view, price will first go after the smaller pocket below and sweep those positions. After that, I'm expecting the stronger bullish momentum toward the upside liquidity.
So I'm not fighting the big trend here. I'm only trying to catch the downside move first.
I'm opening a SHORT on $XRP here.
TP: $1.27–$1.25
SL: $1.33 👇🏻
{future}(XRPUSDT)
The $1.32 resistance is giving me a clean level to trade against, with a stop just above it. If price accepts above $1.33, the idea is invalid and I'm out.
This is a short-term trade into liquidity, not a bearish call on XRP.
$XRP is sitting inside a higher-timeframe demand zone, and that's the main reason I'm not turning bearish for the bigger picture. 👀
But look at the liquidity heatmap. There's strong liquidity sitting above price, and some below it as well. In my view, price will first go after the smaller pocket below and sweep those positions. After that, I'm expecting the stronger bullish momentum toward the upside liquidity.
So I'm not fighting the big trend here. I'm only trying to catch the downside move first.
I'm opening a SHORT on $XRP here.
TP: $1.27–$1.25
SL: $1.33 👇🏻
The $1.32 resistance is giving me a clean level to trade against, with a stop just above it. If price accepts above $1.33, the idea is invalid and I'm out.
This is a short-term trade into liquidity, not a bearish call on XRP.
But look at the liquidity heatmap. There's strong liquidity sitting above price, and some below it as well. In my view, price will first go after the smaller pocket below and sweep those positions. After that, I'm expecting the stronger bullish momentum toward the upside liquidity.
So I'm not fighting the big trend here. I'm only trying to catch the downside move first.
I'm opening a SHORT on $XRP here.
TP: $1.27–$1.25
SL: $1.33 👇🏻
The $1.32 resistance is giving me a clean level to trade against, with a stop just above it. If price accepts above $1.33, the idea is invalid and I'm out.
This is a short-term trade into liquidity, not a bearish call on XRP.
21
2
8
3.7k
·
--
Bullish
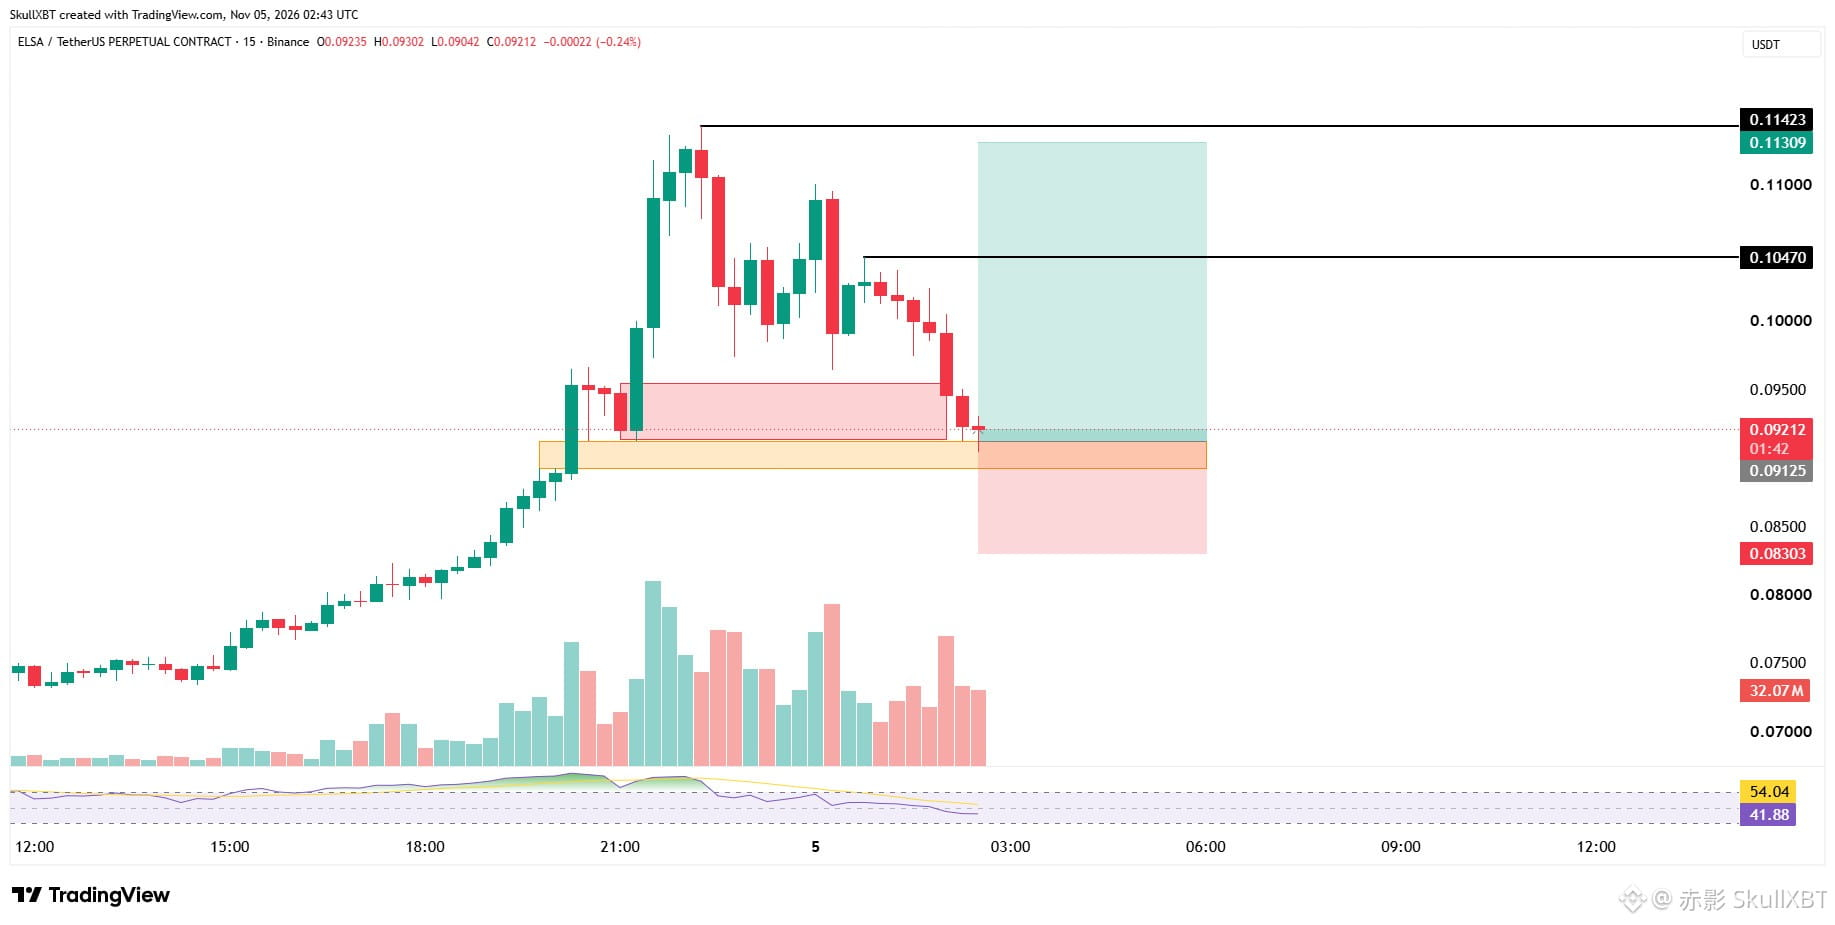
$ELSA just stepped back a little, and honestly this is the part I was waiting for 👀
I'm opening a LONG on $ELSA right now.
TP: $0.104 / $0.113
Invalidation: $0.083 👇🏻
{future}(ELSAUSDT)
$ELSA is in a strong bullish momentum, and the price has been pushing up with real power. Now it came down a little bit into the demand zone, right where the imbalance is sitting. In a trend like this, that kind of pullback is normal, and it gives buyers a fresh place to step in.
Because the trend is still continuing, I expect one more bullish move from here, and it can reach the recent high. The market already showed us who is in control, and now it is just giving us a better price to join 💯
I'm with the buyers on this one.
$ELSA just stepped back a little, and honestly this is the part I was waiting for 👀
I'm opening a LONG on $ELSA right now.
TP: $0.104 / $0.113
Invalidation: $0.083 👇🏻
$ELSA is in a strong bullish momentum, and the price has been pushing up with real power. Now it came down a little bit into the demand zone, right where the imbalance is sitting. In a trend like this, that kind of pullback is normal, and it gives buyers a fresh place to step in.
Because the trend is still continuing, I expect one more bullish move from here, and it can reach the recent high. The market already showed us who is in control, and now it is just giving us a better price to join 💯
I'm with the buyers on this one.
I'm opening a LONG on $ELSA right now.
TP: $0.104 / $0.113
Invalidation: $0.083 👇🏻
$ELSA is in a strong bullish momentum, and the price has been pushing up with real power. Now it came down a little bit into the demand zone, right where the imbalance is sitting. In a trend like this, that kind of pullback is normal, and it gives buyers a fresh place to step in.
Because the trend is still continuing, I expect one more bullish move from here, and it can reach the recent high. The market already showed us who is in control, and now it is just giving us a better price to join 💯
I'm with the buyers on this one.
13
9
2.4k
·
--
Bullish
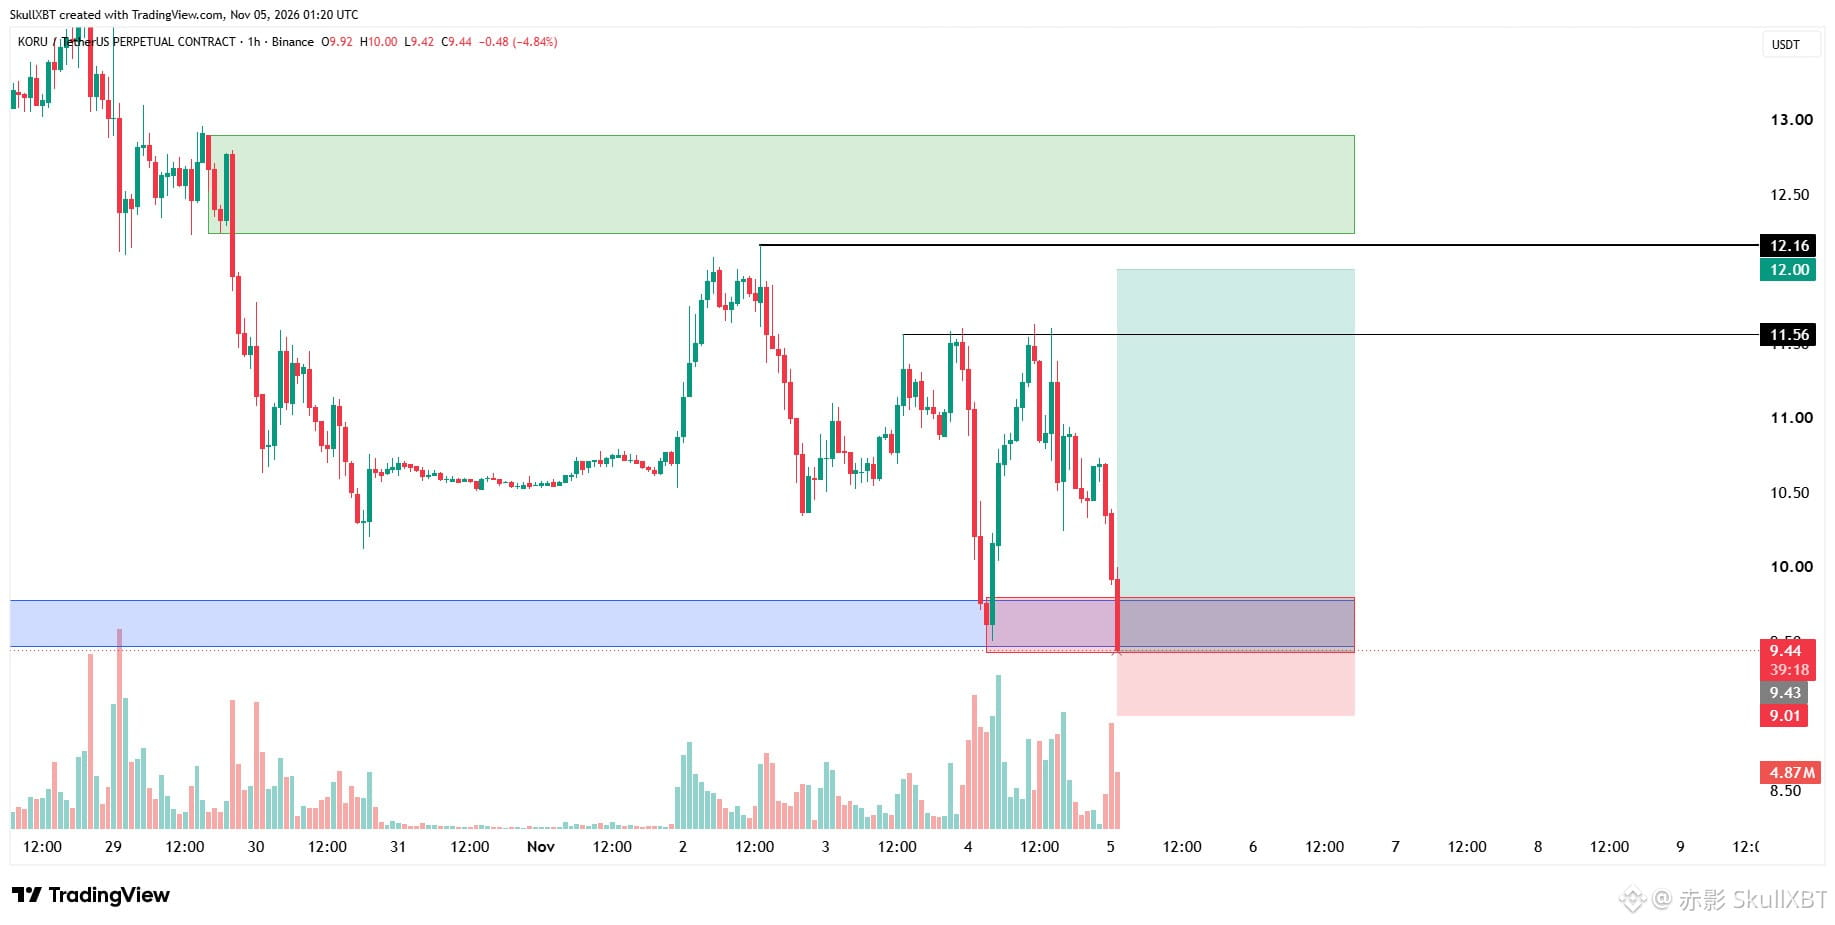
Guys, look at where $KORU is sitting right now, because this is one of those spots I really don't want to ignore 🔥
I'm opening a BIG LONG on $KORU here.
TP: $11 - $12
Invalidation: $9
{future}(KORUUSDT)
Price is on a daily support, and at the same time it is inside an HTF demand zone. When two levels like that sit on the same spot, I start paying attention, because that is usually where reversals begin.
You can already see price pushing into this zone, and I think the reversal can happen at any point from here. If it does, I expect a big pump upside, and price can travel toward the supply zone at $12.3 ❗️
There is also some liquidity left on the way up that still needs to get swept. So I'm not expecting a smooth straight line, but I do like where the structure is heading 💯
Guys, look at where $KORU is sitting right now, because this is one of those spots I really don't want to ignore 🔥
I'm opening a BIG LONG on $KORU here.
TP: $11 - $12
Invalidation: $9
Price is on a daily support, and at the same time it is inside an HTF demand zone. When two levels like that sit on the same spot, I start paying attention, because that is usually where reversals begin.
You can already see price pushing into this zone, and I think the reversal can happen at any point from here. If it does, I expect a big pump upside, and price can travel toward the supply zone at $12.3 ❗️
There is also some liquidity left on the way up that still needs to get swept. So I'm not expecting a smooth straight line, but I do like where the structure is heading 💯
I'm opening a BIG LONG on $KORU here.
TP: $11 - $12
Invalidation: $9
Price is on a daily support, and at the same time it is inside an HTF demand zone. When two levels like that sit on the same spot, I start paying attention, because that is usually where reversals begin.
You can already see price pushing into this zone, and I think the reversal can happen at any point from here. If it does, I expect a big pump upside, and price can travel toward the supply zone at $12.3 ❗️
There is also some liquidity left on the way up that still needs to get swept. So I'm not expecting a smooth straight line, but I do like where the structure is heading 💯
22
1
5
3.2k
·
--
Guys, I'm going to be real with you today, because you've all been with me through the good days and the bad ones 🤍
I've had a bad headache since morning, and the pain is making it really hard to sit in front of the charts. Honestly, that's the reason some of my trades haven't been going well lately. When your health isn't right, your mind isn't right either, and trading shows that very quickly.
So today I'm not going to push myself. I'm going to rest properly, and I hope you understand that. You mean a lot to me, and I would rather come back healthy than give you rushed calls while I'm in pain.
Follow me so you don't miss anything next time, because I'll be back with clean setups ❤️
And before I go, one thing I want you to know. I'm going to buy $BTC and $ETH in spot on the HTF 💯
Take care of yourselves too, guys. Health comes first, always.
Guys, I'm going to be real with you today, because you've all been with me through the good days and the bad ones 🤍
I've had a bad headache since morning, and the pain is making it really hard to sit in front of the charts. Honestly, that's the reason some of my trades haven't been going well lately. When your health isn't right, your mind isn't right either, and trading shows that very quickly.
So today I'm not going to push myself. I'm going to rest properly, and I hope you understand that. You mean a lot to me, and I would rather come back healthy than give you rushed calls while I'm in pain.
Follow me so you don't miss anything next time, because I'll be back with clean setups ❤️
And before I go, one thing I want you to know. I'm going to buy $BTC and $ETH in spot on the HTF 💯
Take care of yourselves too, guys. Health comes first, always.
I've had a bad headache since morning, and the pain is making it really hard to sit in front of the charts. Honestly, that's the reason some of my trades haven't been going well lately. When your health isn't right, your mind isn't right either, and trading shows that very quickly.
So today I'm not going to push myself. I'm going to rest properly, and I hope you understand that. You mean a lot to me, and I would rather come back healthy than give you rushed calls while I'm in pain.
Follow me so you don't miss anything next time, because I'll be back with clean setups ❤️
And before I go, one thing I want you to know. I'm going to buy $BTC and $ETH in spot on the HTF 💯
Take care of yourselves too, guys. Health comes first, always.

12
10
2.6k
·
--
Bearish
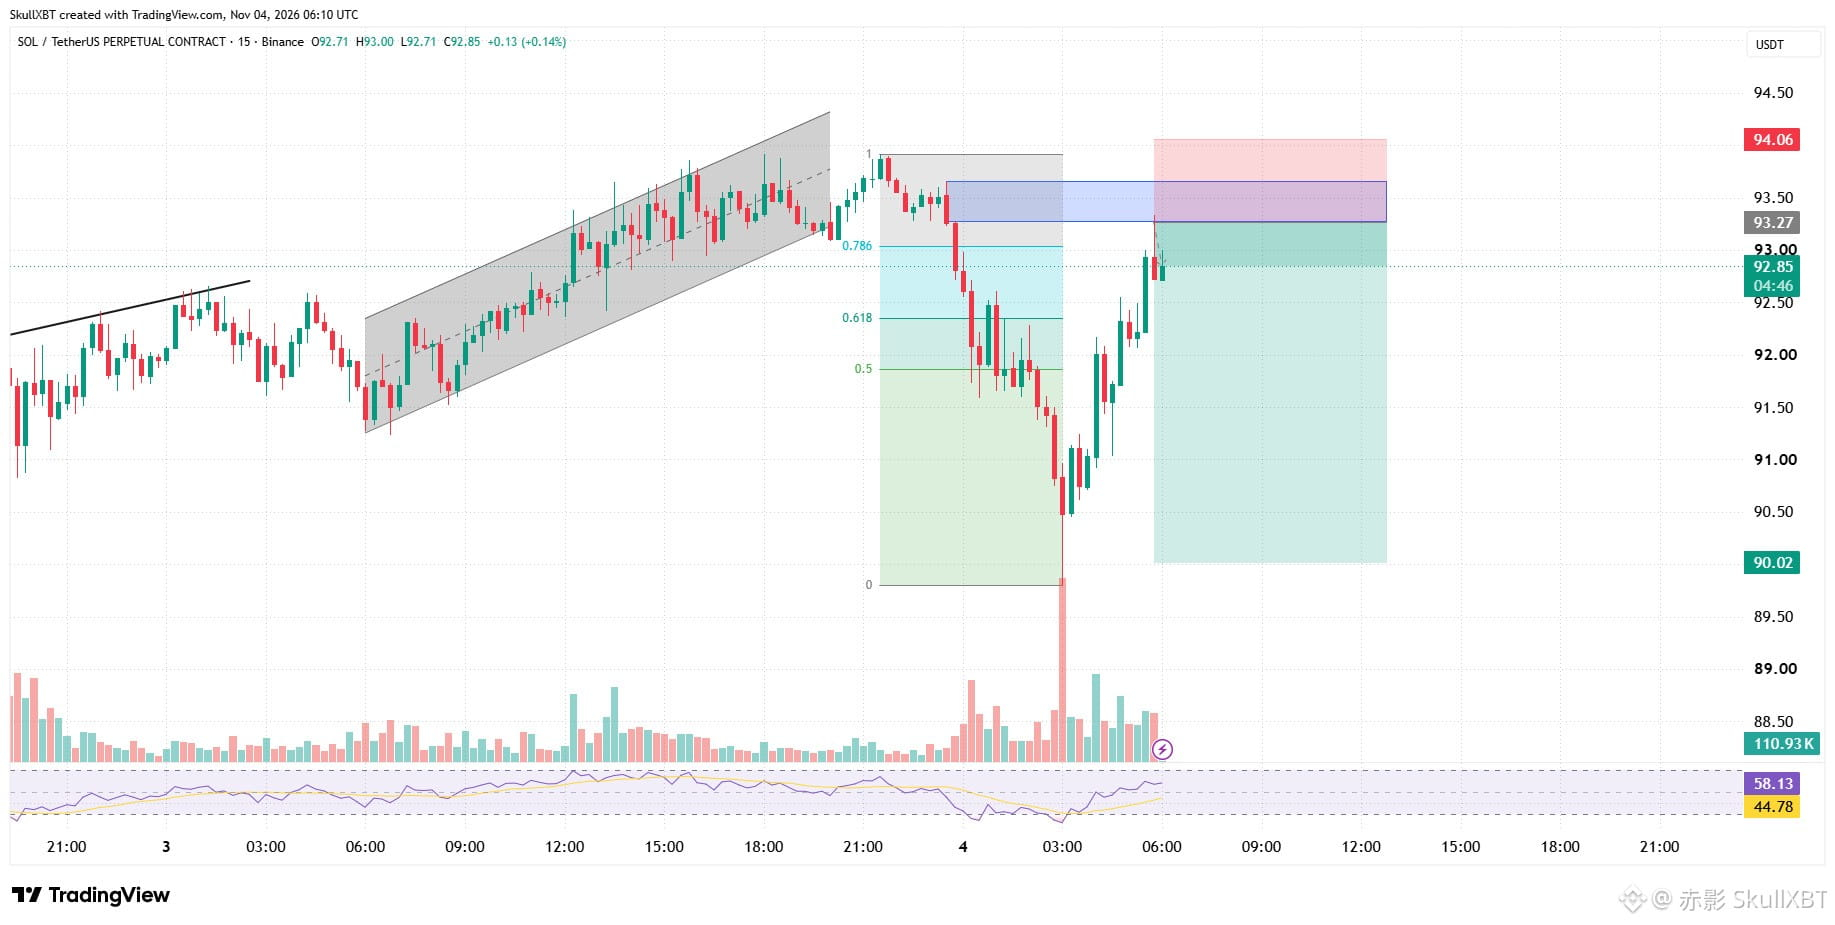
Let me tell you why I'm bearish on $SOL here, because this setup has a few layers that most people don't look at 🚨
I'm opening a BIG SHORT on $SOL right now.
TP: 91
Invalidation: 94
{future}(SOLUSDT)
First, price is getting rejected from a supply zone. That alone makes me careful about any buying from here.
Then I put the Fibonacci tool on the chart, and price is sitting inside the premium zone. That means it is trading in the expensive part of the range, and that is exactly where I want to be looking for sells, not buys.
Now the part I like the most. Inside this area there is a clean zone with higher volume, and that tells me price can push downside harder from here ‼️
So it is not one reason, it is three things lining up on the same spot: the supply zone, the premium zone and the volume.
When that happens I stop overthinking it and trade the move 💯
I'm confident in this one, and I'm staying with the sellers 🔥
Let me tell you why I'm bearish on $SOL here, because this setup has a few layers that most people don't look at 🚨
I'm opening a BIG SHORT on $SOL right now.
TP: 91
Invalidation: 94
First, price is getting rejected from a supply zone. That alone makes me careful about any buying from here.
Then I put the Fibonacci tool on the chart, and price is sitting inside the premium zone. That means it is trading in the expensive part of the range, and that is exactly where I want to be looking for sells, not buys.
Now the part I like the most. Inside this area there is a clean zone with higher volume, and that tells me price can push downside harder from here ‼️
So it is not one reason, it is three things lining up on the same spot: the supply zone, the premium zone and the volume.
When that happens I stop overthinking it and trade the move 💯
I'm confident in this one, and I'm staying with the sellers 🔥
I'm opening a BIG SHORT on $SOL right now.
TP: 91
Invalidation: 94
First, price is getting rejected from a supply zone. That alone makes me careful about any buying from here.
Then I put the Fibonacci tool on the chart, and price is sitting inside the premium zone. That means it is trading in the expensive part of the range, and that is exactly where I want to be looking for sells, not buys.
Now the part I like the most. Inside this area there is a clean zone with higher volume, and that tells me price can push downside harder from here ‼️
So it is not one reason, it is three things lining up on the same spot: the supply zone, the premium zone and the volume.
When that happens I stop overthinking it and trade the move 💯
I'm confident in this one, and I'm staying with the sellers 🔥
14
4
3.7k
·
--
Bearish
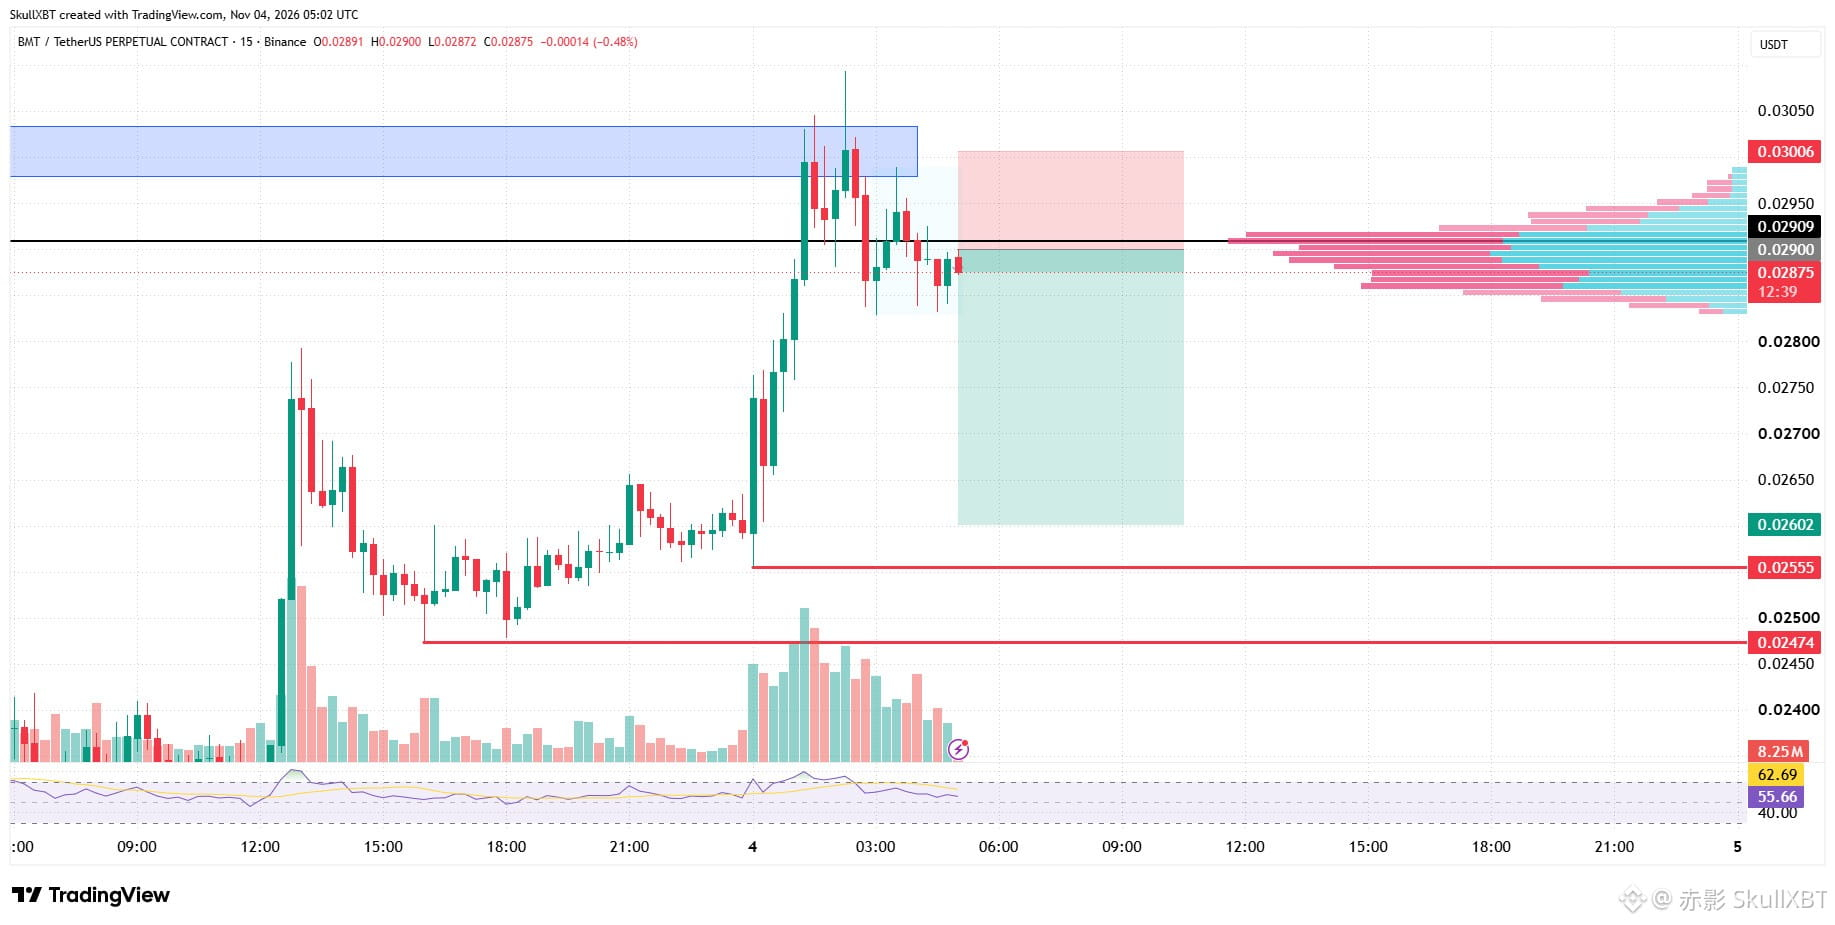
Sellers on $BMT are starting to take over, and the chart is showing it clearly 🚨
I'm opening a BIG SHORT on $BMT here.
TP: 0.027-0.026
Invalidation: 0.030
{future}(BMTUSDT)
First thing I checked was the volume profile, and it shows a volume resistance right where price is sitting.
Price is also getting rejected from a supply zone, so two different tools are pointing at the same area.
That's why I think sellers can diverge from here and push price downside.
And look below, because there is strong liquidity sitting down there waiting to get taken ‼️
When resistance holds and the liquidity is below, I would rather follow the move toward it than fight it 👀
Sellers on $BMT are starting to take over, and the chart is showing it clearly 🚨
I'm opening a BIG SHORT on $BMT here.
TP: 0.027-0.026
Invalidation: 0.030
First thing I checked was the volume profile, and it shows a volume resistance right where price is sitting.
Price is also getting rejected from a supply zone, so two different tools are pointing at the same area.
That's why I think sellers can diverge from here and push price downside.
And look below, because there is strong liquidity sitting down there waiting to get taken ‼️
When resistance holds and the liquidity is below, I would rather follow the move toward it than fight it 👀
I'm opening a BIG SHORT on $BMT here.
TP: 0.027-0.026
Invalidation: 0.030
First thing I checked was the volume profile, and it shows a volume resistance right where price is sitting.
Price is also getting rejected from a supply zone, so two different tools are pointing at the same area.
That's why I think sellers can diverge from here and push price downside.
And look below, because there is strong liquidity sitting down there waiting to get taken ‼️
When resistance holds and the liquidity is below, I would rather follow the move toward it than fight it 👀
14
1
5
2.9k
·
--
Bullish
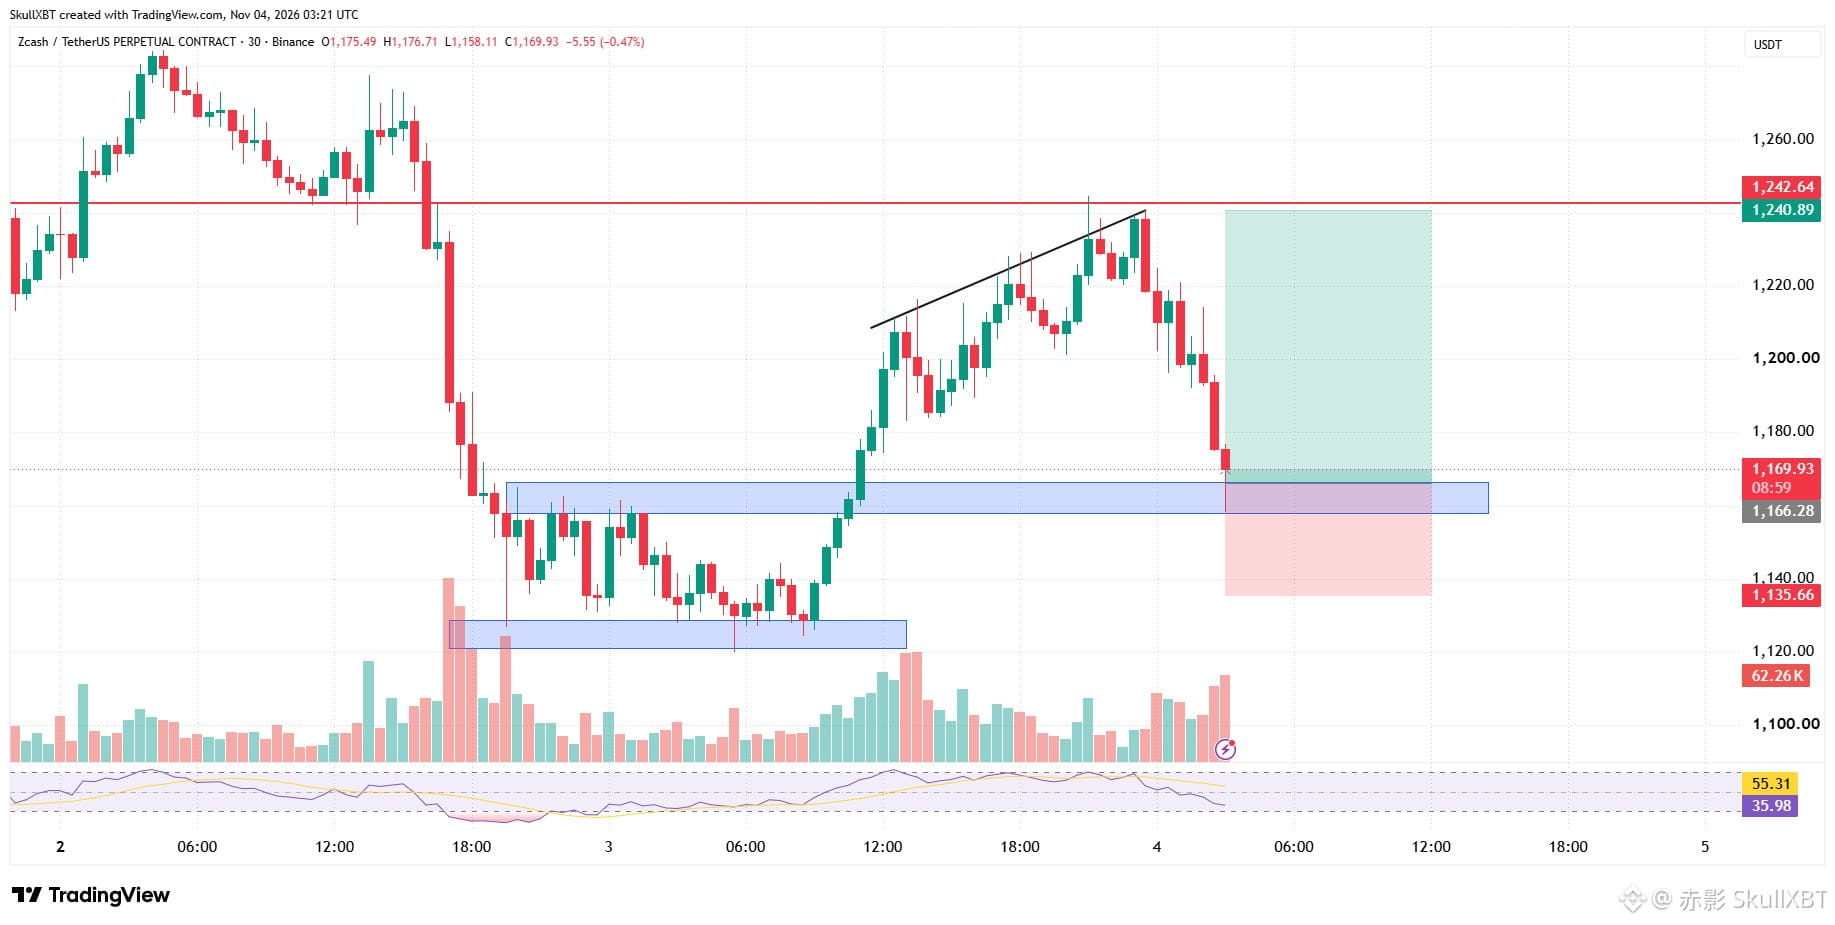
$ZEC buyers are sitting on support and the HTF FVG at the same time 🔥
I'm opening a BIG LONG on $ZEC here.
TP: 1,210-1,240
Invalidation: 1,135
{future}(ZECUSDT)
Now I know volume is still showing some bearish strength, and that's the part making people nervous.
But the higher timeframe is still bullish, and that matters more to me than one volume reading.
RSI is above 55 and crossing, and the reversal on the lower timeframe is already showing clearly.
So if price keeps holding above this zone, I think we get a liquidity sweep from the upside ❗️
I'm not calling a big trend change here, I'm just trading the bounce from a zone where buyers are already sitting 💯
$ZEC buyers are sitting on support and the HTF FVG at the same time 🔥
I'm opening a BIG LONG on $ZEC here.
TP: 1,210-1,240
Invalidation: 1,135
Now I know volume is still showing some bearish strength, and that's the part making people nervous.
But the higher timeframe is still bullish, and that matters more to me than one volume reading.
RSI is above 55 and crossing, and the reversal on the lower timeframe is already showing clearly.
So if price keeps holding above this zone, I think we get a liquidity sweep from the upside ❗️
I'm not calling a big trend change here, I'm just trading the bounce from a zone where buyers are already sitting 💯
I'm opening a BIG LONG on $ZEC here.
TP: 1,210-1,240
Invalidation: 1,135
Now I know volume is still showing some bearish strength, and that's the part making people nervous.
But the higher timeframe is still bullish, and that matters more to me than one volume reading.
RSI is above 55 and crossing, and the reversal on the lower timeframe is already showing clearly.
So if price keeps holding above this zone, I think we get a liquidity sweep from the upside ❗️
I'm not calling a big trend change here, I'm just trading the bounce from a zone where buyers are already sitting 💯
21
1
11
7.8k
Log in to explore more content
Join global crypto users on Binance Square
⚡️ Get latest and useful information about crypto.
💬 Trusted by the world’s largest crypto exchange.
👍 Discover real insights from verified creators.
Email / Phone number
Trending Topics
JobsReportRaisesHikeOdds
208,764 views
1,722 Discussing
TradFi News | US Adds 165,000 Jobs in October, More Than Double the 65,000 Forecast, as Unemployment Falls to 4.1%
Binance News
·30 Likes
·20.8k views
CPITestsDecemberRateOutlook
7,911 views
129 Discussing
BitcoinRebounds$75KAsChipsLead
18,624 views
200 Discussing