
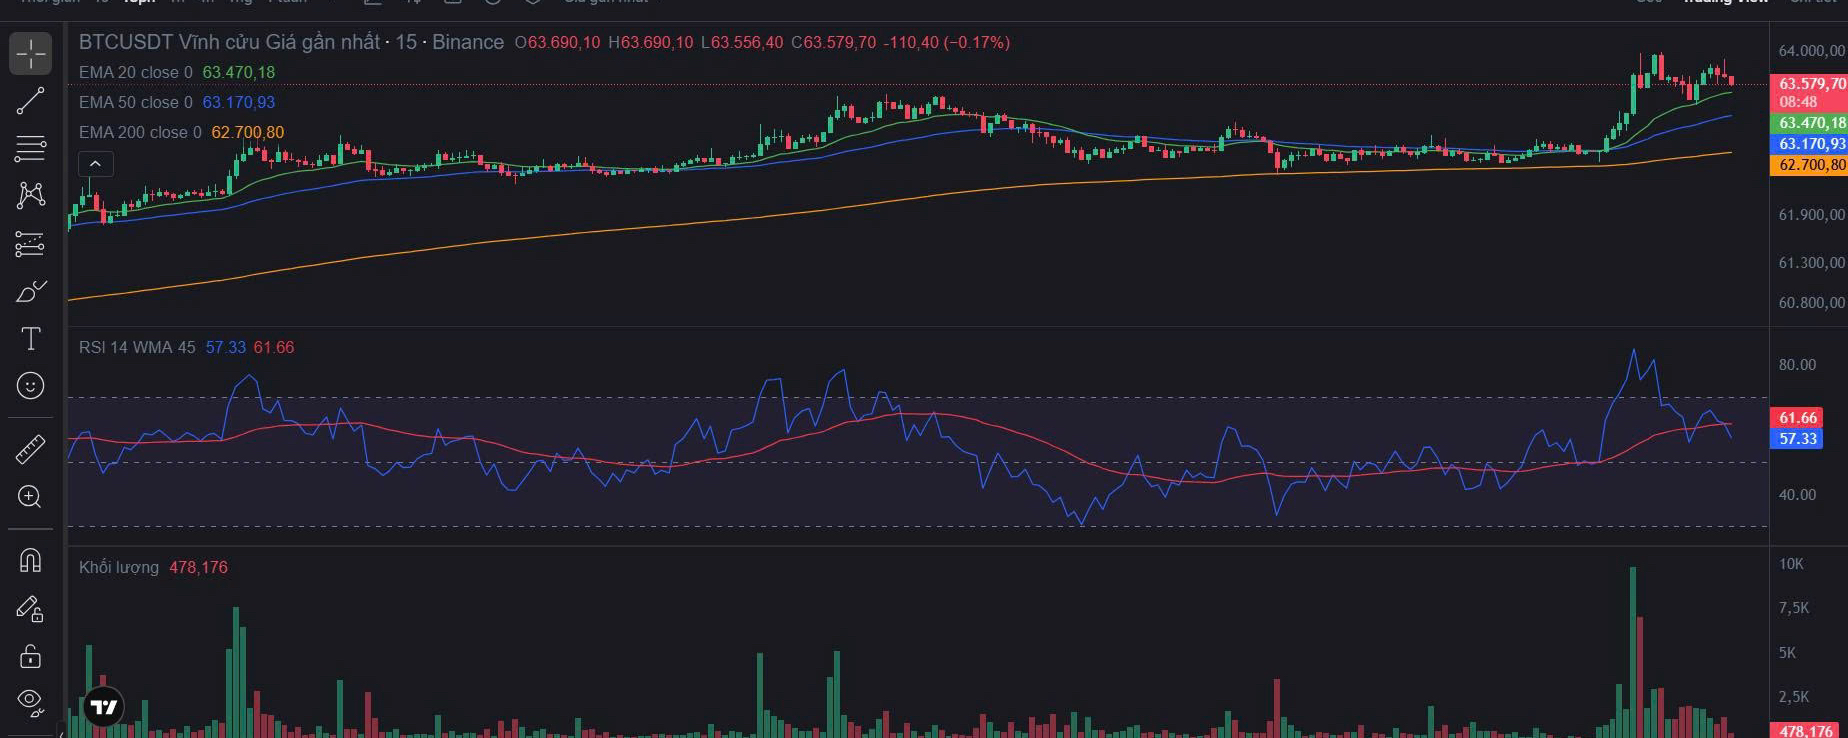
Bro, how’s trading today—are the account still glowing green, or are you deep in losses, gasping for oxygen? 💸 This morning, I opened the charts with $BTC on and almost dropped my coffee cup because “Grandpa” Bitcoin is putting on some price-movement moves that look downright intense. After a long stretch of gradually going flat and making everyone on the bullish side feel worn out and discouraged, today the market board is once again flooded with brave shades of green. If any of you are itching to place orders, and want to find a real, on-the-ground setup with a good position, come sit here—turn on the chart with me and let’s break down where the money from the “whales” is flowing! ☕
1. Daily timeframe (1D): The Bulls are working hard to build a rampart 📉
Looking at it from a larger perspective on the bigger charts: BTCUSDT has just gone through a pretty harsh beating period—price has been repeatedly crushed below the EMA 50 ($65,742.17) and is currently quite far from the EMA 200 ($75,401.36). Overall, the main trend still looks like a correction with selling pressure dominating.
But take a close look at today’s daily candle, will you—the reversal wind is already blowing! Dip-buying demand jumped in and helped price make a jaw-dropping pullback, pushing BTC above the EMA 20 ($62,513.87), and it’s currently hovering around $63,744.10. Another credibility point: the 1D RSI has officially risen above 52.19. This shows buyers are actively accumulating, stopping the free-fall momentum and trying to build a solid launchpad for the rebound. 🐋
2. 4H and 1H timeframes: Bursting strength—buyers own the short-term battlefield ⚡
Zoom in on the smaller timeframes to find the “long setup” to place orders—this is where the Bull camp’s excitement is clearer than ever:
On the 4H chart: Bitcoin just saw an extremely high volume push, completely breaking through both EMA 20 ($62,495.15) and EMA 50 ($61,716.65 resistance bands with long-bodied candles. The current price is now hovering close to the EMA 200 line ($63,965.64). The 4H RSI indicator surged to 69.11—right at the edge of the overbought zone—showing the Bulls have the steering wheel and are accelerating extremely strongly. 🐂
Now on the 1H chart: a complete Bullish Structure has been established. BTC has compressed price extremely tightly, then exploded with volume, breaking through both the EMA 200 ($61,655.30), EMA 20 ($63,082.24), and EMA 50 ($62,744.93). The current 1H RSI is sitting quite high (70.61). The consolidation around $63,737.70 right now is nothing more than a technical cooldown so the Bulls can “breathe” and gather strength—there’s still no sign of a bearish reversal turning the car around, folks.
📝 WAR PLAN (WAITING FOR A RETEST, ABSOLUTELY NO FOMO)
The green candles are definitely exciting, but my blood-and-bones rule is: I never jump in at the top when the short-term timeframes are overloaded. Be patient and wait for a retest to support for the best position:
Entry Long Zone: Slowly deploy capital; place a pending order when price naturally corrects into the confluence area between the Day-chart EMA 20 line and the short-term EMA bands—best around the 📍 $62,500.00 - $63,000.00 level. Stay calm and wait for price to come here; once a pullback candle appears, we grab our ticket onto the train.
Stop Loss: To protect your money from those familiar wick-sweeps (the house’s “SL hits”), set an absolute SL below the hard support zone of the EMA 200 on the 1H chart. If it breaks the 🚨 $61,500.00 level, that’s the point to cut—preserve capital and wait for the next opportunity.
Take Profit (Profit Target):
Target 1 (Short-term): Take partial profits when price returns to retest the previous high and the EMA 200 resistance zone on the 4H chart around 🏁 $64,000.00 - $64,500.00.
Target 2 (Rebound wave expectation on the larger chart): Hold a long order and push upward toward the EMA 50 resistance zone on the daily chart around 🚀 $65,700.00.
In crypto trading, having a cool head and managing capital are always the make-or-break factors. The short-term structure is strongly in favor of the buyers, but remember: keep volume moderate—never go All-in so you can sleep well at night. 🧠😴
What do you think about this pullback step-back from “Old Man” BTC? Does it have enough force to reverse and kick off a proper uptrend move, or is it just a jerk up to lure FOMO traders before it dumps again? Drop your comments below and let’s discuss together! 👇💬
