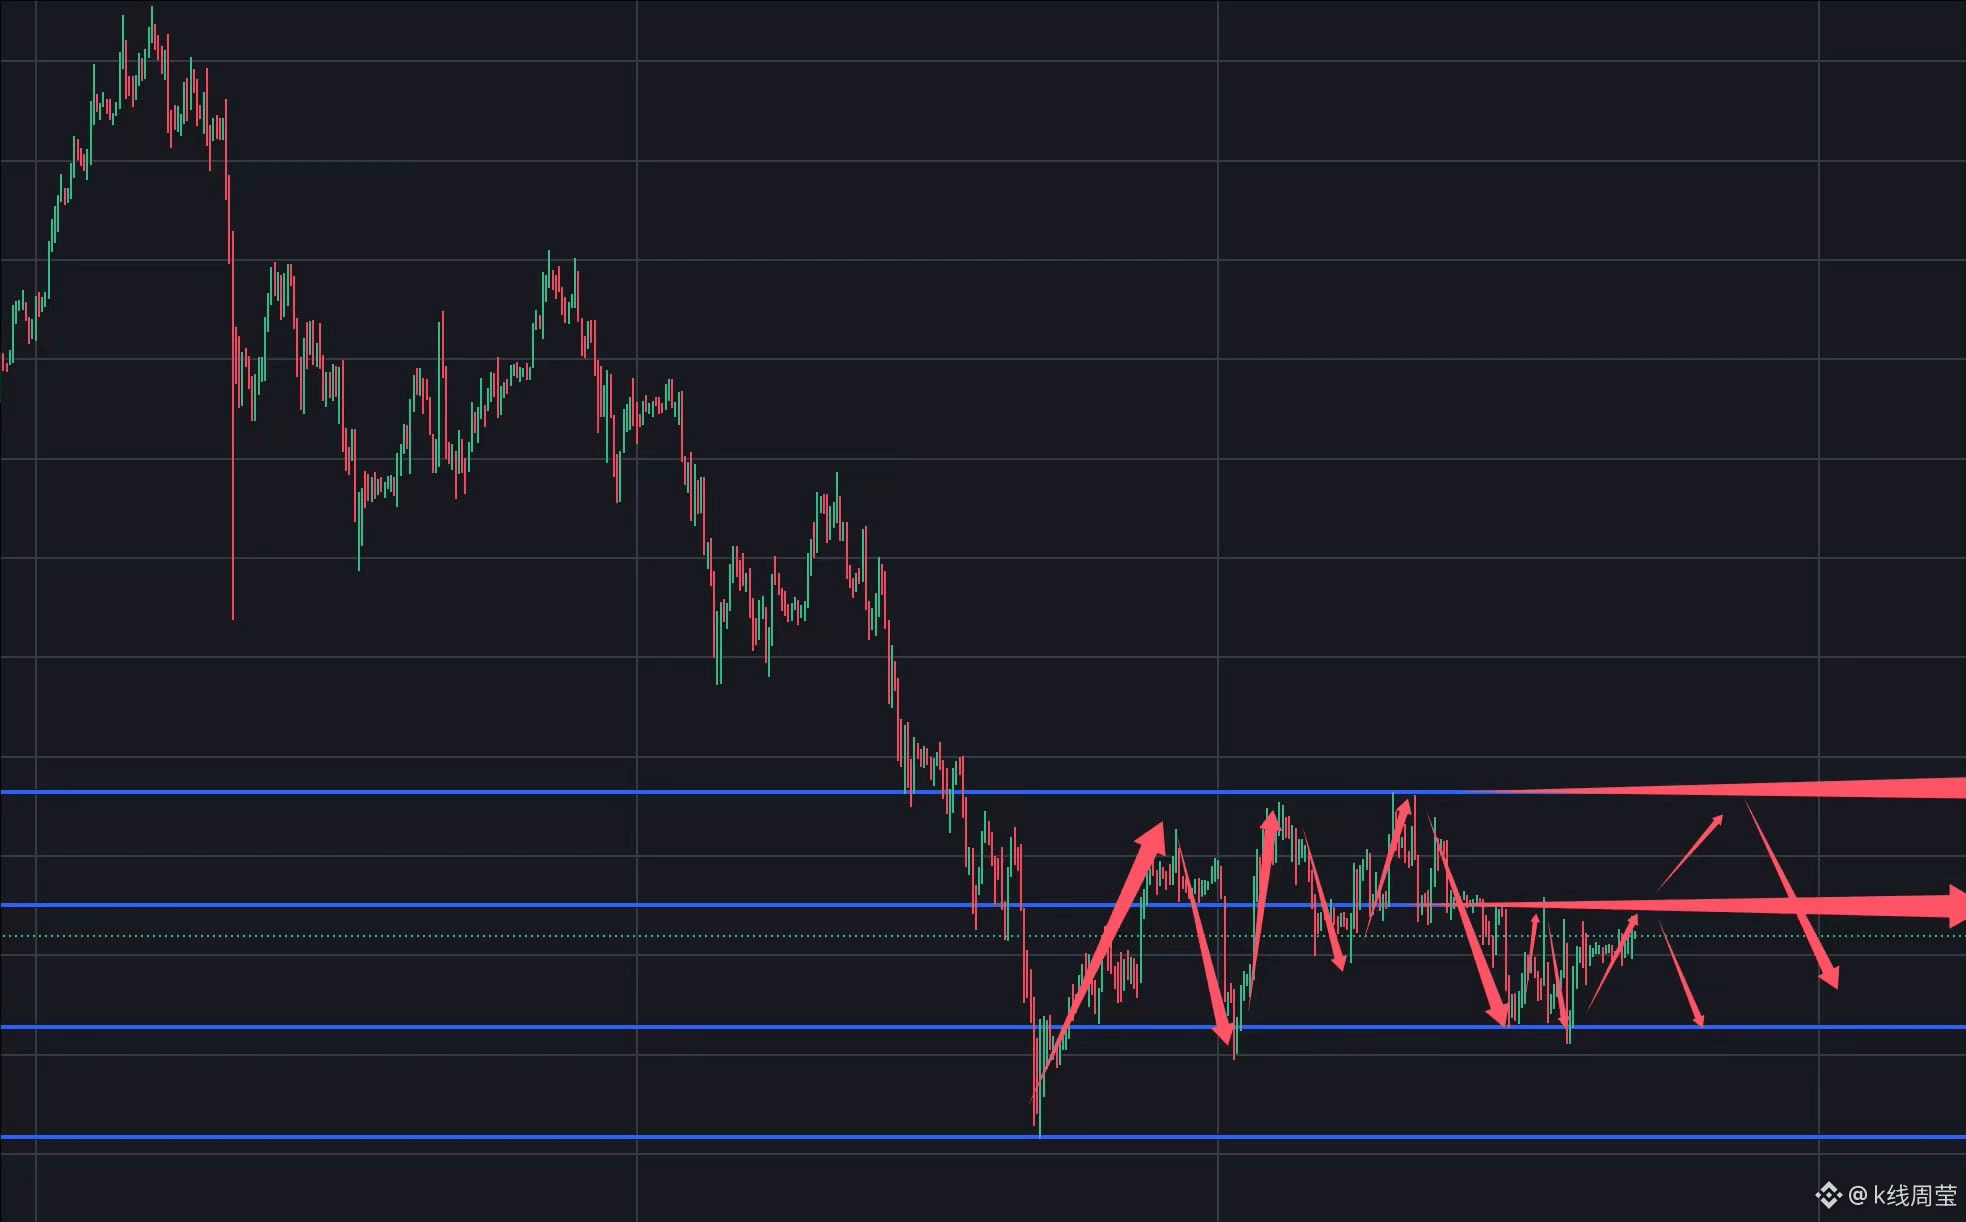
12.22BTC/ETH Operation Guide:
Bitcoin Technical Analysis: Daily RSI ≈ 38 (Oversold edge), 1-hour RSI ≈ 54, MACD small positive bar, short-term weak rebound momentum; Daily is under pressure at $90,000, with critical support at $87,000 and $85,000 below. Breaking below may accelerate downward. The Fear and Greed Index is about 23 (Extreme Fear), options skew is bearish, with put options concentrated at $85,000, showing high demand for downside protection. Long-term holders continue to sell, spot buying is insufficient, ETF inflows are slowing, and liquidity is average.
For intraday operations, focus on the pressure at the $90,000 level first, and then the high of $94,400 from the week before last, which serves as a reference for shorting. Support below is at the $85,000 level; if it does not break here during a pullback, a rebound is still likely. Currently, the market is still viewed as range-bound, with resistance at $90,000 and $94,000 above, and support at $85,000 and $80,000 below.
Trading Strategy:
Short around $9,000, targeting down to $88,000-$87,000-$85,000, with a stop at $91,500.
Long around $85,000, targeting up to $86,000-$87,000-$88,000, with a stop at $84,000.
Ethereum Technical Analysis: Daily RSI ≈ 39 (Near Oversold), 4-hour RSI ≈ 52, MACD small positive bar, short-term weak rebound; Daily resistance at $3,000, with critical support at $2,950 and $2,900 below, breaking below may test $2,800.
Trading Strategy:
Short near $3,050, targeting up to $2,950-$2,900-$2,800, with a stop at $3,150.
Long near $2,800, targeting up to $2,850-$2,900-$2,950, with a stop at $2,750.
From the above viewpoints, it is clear that Zhou Ying still advocates for primarily short positions. Once the market starts to decline, the pullback shorts will be stronger, with significant pressure on the upper side. In contrast, the pullback longs have relatively smaller stops, representing a rebound betting position. High shorts, low longs, rather than chasing highs and cutting losses.
Bitcoin Technical Analysis: Daily RSI ≈ 38 (Oversold edge), 1-hour RSI ≈ 54, MACD small positive bar, short-term weak rebound momentum; Daily is under pressure at $90,000, with critical support at $87,000 and $85,000 below. Breaking below may accelerate downward. The Fear and Greed Index is about 23 (Extreme Fear), options skew is bearish, with put options concentrated at $85,000, showing high demand for downside protection. Long-term holders continue to sell, spot buying is insufficient, ETF inflows are slowing, and liquidity is average.
For intraday operations, focus on the pressure at the $90,000 level first, and then the high of $94,400 from the week before last, which serves as a reference for shorting. Support below is at the $85,000 level; if it does not break here during a pullback, a rebound is still likely. Currently, the market is still viewed as range-bound, with resistance at $90,000 and $94,000 above, and support at $85,000 and $80,000 below.
Trading Strategy:
Short around $9,000, targeting down to $88,000-$87,000-$85,000, with a stop at $91,500.
Long around $85,000, targeting up to $86,000-$87,000-$88,000, with a stop at $84,000.
Ethereum Technical Analysis: Daily RSI ≈ 39 (Near Oversold), 4-hour RSI ≈ 52, MACD small positive bar, short-term weak rebound; Daily resistance at $3,000, with critical support at $2,950 and $2,900 below, breaking below may test $2,800.
Trading Strategy:
Short near $3,050, targeting up to $2,950-$2,900-$2,800, with a stop at $3,150.
Long near $2,800, targeting up to $2,850-$2,900-$2,950, with a stop at $2,750.
From the above viewpoints, it is clear that Zhou Ying still advocates for primarily short positions. Once the market starts to decline, the pullback shorts will be stronger, with significant pressure on the upper side. In contrast, the pullback longs have relatively smaller stops, representing a rebound betting position. High shorts, low longs, rather than chasing highs and cutting losses.