$ETH
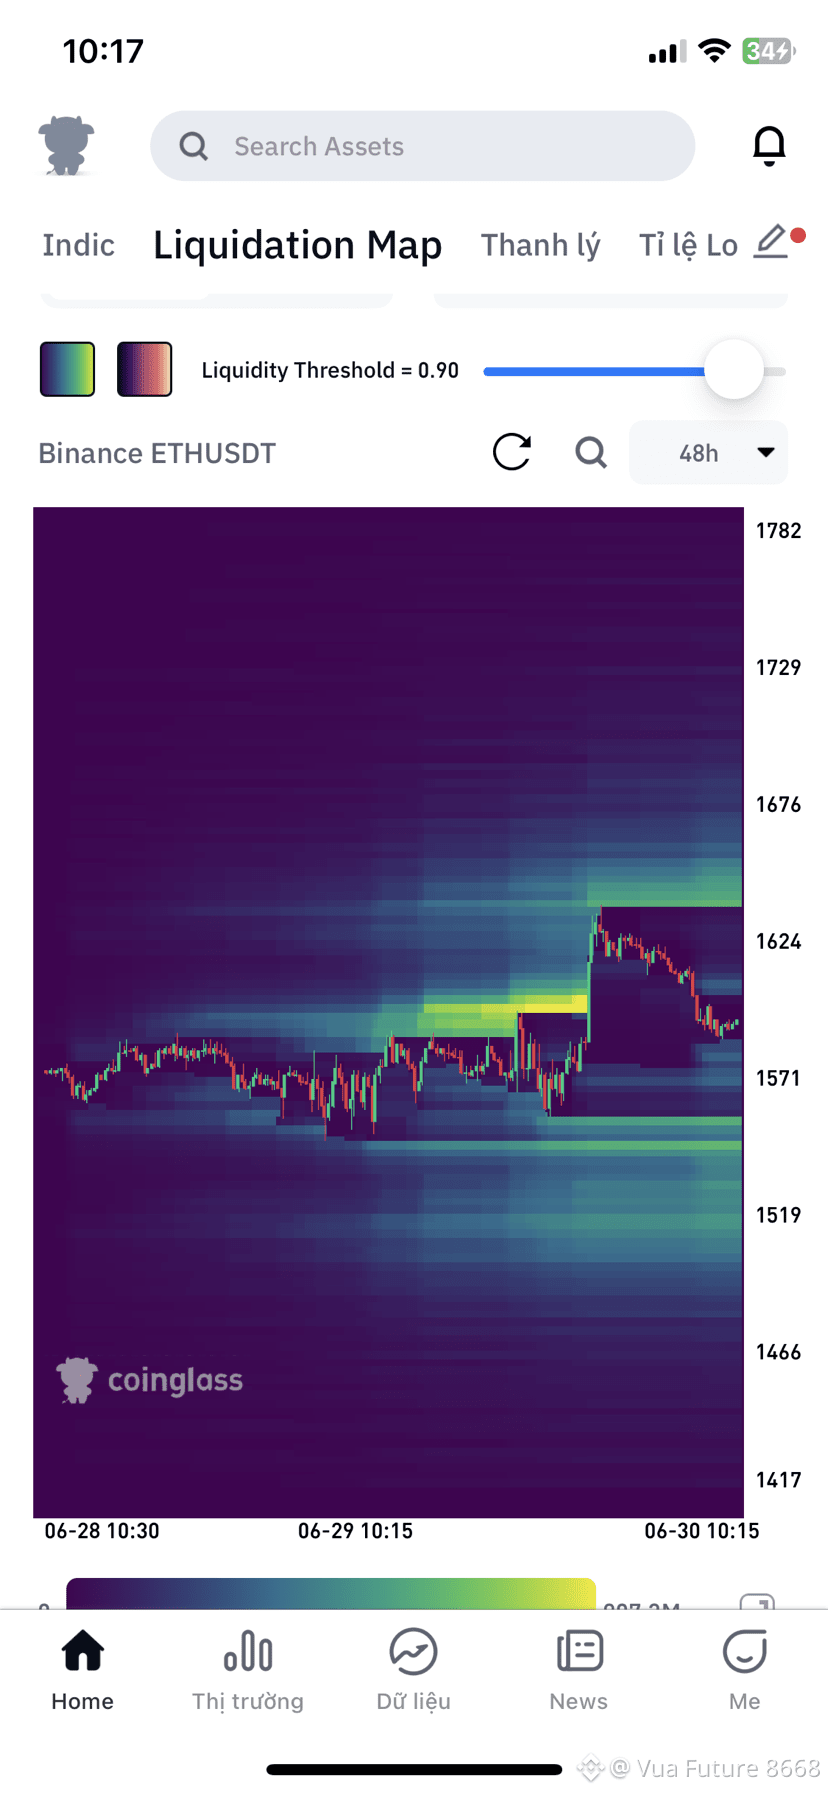
The heat map shows color bands from purple (low density) to blue/yellow (high density). Prices tend to be drawn toward areas with higher liquidation density (bright color zones).
Below the current price (Long zone with liquidation risk): There is a very intense bright yellow/light blue band concentrated around the 1,520 – 1,560 area. This is where the Stop Loss/Liquidation orders for many Long positions are clustered.
Above the current price (Short zone with liquidation risk): After the sweep up to the 1,624 zone, the liquidation areas above the current price are rather thin (dark purple/blue). There is no overly large liquidation cluster immediately above.
(Short): Bias toward Short or stand aside and observe the downward momentum. The reason is that the price is trending to be drawn downward to sweep (hunt) the major liquidation zone of the Long side clustered at 1,520 – 1,560. The current price (around 1,570 – 1,590) is currently losing bearish momentum as it gravitates toward this zone.
The heat map shows color bands from purple (low density) to blue/yellow (high density). Prices tend to be drawn toward areas with higher liquidation density (bright color zones).
Below the current price (Long zone with liquidation risk): There is a very intense bright yellow/light blue band concentrated around the 1,520 – 1,560 area. This is where the Stop Loss/Liquidation orders for many Long positions are clustered.
Above the current price (Short zone with liquidation risk): After the sweep up to the 1,624 zone, the liquidation areas above the current price are rather thin (dark purple/blue). There is no overly large liquidation cluster immediately above.
(Short): Bias toward Short or stand aside and observe the downward momentum. The reason is that the price is trending to be drawn downward to sweep (hunt) the major liquidation zone of the Long side clustered at 1,520 – 1,560. The current price (around 1,570 – 1,590) is currently losing bearish momentum as it gravitates toward this zone.