


This article unfolds along a single path: from “why妖 coins (cryptos) rise” → to “how to identify the phases” → to “use a LAB case to dissect and analyze” → to “how to form a trading system”.
The essence of妖 coin (crypto) price increases is a liquidity game.
In the past altcoin season, the key was the spread of consensus. Once the market believes a narrative, capital flows from leading players to the second tier, then to small-cap names—until it finally forms sector rotation.
But the market environment has changed now.
The VC-coin narrative fails;
First-tier Meme PVP gets caught in an over-competition loop;
Mainstream coins weaken following BTC;
Product coin attention is being diverted by US stocks’ AI and Binance’s US-stock-linked tokens.
Liquidity hasn’t disappeared—it’s just shifted from “narrative consensus” liquidity to “low market cap, high volatility.”
Previously, the research focused on: the project, narrative, VC, product, ecosystem, and roadmap.
What we mainly study now: how much the controlling parties hold, who is opening shorts, who is being forced to close, and who will become the fuel.
In my view, the drivers for a memecoin/small cap coin rally can be roughly divided into four types:
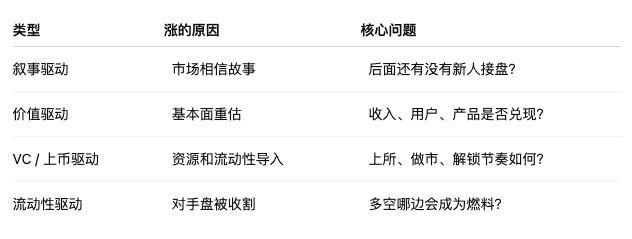
In a bear market, most妖币 belong to the fourth type.
They don’t rise because “everyone believes” in it—they rise because “one side is forced to surrender.”
If longs are crowded, you kill the longs. If shorts are crowded, you squeeze the shorts.
So, the core of a妖币 is not basic fundamentals pricing—it’s counterparty pricing.
In essence, all indicators are just translators of capital behavior.
OI, CVD, Funding, trading volume, liquidations, on-chain transfers—none of these are the answer. They’re only translators of capital behavior.
My priorities are:
Price structure > key levels > volume > OI > CVD > Funding > liquidations.
The price structure tells us the direction—what stage we’re currently in;
Key levels tell us the life-or-death lines for longs and shorts;
Volume tells us whether the move has real strength;
OI tells us whether the derivatives “bets table” is getting bigger, and whether capital is staying behind;
CVD tells us the direction of active buying/selling;
Funding tells us whether the long/short sentiment is crowded;
Liquidations tell us which side is currently being harvested.
But the most important point is: the same indicator means completely different things in different stages.
Accumulation phase: OI increases—could be “watering/storage.”
OI increases at high levels—it could be “buyers absorbing supply.”
During the main upswing, if Funding is overheated, it could be acceleration.
High-level Funding overheats—could be a countdown to death.
Therefore, before looking at indicators, you must first determine the stage.
The five stages of a妖币
Right now I divide妖币行情 into five stages:
Ignite.
Leverage clearing / washout
High-level consolidation / secondary ignition accumulation zone
Secondary ignition leading to the main upswing
Observe high-level fuel decay / distribution
These five stages are not meant to predict that every coin will go through all of them. They’re meant to help you judge: which storyline this coin is currently in.
Ignition period: see whether capital starts to enter;
During the washout period, when you see the dump, determine whether it marks the end of selling pressure—or the clearing of leverage;
Consolidation accumulation period: after the first wave, has the consolidation been lifted higher?
During the main upswing period, see whether the secondary ignition enters trend acceleration and whether the fuel is still being cashed out;
Distribution observation period: check whether the efficiency of the upward move is decreasing, and whether the fuel is starting to decay.
LAB case breakdown
Stage 1: ignition period—watch small exchange volume and OI anomalies
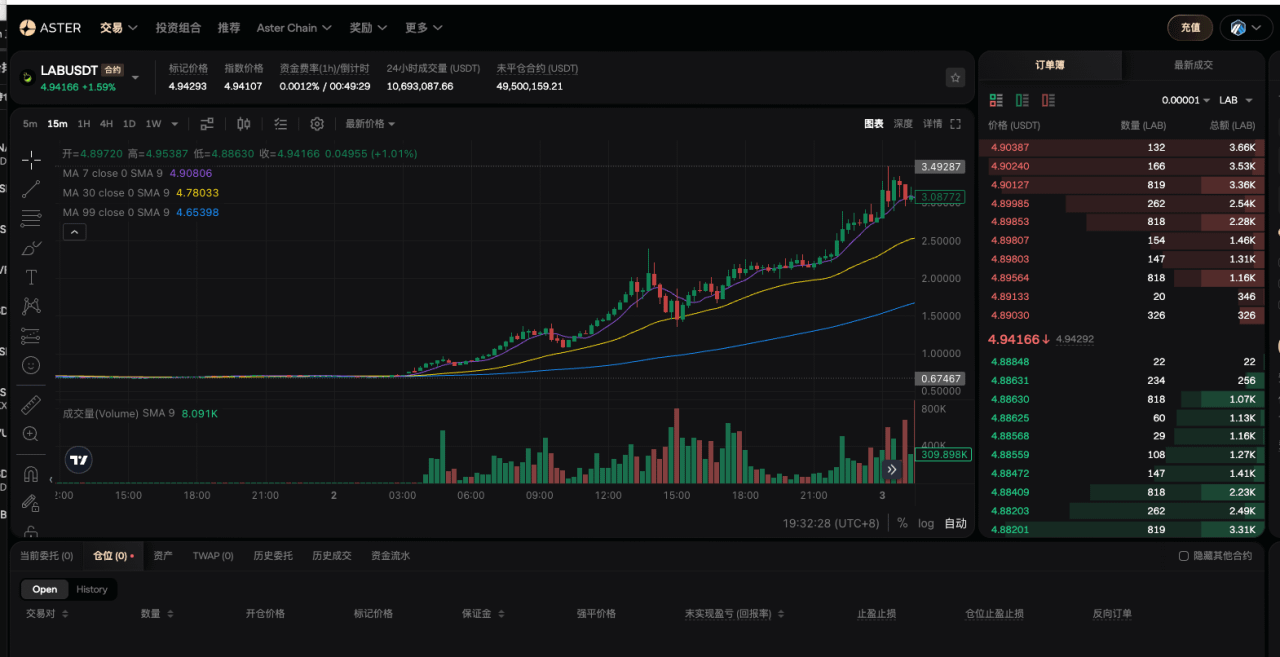
LAB’s first-stage ignition wasn’t initiated first by Aster, but because Binance has more trading noise, the early anomalies weren’t obvious.
The truly valuable part is this: for small exchanges like Aster that usually have extremely low trading and fewer retail traders, when volume suddenly expands from a “dead-water state” to more than 10x the past average, it often means new active capital has appeared in the order book.
Micro evidence: Before May 2, LAB on Aster’s spot and perpetual contract order books was in an “absolute dead-water state” (daily average trading volume was nearly zero). But at the May 2 03:00 node, the 15-minute trading volume showed step-like amplification exceeding the baseline by 10x or more. Starting from 0.68 U, the coin’s price was pushed to above 4U, completing the first major upswing.
Here the focus isn’t “Aster goes up first,” but:
When Binance already shows ignition signs, a low-baseline market like Aster can more clearly expose the strength of capital anomalies.
Knowledge point: small exchanges are not a leading signal—they’re a signal amplifier.
Most people are used to only looking at Binance’s volume, OI, and price structure. But because Binance has many participants—including lots of arbitrage, market makers, retail追单 (chasing orders), and high-frequency trading—early volume expansion is often drowned out by background noise.
And for places like Aster with low baseline volumes, volume is usually very low. Once capital begins to step in, the volume changes look more like “suddenly popping up from flat ground.”
Multi-dimensional signal resonance verification:
Watching only small-exchange volume expansion might just be volume-painting or short-term arbitrage; watching only Binance volume expansion might just be a normal rebound. But what made LAB worth truly paying attention to at the time was that multi-dimensional signals resonated together (the red arrow area in Figure 2):
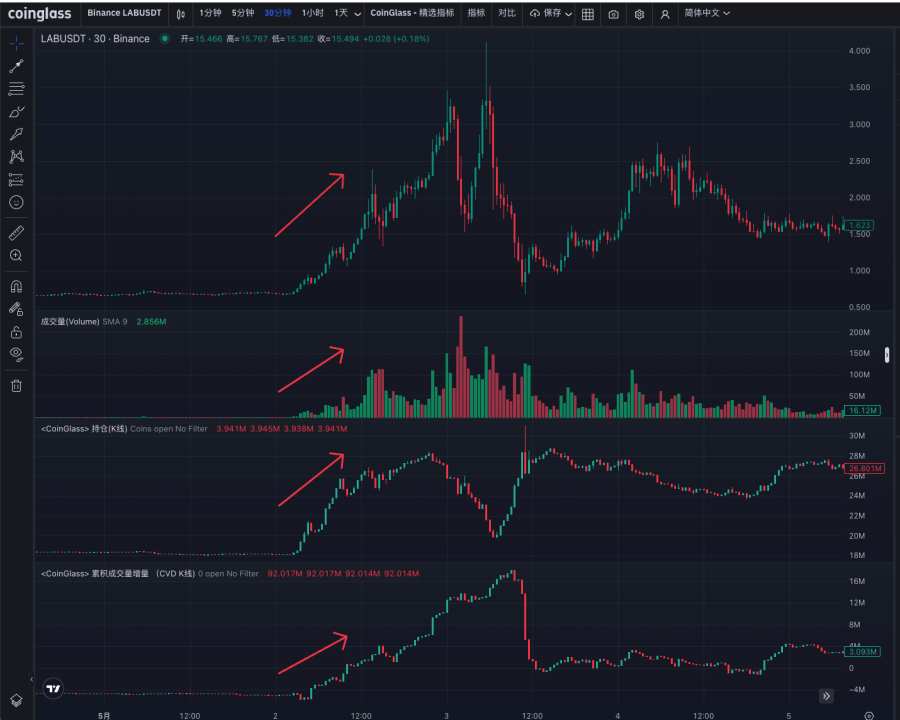
Volume expands: it means the previously quiet market has started to attract capital involvement;
Price rises: it means the buy orders are not just fake resting orders—they’re truly pushing成交 (trades).
OI increases: it means contract capital has started entering, and the betting table grows;
CVD (cumulative volume delta) rises: it means the active buying side has the advantage, not just passive matching;
After the following pullback, if OI does not reset to zero, it indicates this wasn’t just a one-way flow; capital may remain in the market to keep battling.
When Aster—like this small exchange—shows abnormal volume, then the price rises + volume expands + OI rises + CVD net buys happen simultaneously in sync resonance, that is the purest ignition signal for a妖币.
Stage 2: leverage-clearing washout stage
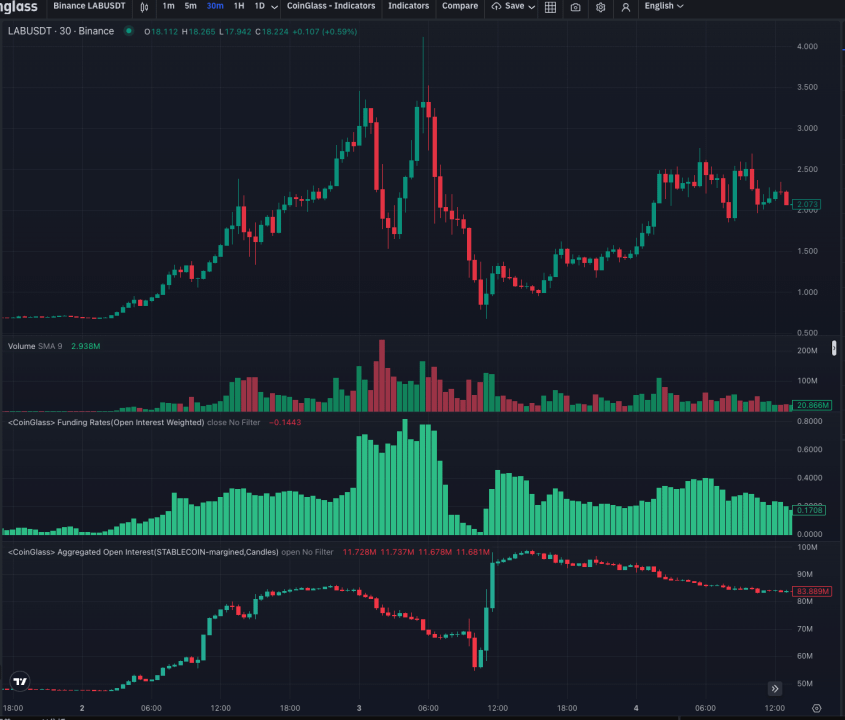
Before LAB’s first-wave launch, the funding rate stayed within a normal range of 0.02%-0.2%. As the coin price kept rising continuously, on May 3 the funding rate spiked to 0.7%-0.8% per 4 hours. The longs were extremely crowded, and at that moment the funding rate had already topped out as a sentiment indicator.
Mapping to OI:
Price path: 0.68U → 4.1U → 1.8U → 0.66U
The USD OI path: 47M → 85M → 54M → V rebound back to 98M, then it drops and stabilizes around 83M
This set of data shows that when the price rose from 0.68U to 4.1U, the USD OI increased from about 47M to about 85M. Then when the price pulled back to around 1.8U, USD OI dropped to about 54M, indicating that a large amount of high-level contract positions was forced out.
But the truly key part is: after the price wicked/pinched down to around 0.66U, USD OI showed a V-shaped rebound and even returned to above 80M temporarily—then the price also rebounded accordingly.
This means: the long-side leverage has been cleared for a round, Funding has been reset, but the derivatives game in the market hasn’t gone to zero. After LAB’s crash, it didn’t enter a full-on retreat phase; the conditions for renewed competition and a secondary ignition still remain.
Later, the price indeed quickly surged back from 0.66 to above 4u, which validated this: this crash was not just simple distribution—it looked more like a brutal leverage-and-liquidity stress test.
Knowledge point: the crash after the first wave of a妖币 can’t be simply equated with the end of the行情
After the first wave of a妖币, there often appears an extreme dumping event.
To judge whether it’s dumping and distributing or clearing leverage via washout, you can’t rely only on the drop amount. You need to look at a few things:
Is funding extremely overheated? 2. Has the price fallen back to the original launch zone, and can it quickly reclaim after the wick/pin? 3. Is OI completely cleared, or does it still remain—even with another upswing?
Judging result:
Falls back to the launch zone + can’t reclaim it: first-wave failure / distribution.
Back near the launch zone + quick reclaim: a stress test / taking liquidity—there is still a possibility of further back-and-forth trading.
Not falling back to the launch zone + OI remaining: consolidation base being lifted—candidate.
After Funding overheats, a crash happens + OI isn’t cleared: leverage clearing doesn’t necessarily mean it’s over.
After the dumping, long-term low volume and drifting down: fuel is exhausted, and chances are high it will enter a retreat phase.
Stage 3: high-level consolidation / secondary ignition accumulation zone
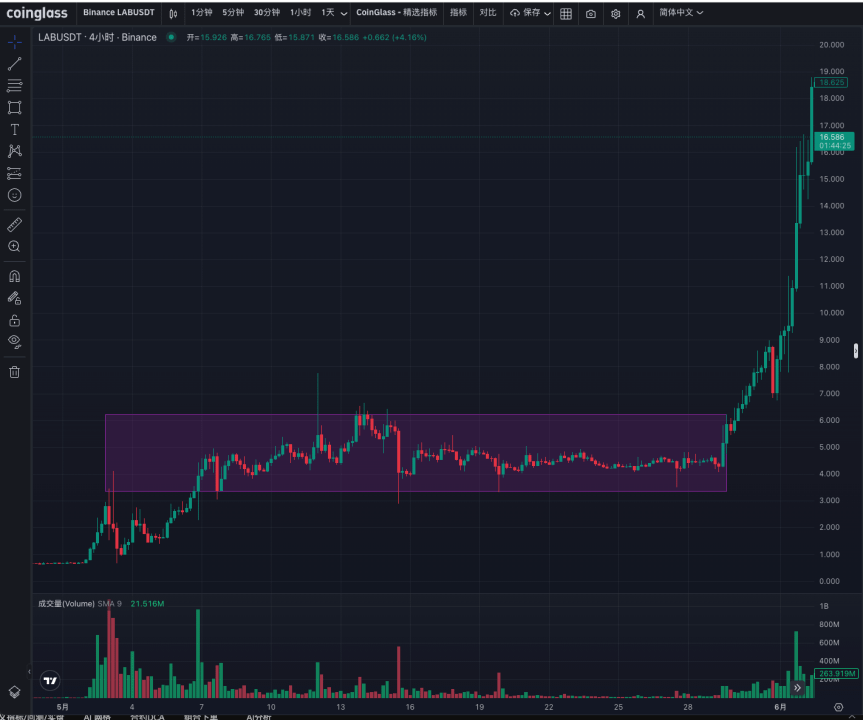
In this stage for LAB, the key isn’t going sideways—it’s that the consolidation base is being lifted.
The original launch zone was 0.6–1U. After experiencing a fierce spike during the first wave and then a big long-side leverage washout, the coin price did not just bleed down and give back all the gains. Instead, market makers used real money to forcibly build a high-level consolidation around 4u–6u for nearly a month.
For妖币, this kind of high-level box-range breakout is often the second trading opportunity.
The money made in the first wave is the money from “discovering who controls it.”
The money made from breaking a box range is the “confirmation money” of the secondary ignition.
The core is multiple confirmations from trading volume, K-lines, capital flow from CoinAnk, and more.
Similar example of rising consolidation
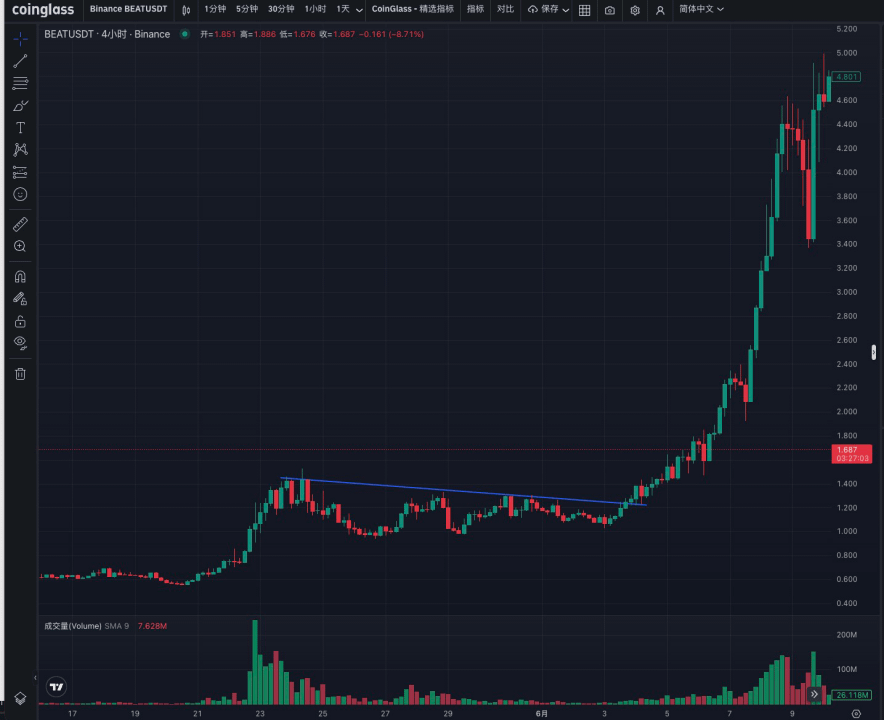
1. After BEAT’s June 3 4h-level descending trendline is a valid break, the main upswing begins
2. Binance life (consensus-flow coins): May 31, breakthrough of a 4H-level horizontal range
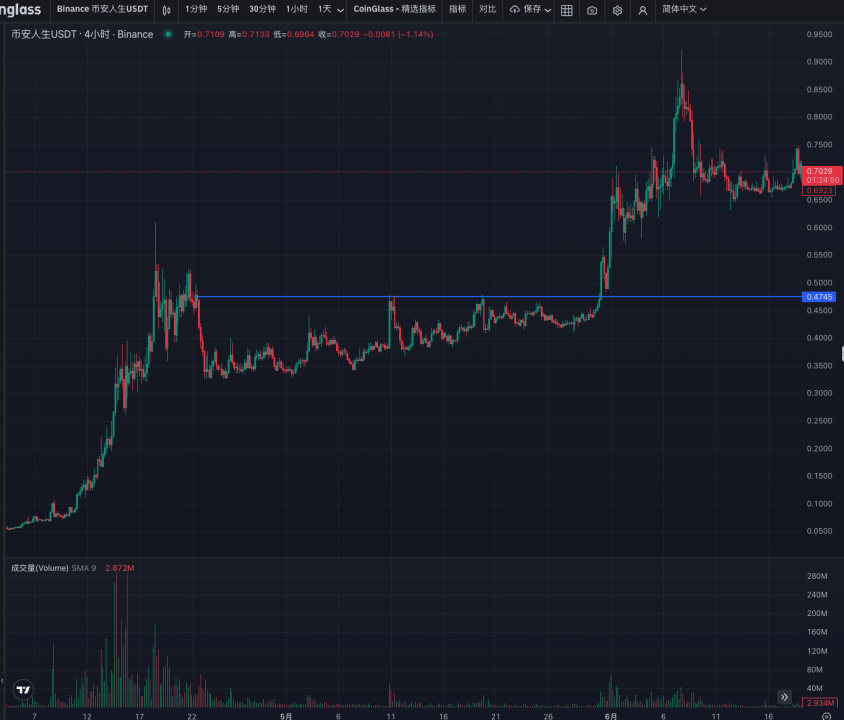
In one sentence: whether it’s a box range or a descending trendline/horizontal line, in Stage 3 you don’t buy a breakout. You’re judging whether this妖币 has the资格 to enter the second main upswing.
Stage 4: secondary ignition main upswing
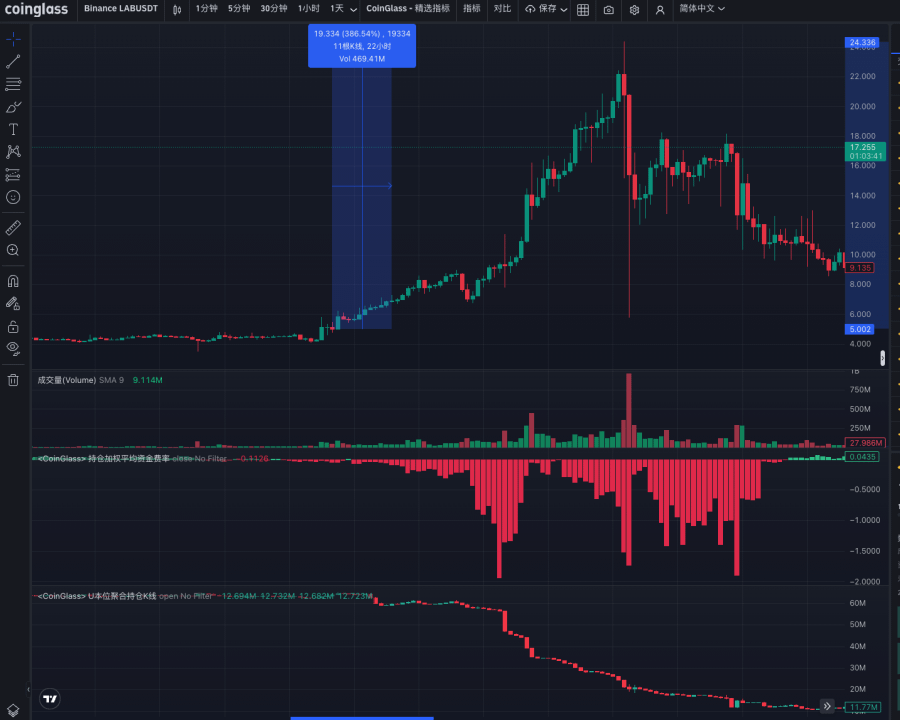
If Stage 3 is the “does the consolidation base get lifted?” observation question, then Stage 4 is the “after the consolidation breaks, is the fuel being cashed out?” trading question.
After LAB broke through the 4–6u high-level consolidation base, it didn’t follow the traditional pattern of “price up + OI up.” Instead, the price climbed steadily from 6U to 24.4U, while OI kept declining and the funding rate stayed deeply negative for a long time.
This explains the core fuel behind this main upswing: it’s not new long contract positioning, but the continuous squeezing of previously accumulated short positions. With shorts stuck under deeply negative funding, they’re forced to hold the trade (“carry the position”). After the price keeps rising, shorts keep covering, and their buyback pushes the price even higher.
In high-control妖币, when the price rises + Funding is deeply negative + OI declines, it doesn’t necessarily mean weakness; it may actually be that the forced short squeeze main upswing is being cashed out.
The short squeeze stage mainly combines liquidation data, a liquidation heatmap, and estimates fuel progress based on Funding recovering from deeply negative to near 0.
Stage 5: high-level fuel decay / distribution observation
In the high-level fuel decay stage, the price action becomes very “unclean”:
Even though the price stays high, after every push up it rapidly falls back, suggesting that sell pressure above is getting heavier. Volume also is no longer healthy continuous expansion pushing price higher; it’s more like pulse-like volume expansion: a spike up with volume, then a dump also with volume. Repeated pushes followed by pullbacks put the market into a high-level, wide-range consolidation phase.
In this stage, the rally may be bull traps, while a sharp drop may be clearing leverage—and even the rebound may be just manufacturing new counterparty positioning. The market is no longer a single-direction main upswing; it enters a zone of both longs and shorts being killed, and trading difficulty clearly rises.
The high-level distribution observation stage can’t be judged only by “the price falling.” You must check whether the fuel is decaying.
If the following signals appear after the main upswing, you need to switch from “holding the main upswing” to “distribution observation”:
Rebounds multiple times still can’t break the prior high;
High breakout with volume, but the price can’t go far;
CVD rises, but the price no longer makes new highs;
Funding recovers from deeply negative to near 0, reducing short-side fuel;
Volume turns into pulse-like behavior: it surges with volume and also dumps with volume;
Price breaks below the previous acceleration platform;
Rebounds become more and more dependent on wicks/pins rather than smooth trends.
The more conditions it meets, the closer it is to high-level fuel decay.
In this stage, the focus isn’t on predicting whether it will reset to zero; it’s about avoiding mistaking the high-level wide oscillation after the main upswing for a new accumulation area.
Catching-a-妖 SOP: from anomaly screening to a trading plan
Trading a妖币 cannot rely on a single indicator.
OI anomalies, capital inflows, Funding, CVD, on-chain chips, and K-line structure—fundamentally, they’re just different slices of capital behavior. The truly effective approach is: first use data to screen anomalies, then use structure to judge the stage, and finally use a trading plan to control risk.
Step 1: anomaly screening
Step 1 isn’t to open a position directly. First, find where the abnormal capital activity starts.
You can use tools like Coinglass OI / Coinank OI / Coinank capital flow / exchange gainers boards, with the focus on OI and capital flow anomalies as the initial screening signal.
Abnormal OI
OI represents the size of open derivatives positions—the size of the “bets table” in contracts.
OI can only be used as an initial screening signal; it can’t be the sole reason for buying. To truly judge the direction, you also need to combine price location, CVD, Funding, and the K-line structure.
2. Abnormal capital flow
Capital flow signals mainly look at CoinAnk’s 15m and 1h inflow data. The higher the ratio of capital inflow / circulating market cap, the more worth paying attention to the anomaly. For low market-cap coins, a 1-hour inflow of 1 million may be more important than a 10 million inflow for a big market-cap coin.
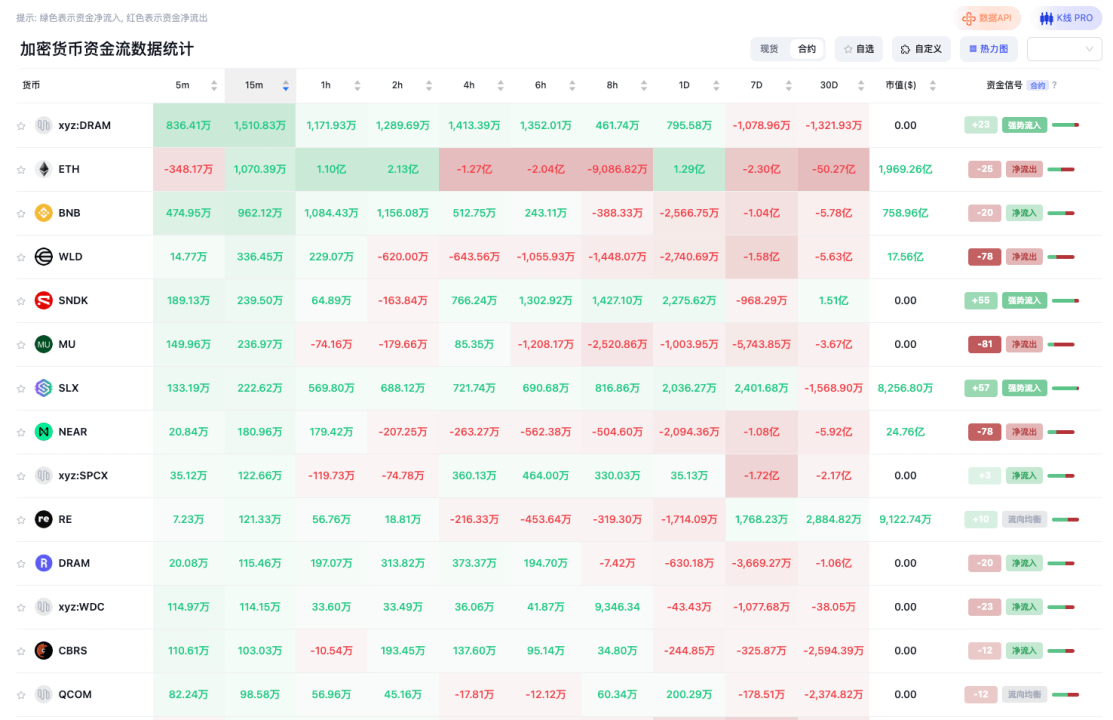
If a low market-cap coin stays dead in liquidity for a long time, then suddenly shows continuous net inflows on 15m/1h, while OI and volume start to expand, it can be put into the candidate pool.
Step 2: Fundamental and position/chip filtering
After the initial screening, to judge whether it has “妖币 soil,” you usually need several conditions: low circulating market cap, tokens in Binance alpha contract exchange zone, high-control盘, and whether there has been a huge unlock recently.
Note: a high-control盘 is not good news, but a condition for volatility. It can make the coin surge violently, or it can make it fall when liquidity dries up.
Step 3: Use Coinglass / Coinank to judge the current stage
This is the most critical step. The same indicator means completely different things at different stages.
The same applies to OI increase: in the ignition period it may be accumulating fuel, while at high levels it may be buyers taking positions. The same applies to Funding being deeply negative: at low levels it can be fuel, and in the later part of the main upswing, it may be the last batch of shorts being harvested.
Therefore, before looking at indicators, you must first determine what stage it’s in: ignition, washout, secondary main upswing, or high-level distribution.
Step 4: Use the candlestick structure to confirm the trading position.
The data tells us “there’s something abnormal,” but what truly determines whether it can be traded is the structure—drawing the launch platform, the breakout level, the prior highs and resistance levels, and then formulating the relevant trading plan to confirm whether it’s a watch position, confirmation position, main-upswing position, or a tail position.
Catching a妖 isn’t about chasing the gainers list, and it isn’t about buying just because OI is moving.
The full end-to-end process for scanning and catching妖币:
First use OI and capital flow to find anomalies;
Then use fundamentals and on-chain chips to judge whether it has妖币 soil;
Then use Coinglass / Coinank to determine which stage it’s in;
Finally, use the candlestick (K-line) structure to formulate a trading plan.
There is no true “bible” for trading妖币—only a trading framework that keeps iterating. Don’t worship any indicator, and don’t worship any big player. First determine the stage, then interpret the data. Otherwise, what you see won’t be an opportunity—it will be someone else’s designed liquidity trap.