



Bitcoin trading volume spikes.. Do they indicate a major move coming?
CryptoQuant data reveals a sharp drop in demand, while surges in trading volumes may pave the way for a new surge in market volatility
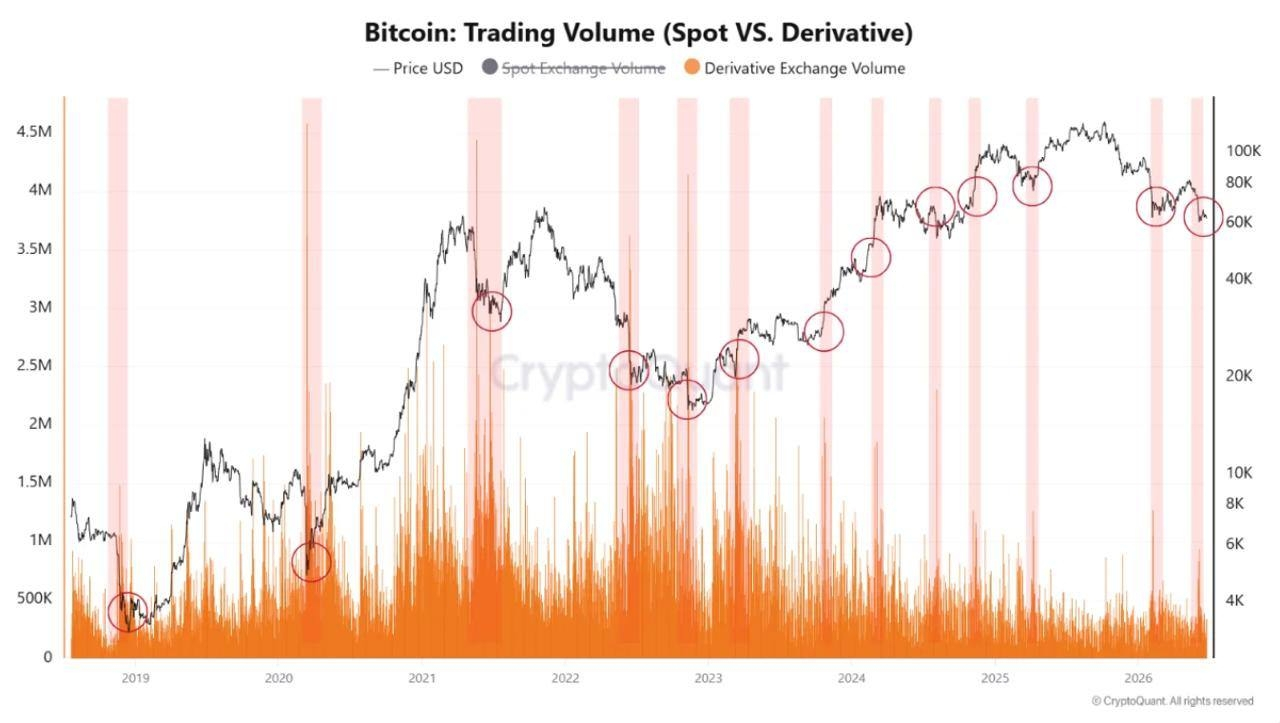
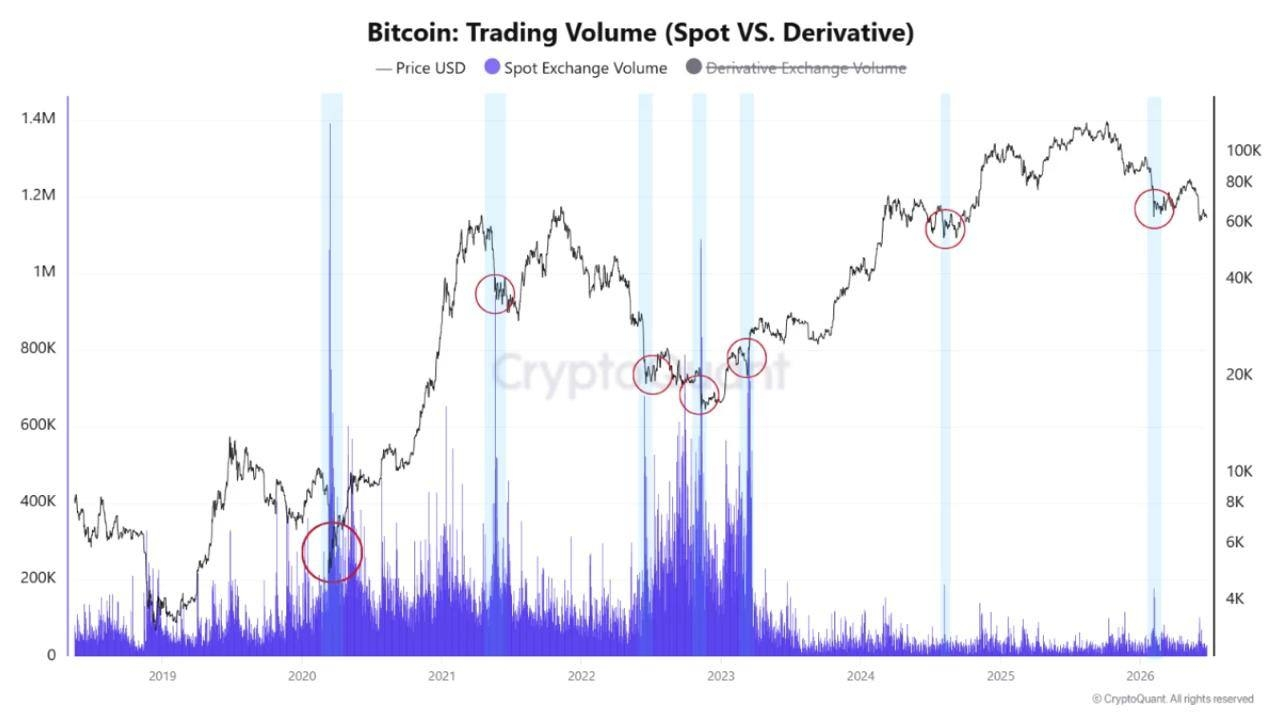
The latest data from blockchain analytics firm CryptoQuant suggests that the Bitcoin market is in a period of lull that could be misleading, as the company’s analysts believe that declining trading volumes alongside sudden surges in volume have historically preceded major price moves, whether upward or downward.
Bitcoin is currently trading below the psychological $60,000 level, after failing to reclaim this barrier since early June, as investors continue to watch demand and liquidity indicators for signals that define the next market direction.
Bitcoin under demand pressure
Although the price remained relatively stable, CryptoQuant data suggests that the main driver behind the June correction was not an increase in supply, but a significant drop in demand.
Spot Bitcoin ETFs on exchanges recorded increasingly large outflows, while demand growth fell over the last 30 days to roughly 74,000 bitcoins in negative territory—the weakest level since the ETFs were launched in the U.S. in early 2024.
At the same time, the Coinbase Premium index remained in negative territory for an extended period, indicating weak demand from U.S. investors.
The Realized Cap index also declined from $1.12 trillion to $1.08 trillion, reflecting the outflow of around $40 billion of capital actually invested on-chain.
Largest contraction in demand since 2022
One of the most notable indicators that caught CryptoQuant’s attention was the contraction in total demand by 652,000 bitcoins over a single week.
The company explains that this reading has appeared only three times since 2019, and all of them were during periods of historical turmoil, including:
The COVID crisis in March 2020.
FTX platform collapse in late 2022.
A market stagnation phase in 2019.
Although these levels preceded the formation of major bottoms in previous cycles, they often came after a period of severe volatility.
Derivatives volume falls to the lowest level since 2023
The spot trading volume on centralized platforms fell to $679 billion in April 2026, registering the lowest level since October 2023.
CryptoQuant believes that such a drop in liquidity makes the market more sensitive to any sudden buying or selling wave, which increases the likelihood of a strong move once activity returns.
> A recurring market pattern:
The lower the trading volumes within a narrow price range, the higher the likelihood that volatility will explode when an exceptional volume appears.
Surrender by short-term investors
The data also showed that 53,800 bitcoins were moved to exchanges within a single day from wallets that had been holding losses.
According to CryptoQuant, none of the transferred coins were profitable, reflecting a clear surrender state among investors who bought near the $80,000 levels.
What do the charts say?
Spot Volume
The chart shows that most spot volume surges preceded major price movements, and the latest one happened in tandem with a bearish break below the $80,000 level.
Derivatives Volume
As for the derivatives market, its spikes seem to be more frequent and have a stronger impact. Major rebound waves appeared in 2022 and 2023, while the latest spikes came as Bitcoin traded within the $60,000 to $70,000 range.
CryptoQuant confirms that these signals do not determine the next direction, but they suggest a phase characterized by rising volatility is approaching.
Key support and resistance levels
Support
Realized Price: around $53,600.
Historically, bearish markets tend to form their bottoms near this level.
Resistance
200-day moving average: at $82,400.
The company believes that this level represents an important technical barrier after the most recent rebound.
Are there any positive signals?
Despite weak demand, CryptoQuant identified two signals that could support the market in the coming period:
Binance recorded a daily spot trading volume of $7.6 billion during the last downtrend wave—levels that have previously been associated with the formation of local bottoms.
An increase in net liquidity of the U.S. Federal Reserve from $6 trillion to $6.17 trillion—an historically supportive factor for high-risk assets.
Signals worth monitoring
CryptoQuant analysts believe that determining Bitcoin’s next direction depends on monitoring four key factors:
Return of positive flows to ETF funds.
The Coinbase Premium index turns positive.
Resumption of Realized Cap growth.
Improved global liquidity and the shifting of part of capital from AI stocks toward digital assets.
Conclusion
CryptoQuant data indicates that the market is facing a demand crisis rather than a supply crisis: so far there have been no signs of widespread selling by long-term investors, while exchange balances remain relatively low.
Although trading volume spikes alone are not enough to determine the next direction, their appearance during quiet periods is often a precursor to strong market moves.
And as demand remains weak, the coming weeks are crucial in determining whether Bitcoin is approaching the formation of a new bottom, or whether another wave of volatility is still on the way.
> Disclaimer: This report relies on CryptoQuant data and analysis up to June 26, 2026, and is not a recommendation to buy or sell. Investing in cryptocurrencies involves high risks.