

## 📊 Sentiment Analysis: CHIP/USDT 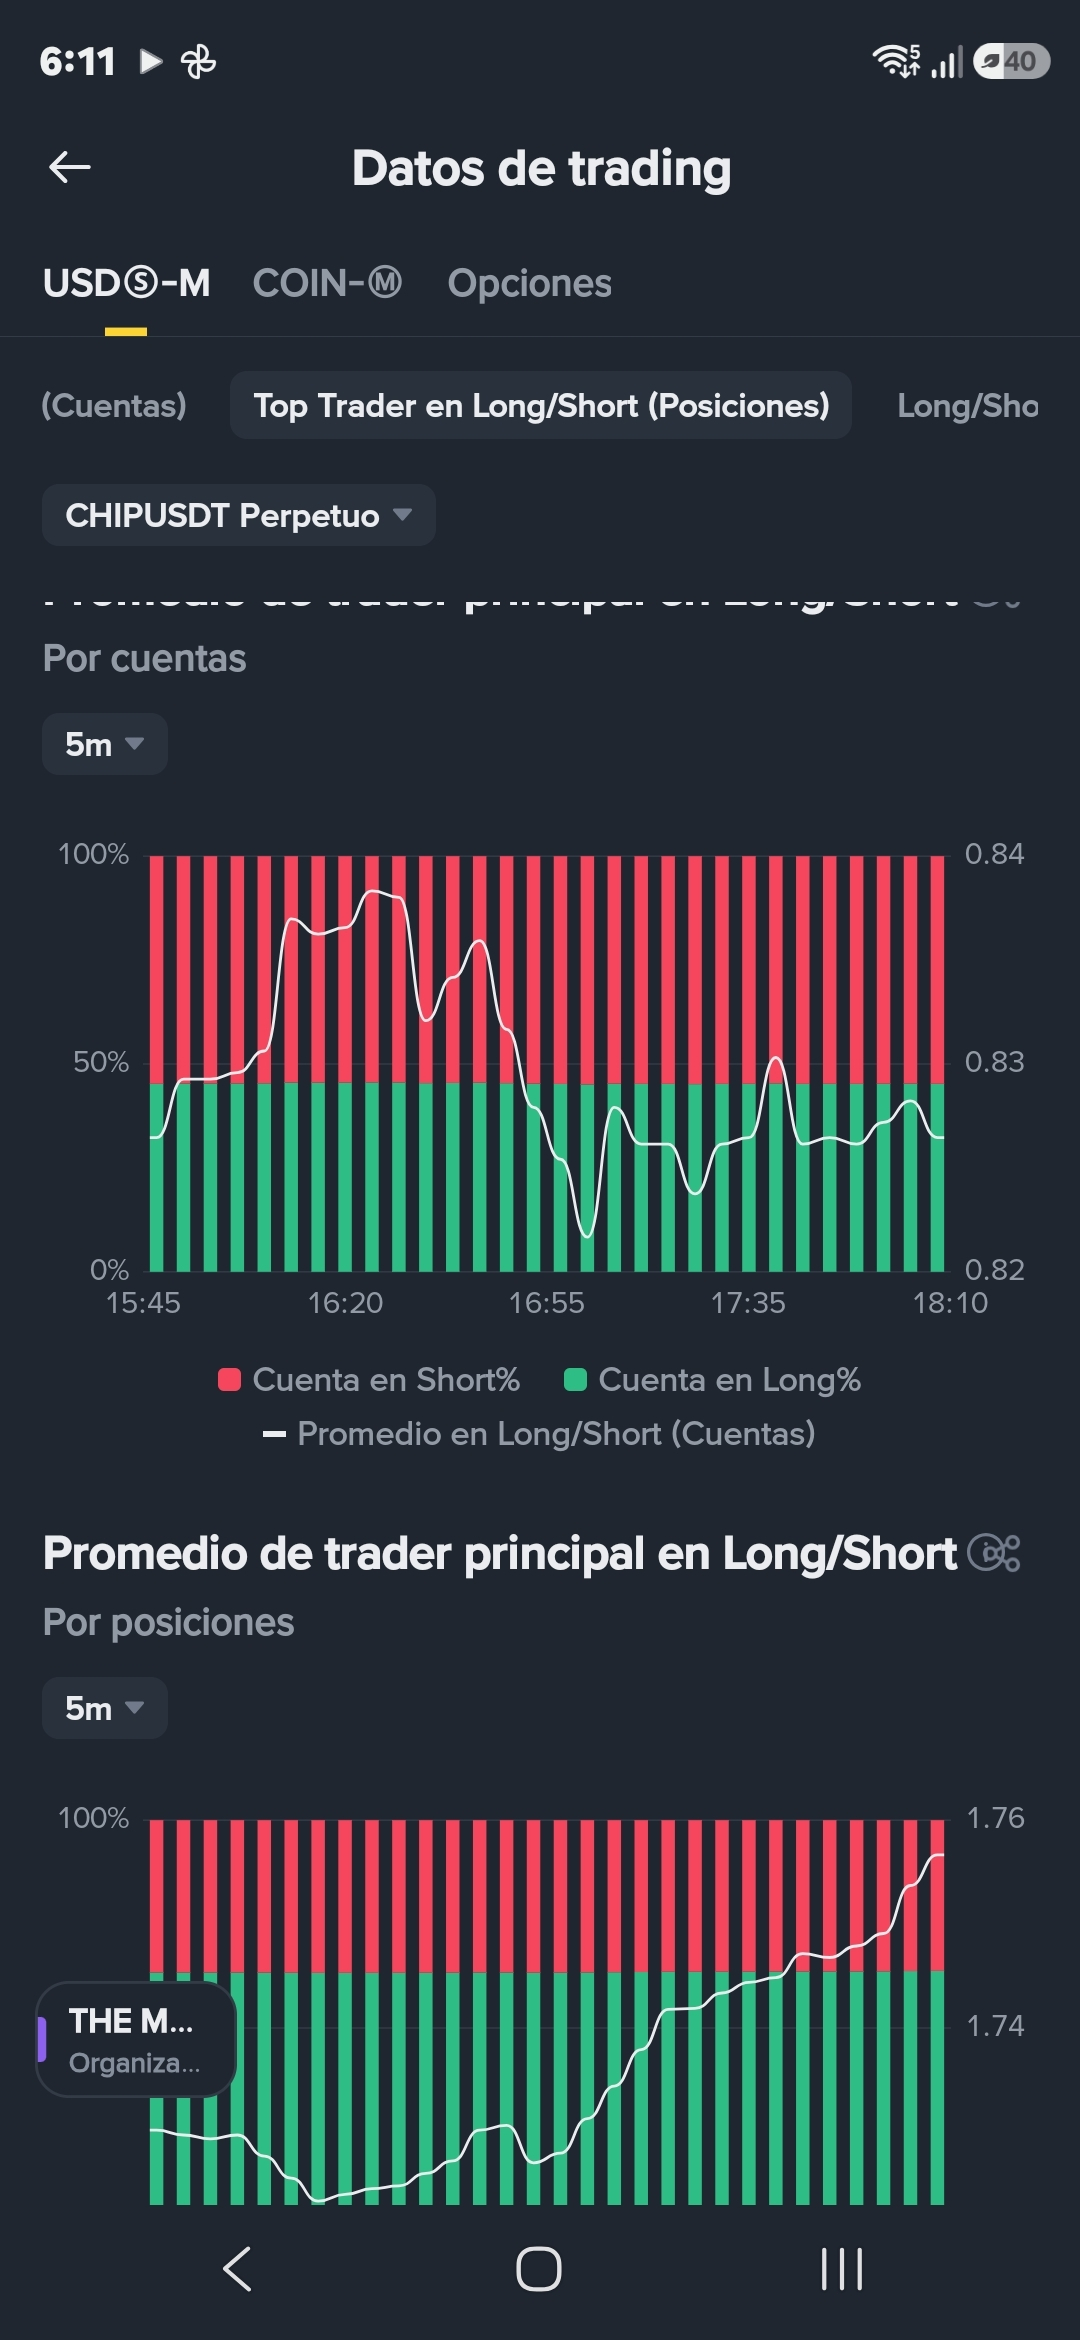 (Trading Data)
When reviewing the **Top Traders** data (accounts with the highest balance and volume) in the **image.png** chart, there is a key divergence between the *number of accounts* and the *size of the positions*. This is what’s really happening in the market:
### 🔍 X-ray of the Real Data:
* **By Accounts (Retail Sentiment of the Top Traders):** The upper chart shows that approximately **55% or 60% of the accounts are positioned in Short (red)** versus 40%-45% in Long (green). There are more individual traders betting on the decline.
* **By Positions (Real Money):** The lower chart reveals a completely opposite story. Even though there are fewer accounts in Long, **the volume of Long positions (green) comfortably dominates with more than 50%**. Whales or larger traders are holding mass buy orders.
* **The Rising Average Line:** The white line on the positions chart has been rising strongly from 16:55 to 18:10 (from 1.74 to almost 1.76). This means that **Long positions are getting bigger and heavier**, accumulating strength while the price or the local market attempts to push downward.
### 🔮 Possible Movement in 24 Hours:
* **Liquidation Squeeze Scenario (Bullish by Structure):** When most accounts open *Shorts*, but a few strong hands open *gigantic Longs*, the classic setup is a **Short Squeeze** (shorts sweep). If the price breaks upward, it will force that 55%-60% of Short accounts to close at a loss, acting like gasoline to push the price quickly higher over the next 24 hours.
* **Monitoring Zone:** While the average line by positions stays upward (near 1.76), the immediate bias is that of hidden buy-side accumulation.
#CHIPUSDT #CryptoTrading #Binance #ShortSqueeze #TopTraders #CryptoAnalysis #Altcoins #TradingData #WhaleAlert