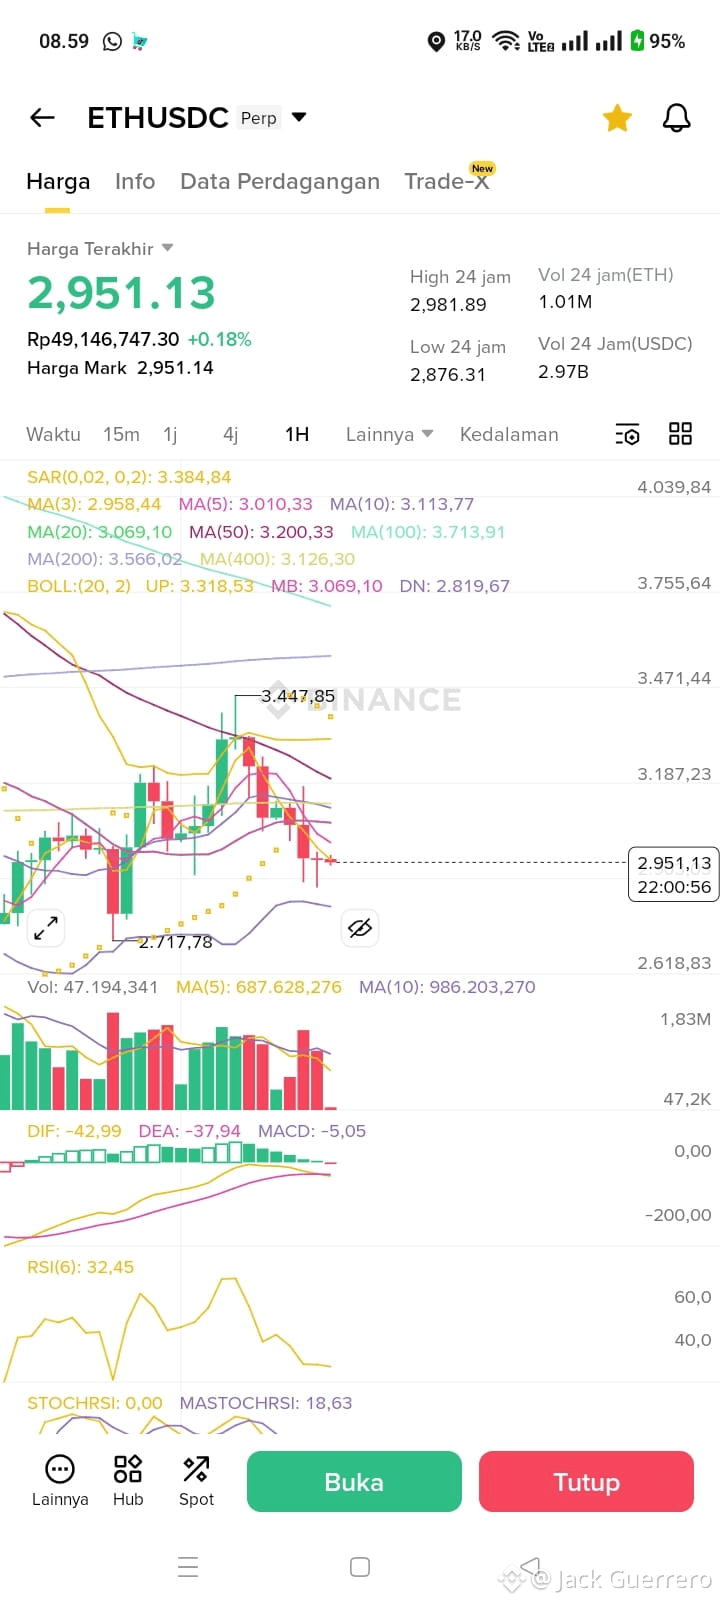
Analysis ETHUSDC – TF 1D (daily) $ETH
🔍 General Condition
Major trend: still correction / bearish pullback ETH is down again from the peak area ±3.447 and now at ±2.951. Structure still below important MA.
📉 Moving Average (MA)
Price < MA20, MA50, MA100 → daily trend sign is still bearish
MA tilted down → selling pressure is still dominant
MA200 far above → no major reversal sign yet
Note: As long as the daily candle has not closed above MA20 (~3.060), the bias is still weak
📊 Bollinger Bands
Price near lower band
Band starting to widen → volatility increasing
Note: This typically:
Technical bounce (relief bounce) could occur
But not a valid reversal yet, just oversold
📉 MACD
MACD < 0
Negative histogram & widening
Note: Bearish momentum is still strong, no golden cross yet
📈 RSI & Stoch RSI
RSI ≈ 32 → nearly oversold
Stoch RSI = 0 → extreme oversold
Note: This is a signal of potential short-term bounce, NOT a strong long-term buy signal
🔴 Parabolic SAR
SAR point above candle 👉 Daily trend is still down
📌 Important Area
Strong support:
2.880 – 2.820
If broken → next support 2.700
Nearest resistance:
3.060 (MA20 + mid BB)
3.200
3.450 (previous peak)
Trading Conclusion
🔴 Daily trend: still bearish
🟡 Short-term: potential small bounce
❌ Not safe to buy hold yet
Safe strategy:
Scalping / short-term buy only near support (2.880–2.820)
Quick TP, don’t be greedy
Cut loss is mandatory
#USNonFarmPayrollReport
#BinancehodlerSOMI
#ETH
🔍 General Condition
Major trend: still correction / bearish pullback ETH is down again from the peak area ±3.447 and now at ±2.951. Structure still below important MA.
📉 Moving Average (MA)
Price < MA20, MA50, MA100 → daily trend sign is still bearish
MA tilted down → selling pressure is still dominant
MA200 far above → no major reversal sign yet
Note: As long as the daily candle has not closed above MA20 (~3.060), the bias is still weak
📊 Bollinger Bands
Price near lower band
Band starting to widen → volatility increasing
Note: This typically:
Technical bounce (relief bounce) could occur
But not a valid reversal yet, just oversold
📉 MACD
MACD < 0
Negative histogram & widening
Note: Bearish momentum is still strong, no golden cross yet
📈 RSI & Stoch RSI
RSI ≈ 32 → nearly oversold
Stoch RSI = 0 → extreme oversold
Note: This is a signal of potential short-term bounce, NOT a strong long-term buy signal
🔴 Parabolic SAR
SAR point above candle 👉 Daily trend is still down
📌 Important Area
Strong support:
2.880 – 2.820
If broken → next support 2.700
Nearest resistance:
3.060 (MA20 + mid BB)
3.200
3.450 (previous peak)
Trading Conclusion
🔴 Daily trend: still bearish
🟡 Short-term: potential small bounce
❌ Not safe to buy hold yet
Safe strategy:
Scalping / short-term buy only near support (2.880–2.820)
Quick TP, don’t be greedy
Cut loss is mandatory
#USNonFarmPayrollReport
#BinancehodlerSOMI
#ETH