🔭$LUNC 🔥📈0.01
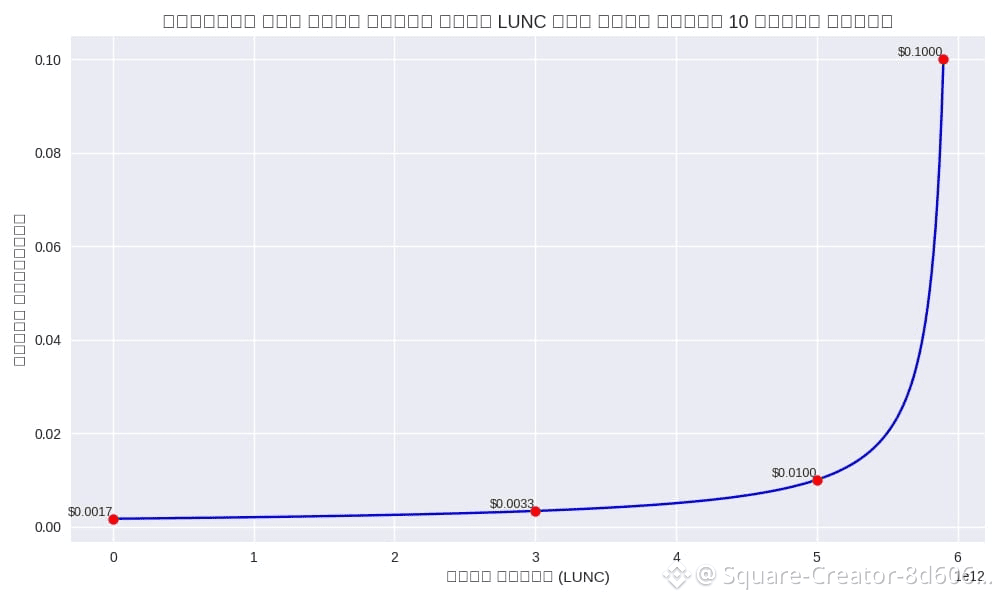
The chart 📈 shows the relationship between the burn amount 🔥 and the price of $LUNC at a fixed market cap of 10 billion dollars. The more tokens burned, the higher the price rises significantly, with key points at 📍 3 trillion, 📍 5 trillion, and 📍 5.9 trillion Lunc burned.
The chart 📈 shows the relationship between the burn amount 🔥 and the $lunc price at a fixed market cap of 10 billion dollars. The more tokens burned, the higher the price rises significantly, with key points at 📍 3 trillion, 📍 5 trillion, and 📍 5.9 trillion $LUNC burned.
🔎 Reading the chart
- With no burn (0): the price remains very low 🌡️ (less than $0.0001).
- At 🔥 3 trillion burned: the price rises 📤 to about $0.0033.
- At 🔥 5 trillion burned: the price reaches 📤 $0.01.
- At 🔥 5.9 trillion burned: the price approaches 📤 $0.1.
🧩 Conclusion
- To reach $0.1, the supply must drop to around 100 billion LUNC$, meaning a burn 🔥 of about 5.9 trillion.
- The chart 📈 clearly shows the inverse relationship ⛓️:
The lower the supply through burning the higher the price needed to achieve the same market cap.
The chart 📈 shows the relationship between the burn amount 🔥 and the price of $LUNC at a fixed market cap of 10 billion dollars. The more tokens burned, the higher the price rises significantly, with key points at 📍 3 trillion, 📍 5 trillion, and 📍 5.9 trillion Lunc burned.
The chart 📈 shows the relationship between the burn amount 🔥 and the $lunc price at a fixed market cap of 10 billion dollars. The more tokens burned, the higher the price rises significantly, with key points at 📍 3 trillion, 📍 5 trillion, and 📍 5.9 trillion $LUNC burned.
🔎 Reading the chart
- With no burn (0): the price remains very low 🌡️ (less than $0.0001).
- At 🔥 3 trillion burned: the price rises 📤 to about $0.0033.
- At 🔥 5 trillion burned: the price reaches 📤 $0.01.
- At 🔥 5.9 trillion burned: the price approaches 📤 $0.1.
🧩 Conclusion
- To reach $0.1, the supply must drop to around 100 billion LUNC$, meaning a burn 🔥 of about 5.9 trillion.
- The chart 📈 clearly shows the inverse relationship ⛓️:
The lower the supply through burning the higher the price needed to achieve the same market cap.