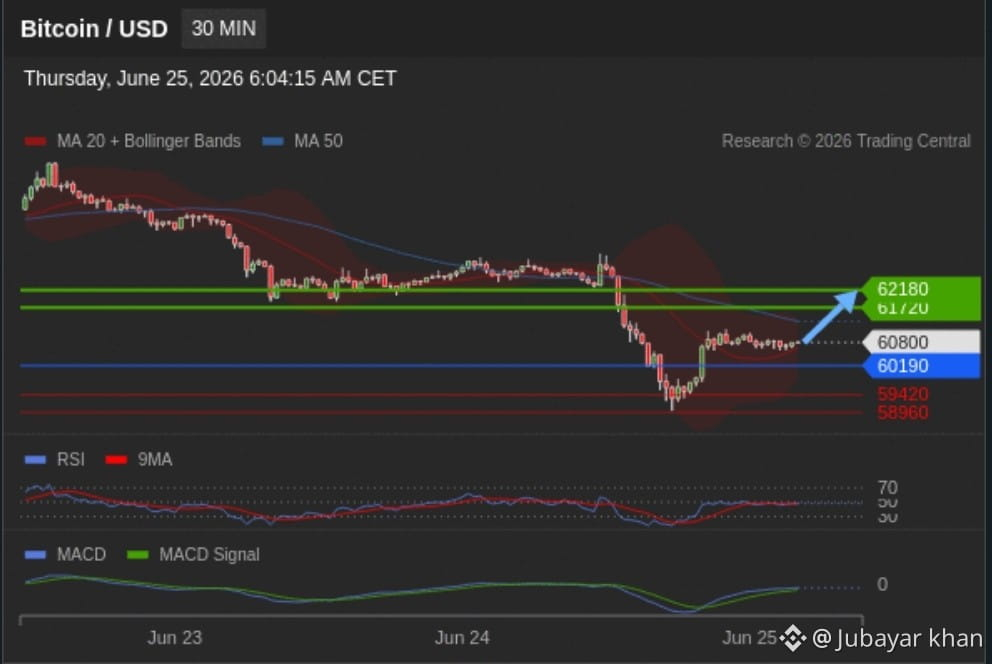
Bitcoin/Dollar (BTC/USD) Intraday Analysis
Trading View (Preferred Scenario)
Expecting a bounce in Bitcoin price targeting $62,180.
Key Levels
$62,640: Strong resistance
$62,180: Major resistance (bounce target)
$61,720: Short-term resistance
$60,800: Current price
$60,190: Key pivot point
$60,190: First support level
$59,420: Second support level
$58,960: Significant support level
Technical Indicator Analysis
The RSI is currently below 50, indicating weak market momentum.
Although the MACD is below the zero line, it has crossed above the signal line, suggesting a potential short-term bounce.
Overall, the technical landscape shows a tug-of-war between bulls and bears, with market direction not entirely clear.
The current price is above the 20-period moving average ($60,645), indicating a slight bullish trend in the short term.
However, the price remains below the 50-period moving average ($61,355), showing that the mid-term trend is still under pressure.
Alternative Scenario (Bearish Outlook)
If the price effectively breaks below the key support level of $60,190, further declines could follow to:
$59,420
$58,960
Thus, $60,190 is a crucial dividing line for the current market. Holding this level may push the price to continue bouncing towards $62,180; if it breaks below, we need to watch for further downside risks.
Bitcoin / Dollar intraday rebound towards 62180
Our Preference
Rebound towards 62180.
62640.0
Resistance...
62180.0
Resistance
61720.0
Resistance
60800.0
Last
60190.0
Pivot
60190.0
Support.
59420.0
Support..
58960.0 Support
Comment
The RSI is below its neutrality area at 50. The MACD is above its signal line and negative. The configuration is mixed. Moreover, the price stands above its 20-period moving average (60645) but below its 50-period moving average (61355).
Alternative Scenario
The downside breakout of 60190 would call for 59420 and 58960. #BTC走势分析
Trading View (Preferred Scenario)
Expecting a bounce in Bitcoin price targeting $62,180.
Key Levels
$62,640: Strong resistance
$62,180: Major resistance (bounce target)
$61,720: Short-term resistance
$60,800: Current price
$60,190: Key pivot point
$60,190: First support level
$59,420: Second support level
$58,960: Significant support level
Technical Indicator Analysis
The RSI is currently below 50, indicating weak market momentum.
Although the MACD is below the zero line, it has crossed above the signal line, suggesting a potential short-term bounce.
Overall, the technical landscape shows a tug-of-war between bulls and bears, with market direction not entirely clear.
The current price is above the 20-period moving average ($60,645), indicating a slight bullish trend in the short term.
However, the price remains below the 50-period moving average ($61,355), showing that the mid-term trend is still under pressure.
Alternative Scenario (Bearish Outlook)
If the price effectively breaks below the key support level of $60,190, further declines could follow to:
$59,420
$58,960
Thus, $60,190 is a crucial dividing line for the current market. Holding this level may push the price to continue bouncing towards $62,180; if it breaks below, we need to watch for further downside risks.
Bitcoin / Dollar intraday rebound towards 62180
Our Preference
Rebound towards 62180.
62640.0
Resistance...
62180.0
Resistance
61720.0
Resistance
60800.0
Last
60190.0
Pivot
60190.0
Support.
59420.0
Support..
58960.0 Support
Comment
The RSI is below its neutrality area at 50. The MACD is above its signal line and negative. The configuration is mixed. Moreover, the price stands above its 20-period moving average (60645) but below its 50-period moving average (61355).
Alternative Scenario
The downside breakout of 60190 would call for 59420 and 58960. #BTC走势分析