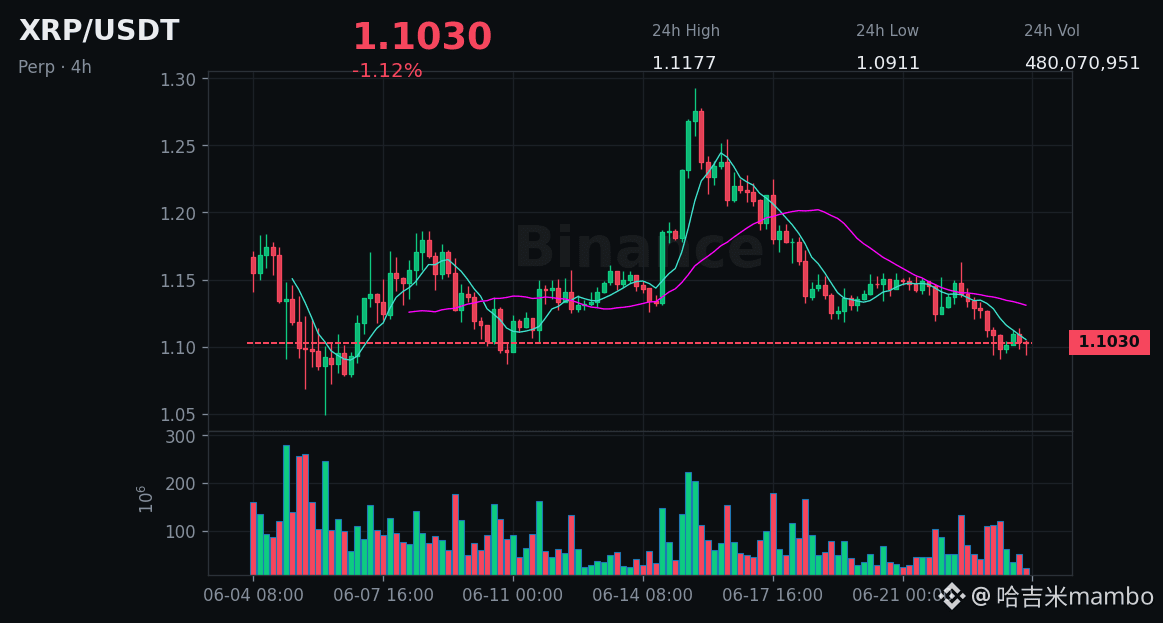
$XRP's chart is giving me serious vibes, and it’s not about how much it’s dropped but that the ETF is flooding in with 200 million, and May alone saw 132 million. Meanwhile, spot prices crashed from 1.36 to 1.10, down nearly 19%. Talk about a price-volume divergence? It's like institutions are catching falling knives on the left side while retail traders are getting wrecked on the right.
Don’t hit me with that Trump signed a quantum executive order and $XRP is ahead in quantum security. No matter how solid the news is, if the market isn’t buying it, it’s all for nothing. This 1.09 to 1.11 range has been grinding for three weeks with open interest not expanding, funding rates steady, and buy orders thinner than weekend morning liquidity. Check the on-chain data; there are no significant support wallets scooping up—this isn’t a shakeout; it’s a breather during distribution.
Where's the divergence? Bulls think 1.05-1.10 is a solid bottom, believing that institutional ETF inflows are a leading indicator, and they’re just waiting for $BTC to stabilize before rotating funds to pump it. Bears are eyeing a 20% drop over 30 days and shrinking volume, thinking the structure isn’t in place, with real accumulation zones below at 0.97 or even 0.90. Both sides have valid points, but who’s feeling the pain more? Bulls are holding onto unrealized losses, acting like they’re dead, while bears adding to their shorts around 1.10 aren’t raking in many points either, as the volatility is tightening.
Which side do I lean towards? At this point, whoever calls the bottom is just buying someone else's position. ETF inflows signal allocation interest but don’t guarantee that spot will pump immediately—historically, price-volume divergences can drag on for months. If 1.07 doesn’t hold, we’re looking down at 0.98-0.97, and then we’ll see if those shouting “buy the dip” are still laughing.
$XRP
#价量背离 #机构ETF #XRP chart analysis
Don’t hit me with that Trump signed a quantum executive order and $XRP is ahead in quantum security. No matter how solid the news is, if the market isn’t buying it, it’s all for nothing. This 1.09 to 1.11 range has been grinding for three weeks with open interest not expanding, funding rates steady, and buy orders thinner than weekend morning liquidity. Check the on-chain data; there are no significant support wallets scooping up—this isn’t a shakeout; it’s a breather during distribution.
Where's the divergence? Bulls think 1.05-1.10 is a solid bottom, believing that institutional ETF inflows are a leading indicator, and they’re just waiting for $BTC to stabilize before rotating funds to pump it. Bears are eyeing a 20% drop over 30 days and shrinking volume, thinking the structure isn’t in place, with real accumulation zones below at 0.97 or even 0.90. Both sides have valid points, but who’s feeling the pain more? Bulls are holding onto unrealized losses, acting like they’re dead, while bears adding to their shorts around 1.10 aren’t raking in many points either, as the volatility is tightening.
Which side do I lean towards? At this point, whoever calls the bottom is just buying someone else's position. ETF inflows signal allocation interest but don’t guarantee that spot will pump immediately—historically, price-volume divergences can drag on for months. If 1.07 doesn’t hold, we’re looking down at 0.98-0.97, and then we’ll see if those shouting “buy the dip” are still laughing.
$XRP
#价量背离 #机构ETF #XRP chart analysis