AVNT Shows Strong Bullish Momentum After Breaking Daily High
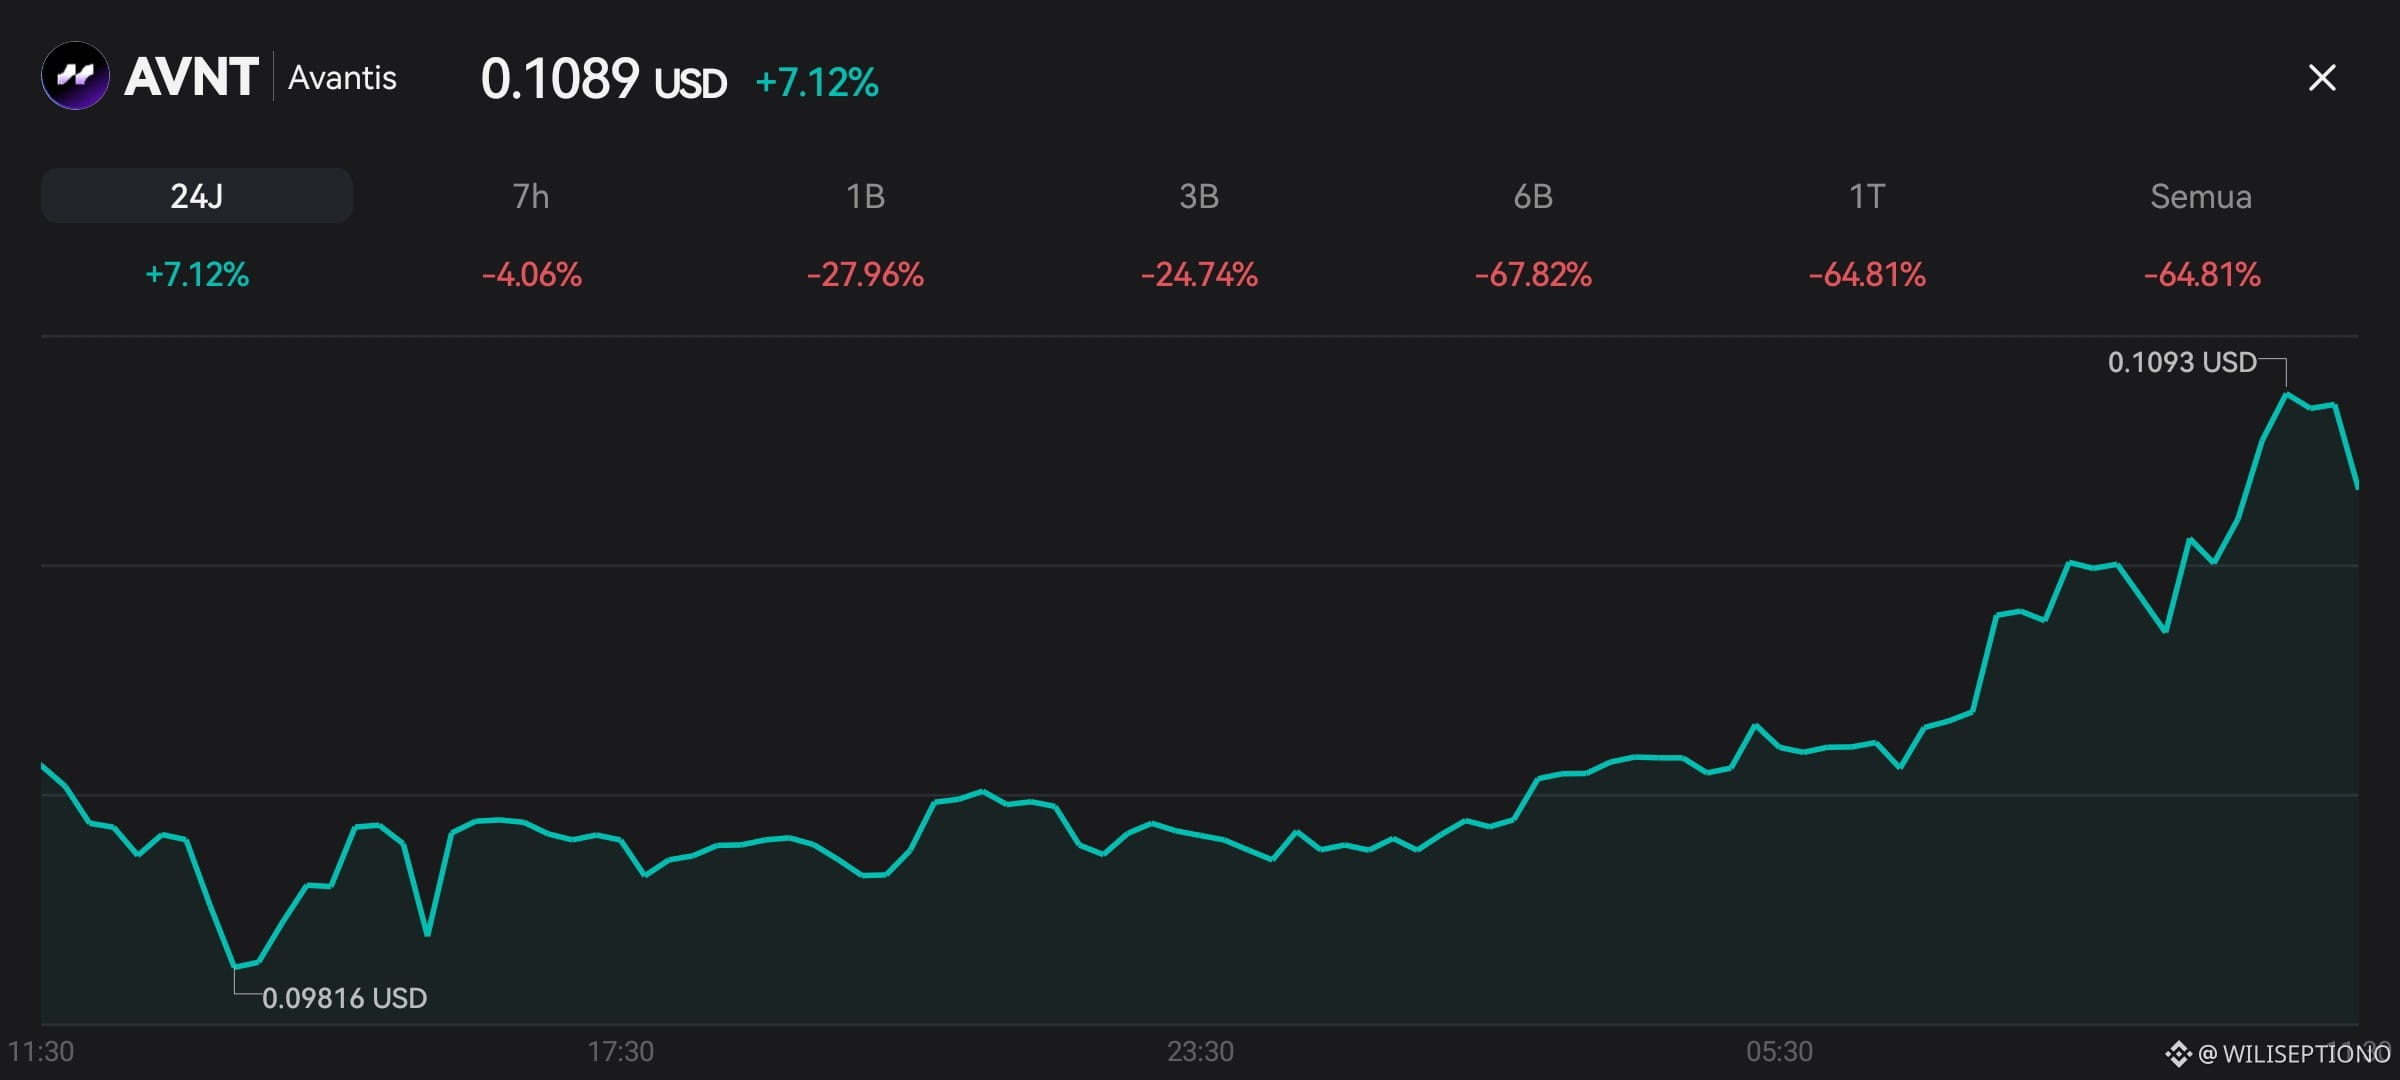
Avantis ($AVNT ) is currently trading around $0.1089, up 7.12% in the last 24 hours, making it one of the top-performing assets among several recently analyzed tokens. After finding solid support around $0.0982, buying pressure has been steadily increasing throughout the trading session, ultimately pushing the price through resistance and setting a new daily high around $0.1093. This movement indicates rising market confidence as well as the potential for continued short-term recovery trend.
Although today's rise looks very positive, the medium to long-term trend is still in a recovery phase following a lengthy bearish pressure. AVNT has recorded a drop of 27.96% over the last month and 67.82% over the past six months. The nearest support area is around $0.1050–$0.1070, while the key resistance is in the $0.1095–$0.1120 range. If the price can break and hold above $0.1120, the chances for further upside will open up, potentially attracting more buyers. Conversely, if the price drops back below $0.1050, short-term profit-taking may pressure the price movement.
📈 24 Hours: +7.12%
📉 7 Days: -4.06%
📉 1 Month: -27.96%
📉 3 Months: -24.74%
📉 6 Months: -67.82%
📉 1 Year: -64.81%
📉 Since ATH: -64.81%
Avantis ($AVNT ) is currently trading around $0.1089, up 7.12% in the last 24 hours, making it one of the top-performing assets among several recently analyzed tokens. After finding solid support around $0.0982, buying pressure has been steadily increasing throughout the trading session, ultimately pushing the price through resistance and setting a new daily high around $0.1093. This movement indicates rising market confidence as well as the potential for continued short-term recovery trend.
Although today's rise looks very positive, the medium to long-term trend is still in a recovery phase following a lengthy bearish pressure. AVNT has recorded a drop of 27.96% over the last month and 67.82% over the past six months. The nearest support area is around $0.1050–$0.1070, while the key resistance is in the $0.1095–$0.1120 range. If the price can break and hold above $0.1120, the chances for further upside will open up, potentially attracting more buyers. Conversely, if the price drops back below $0.1050, short-term profit-taking may pressure the price movement.
📈 24 Hours: +7.12%
📉 7 Days: -4.06%
📉 1 Month: -27.96%
📉 3 Months: -24.74%
📉 6 Months: -67.82%
📉 1 Year: -64.81%
📉 Since ATH: -64.81%