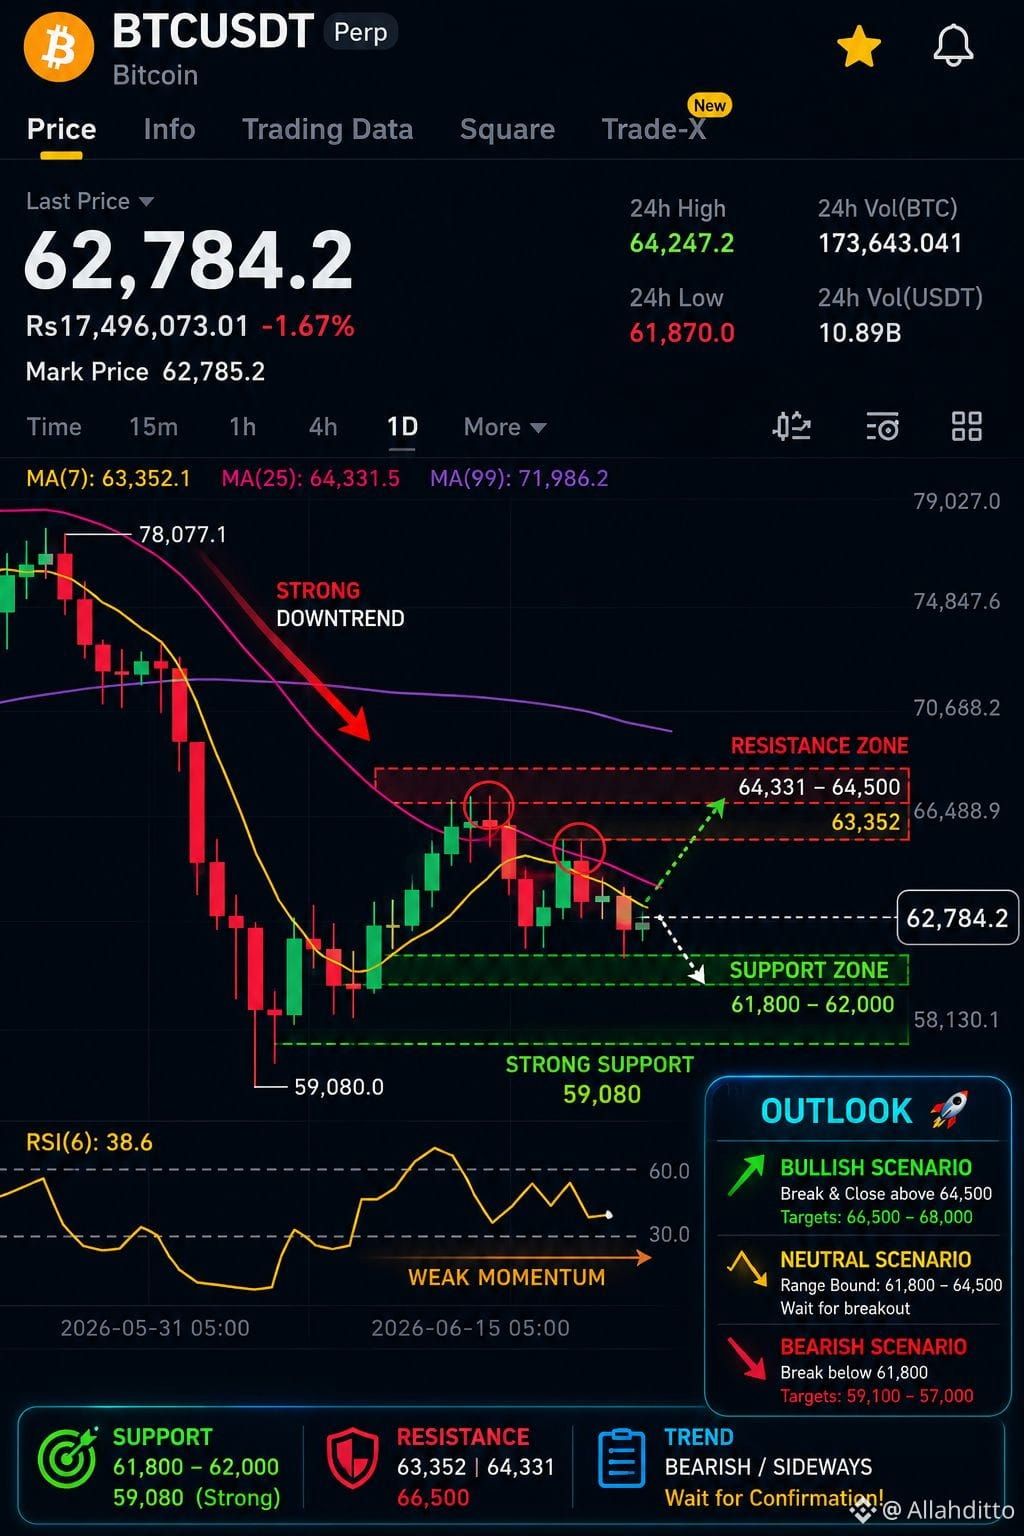
#BTC_MarketPanic_Dip BTCUSDT (1D) Chart Analysis 📉 Trend: Bearish/Sideways
🟢 Support: 61.8K | 59K
🔴 Resistance: 63.35K | 64.3K | 66.5K
⚠️ Wait for a confirmed breakout or breakdown before taking high-risk positions.
Based on the chart you shared:
Trend: Bearish to neutral. Price is trading below the MA(7), MA(25), and MA(99), showing that sellers still have the overall advantage.
Current Price: 62,784
RSI (6): 38.6, indicating weak momentum but not yet deeply oversold.
Key Support
61,800–62,000 – Immediate support.
59,000–59,100 – Strong daily support. A break below this could trigger further downside.
Key Resistance
63,350 – First resistance (MA7).
64,300–64,500 – Major resistance (MA25).
66,500 – Strong breakout level. A daily close above this could shift momentum bullish.
Outlook
Bitcoin is currently consolidating after a strong decline. As long as it stays above 61.8K, a recovery toward 64K–66.5K is possible. However, losing 61.8K could open the door for another test of 59K.
Summary:
🟢 Support: 61.8K | 59K
🔴 Resistance: 63.35K | 64.3K | 66.5K
⚠️ Wait for a confirmed breakout or breakdown before taking high-risk positions.
Based on the chart you shared:
Trend: Bearish to neutral. Price is trading below the MA(7), MA(25), and MA(99), showing that sellers still have the overall advantage.
Current Price: 62,784
RSI (6): 38.6, indicating weak momentum but not yet deeply oversold.
Key Support
61,800–62,000 – Immediate support.
59,000–59,100 – Strong daily support. A break below this could trigger further downside.
Key Resistance
63,350 – First resistance (MA7).
64,300–64,500 – Major resistance (MA25).
66,500 – Strong breakout level. A daily close above this could shift momentum bullish.
Outlook
Bitcoin is currently consolidating after a strong decline. As long as it stays above 61.8K, a recovery toward 64K–66.5K is possible. However, losing 61.8K could open the door for another test of 59K.
Summary: