
赚币养家啊i
124 Posts

赚币养家啊i
就一点U,玩完就走。没有群,不跟单。每天没事时候发一丢丢看法。8折手续费推荐码YUYU128
Frequent Trader
2.5 Years
11 Following
2.6K+ Followers
8.8K+ Liked
Posts
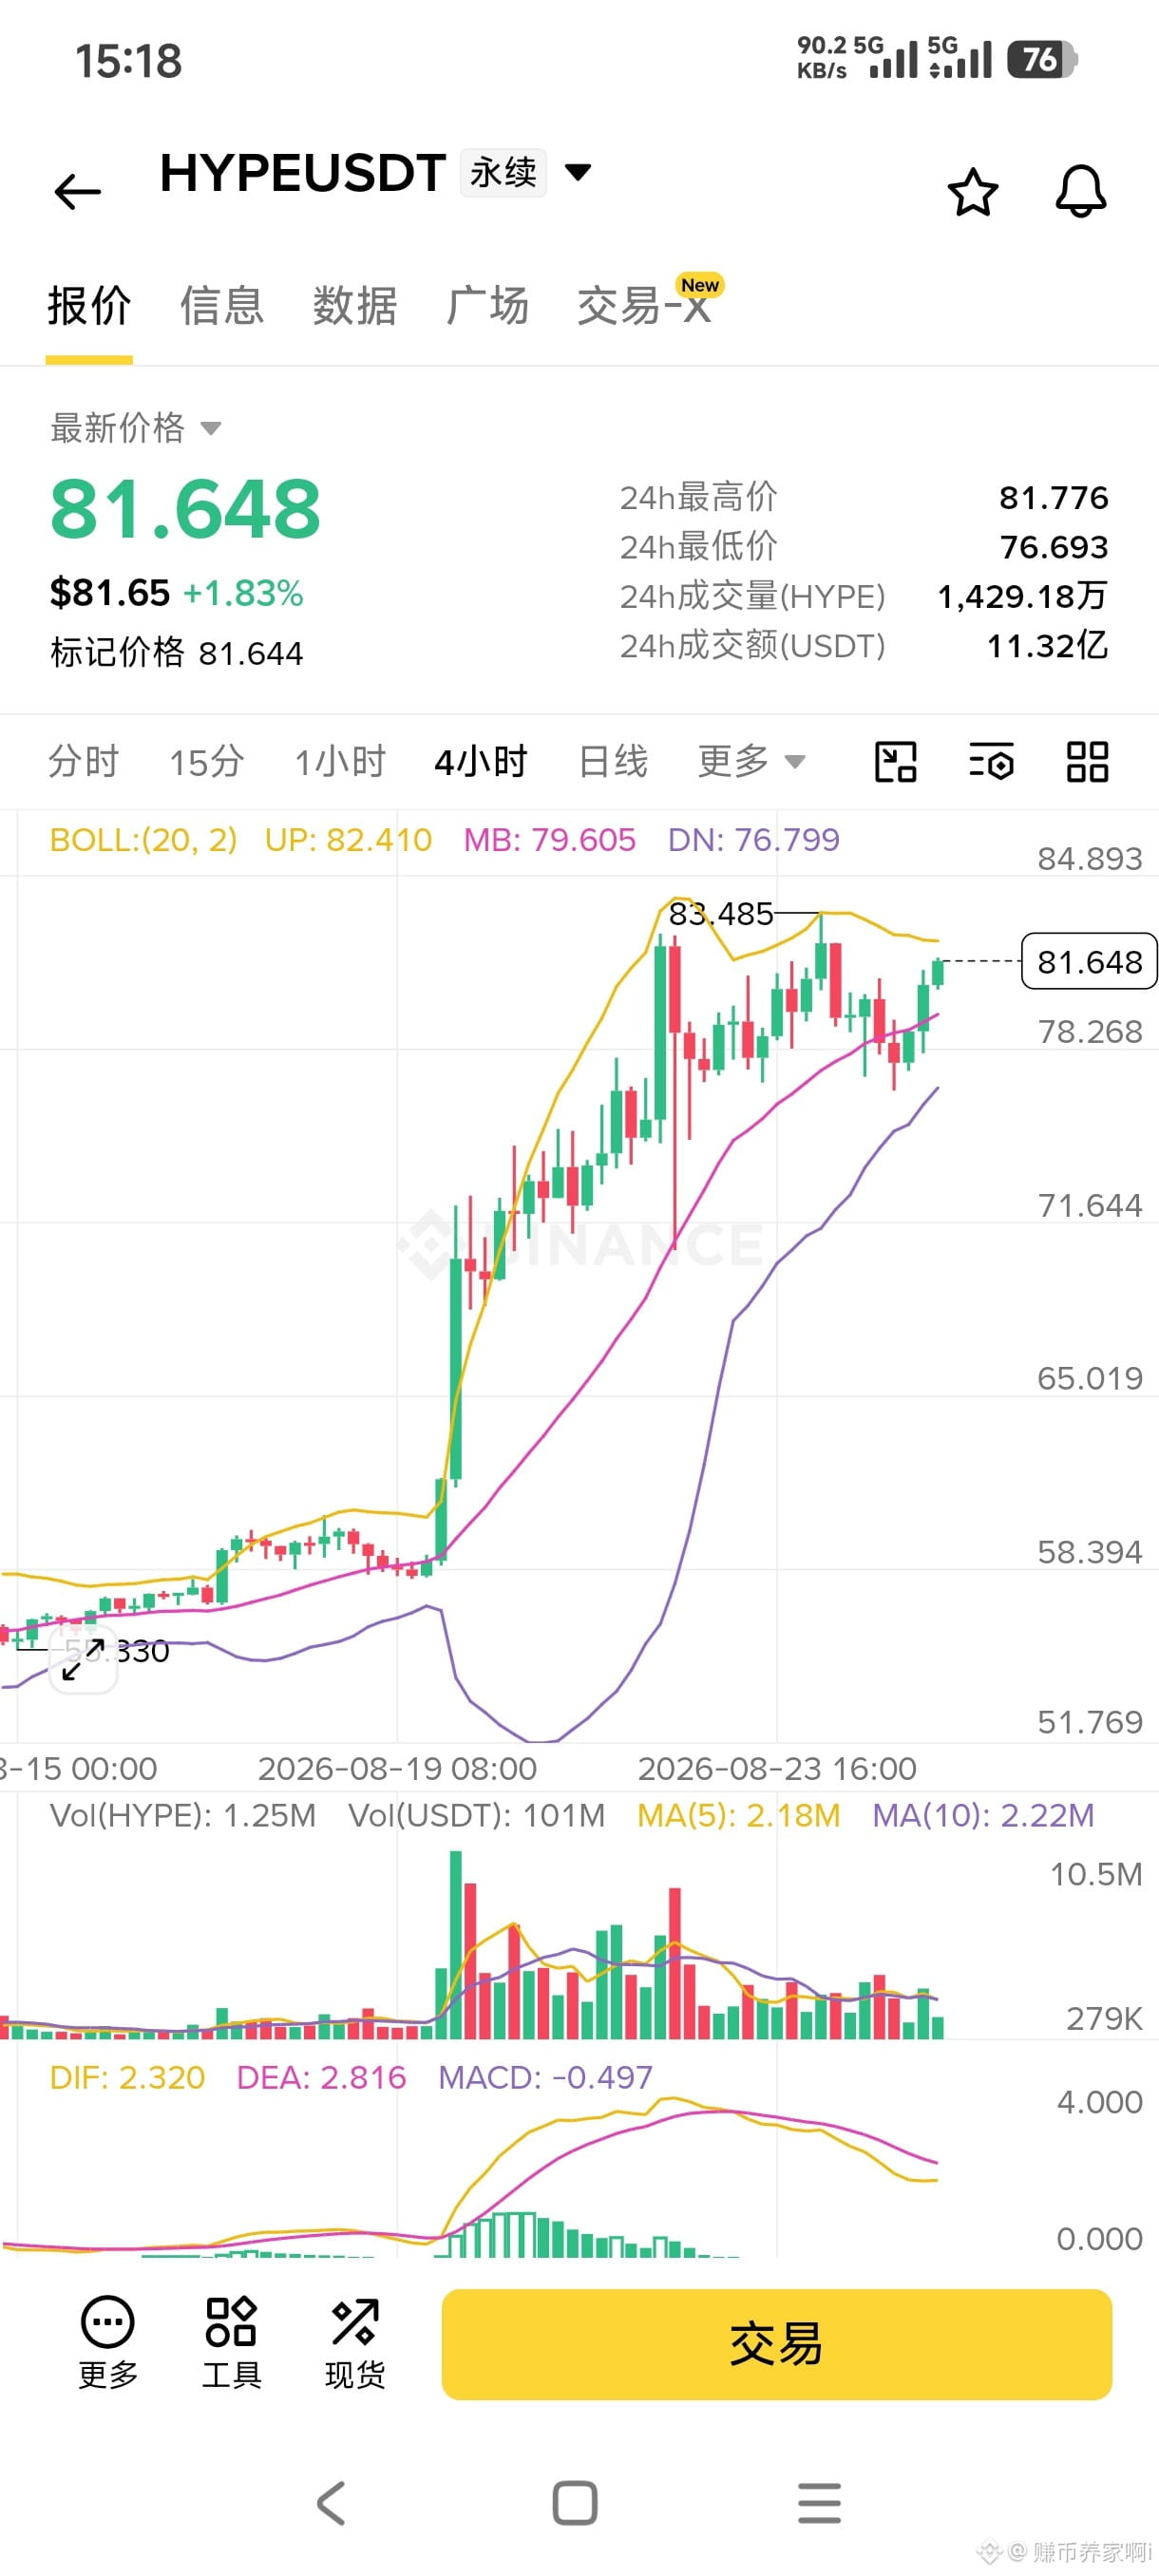
Go long towards $HYPE
Leverage: 2–3x
Entry range: Pullback to around 79–80 to participate
Stop loss: 75.4
First target: Break the previous high near 83.48; if it successfully breaks through, look for more upside. Reduce positions in batches near the resistance level.
Trading tips:
1、This is a high-volatility, high-scramble coin—never chase a big pump;
2、If it doesn’t pull back and instead spikes higher, give up the entry opportunity;
3、The stop loss must be placed—don’t hold a losing position.
Leverage: 2–3x
Entry range: Pullback to around 79–80 to participate
Stop loss: 75.4
First target: Break the previous high near 83.48; if it successfully breaks through, look for more upside. Reduce positions in batches near the resistance level.
Trading tips:
1、This is a high-volatility, high-scramble coin—never chase a big pump;
2、If it doesn’t pull back and instead spikes higher, give up the entry opportunity;
3、The stop loss must be placed—don’t hold a losing position.
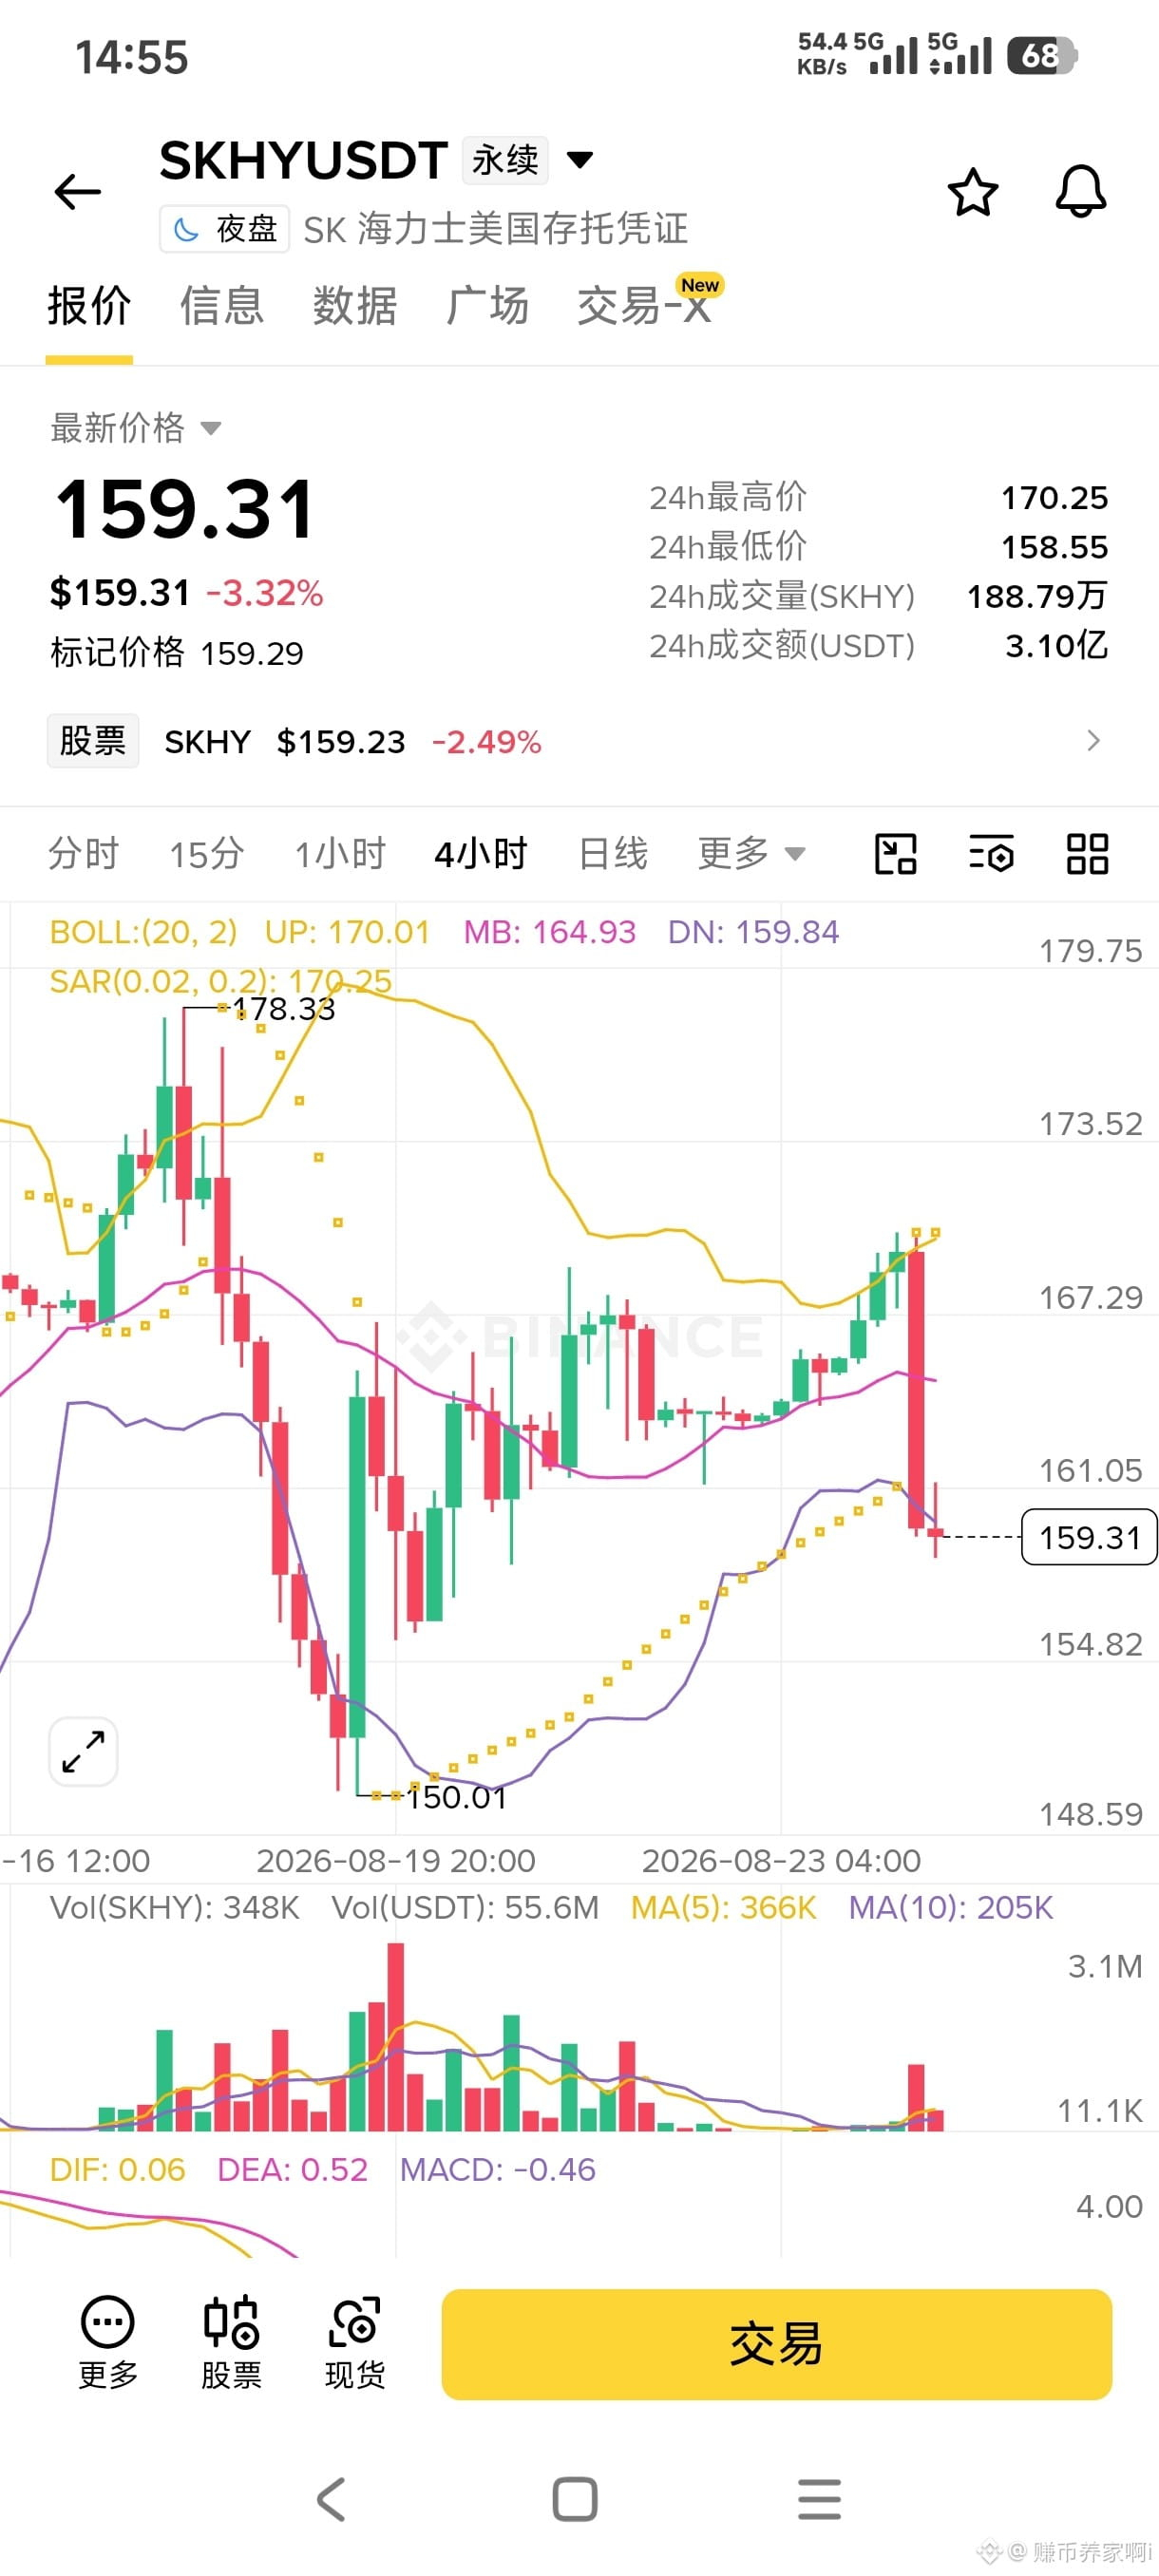
$SKHY SKHY After a rebound wave, it immediately turns into a sharp drop, and the short-term trend directly weakens.
The 167–170 area above has now become resistance, while 159 is the key support right now.
The focus is whether 159 can hold up—if it can’t, the price will likely keep moving lower; if it can be defended, there’s a chance the market can resume range trading and repair.
After such a big bearish candle, don’t rush into the market—first observe whether the support can stabilize.
The 167–170 area above has now become resistance, while 159 is the key support right now.
The focus is whether 159 can hold up—if it can’t, the price will likely keep moving lower; if it can be defended, there’s a chance the market can resume range trading and repair.
After such a big bearish candle, don’t rush into the market—first observe whether the support can stabilize.
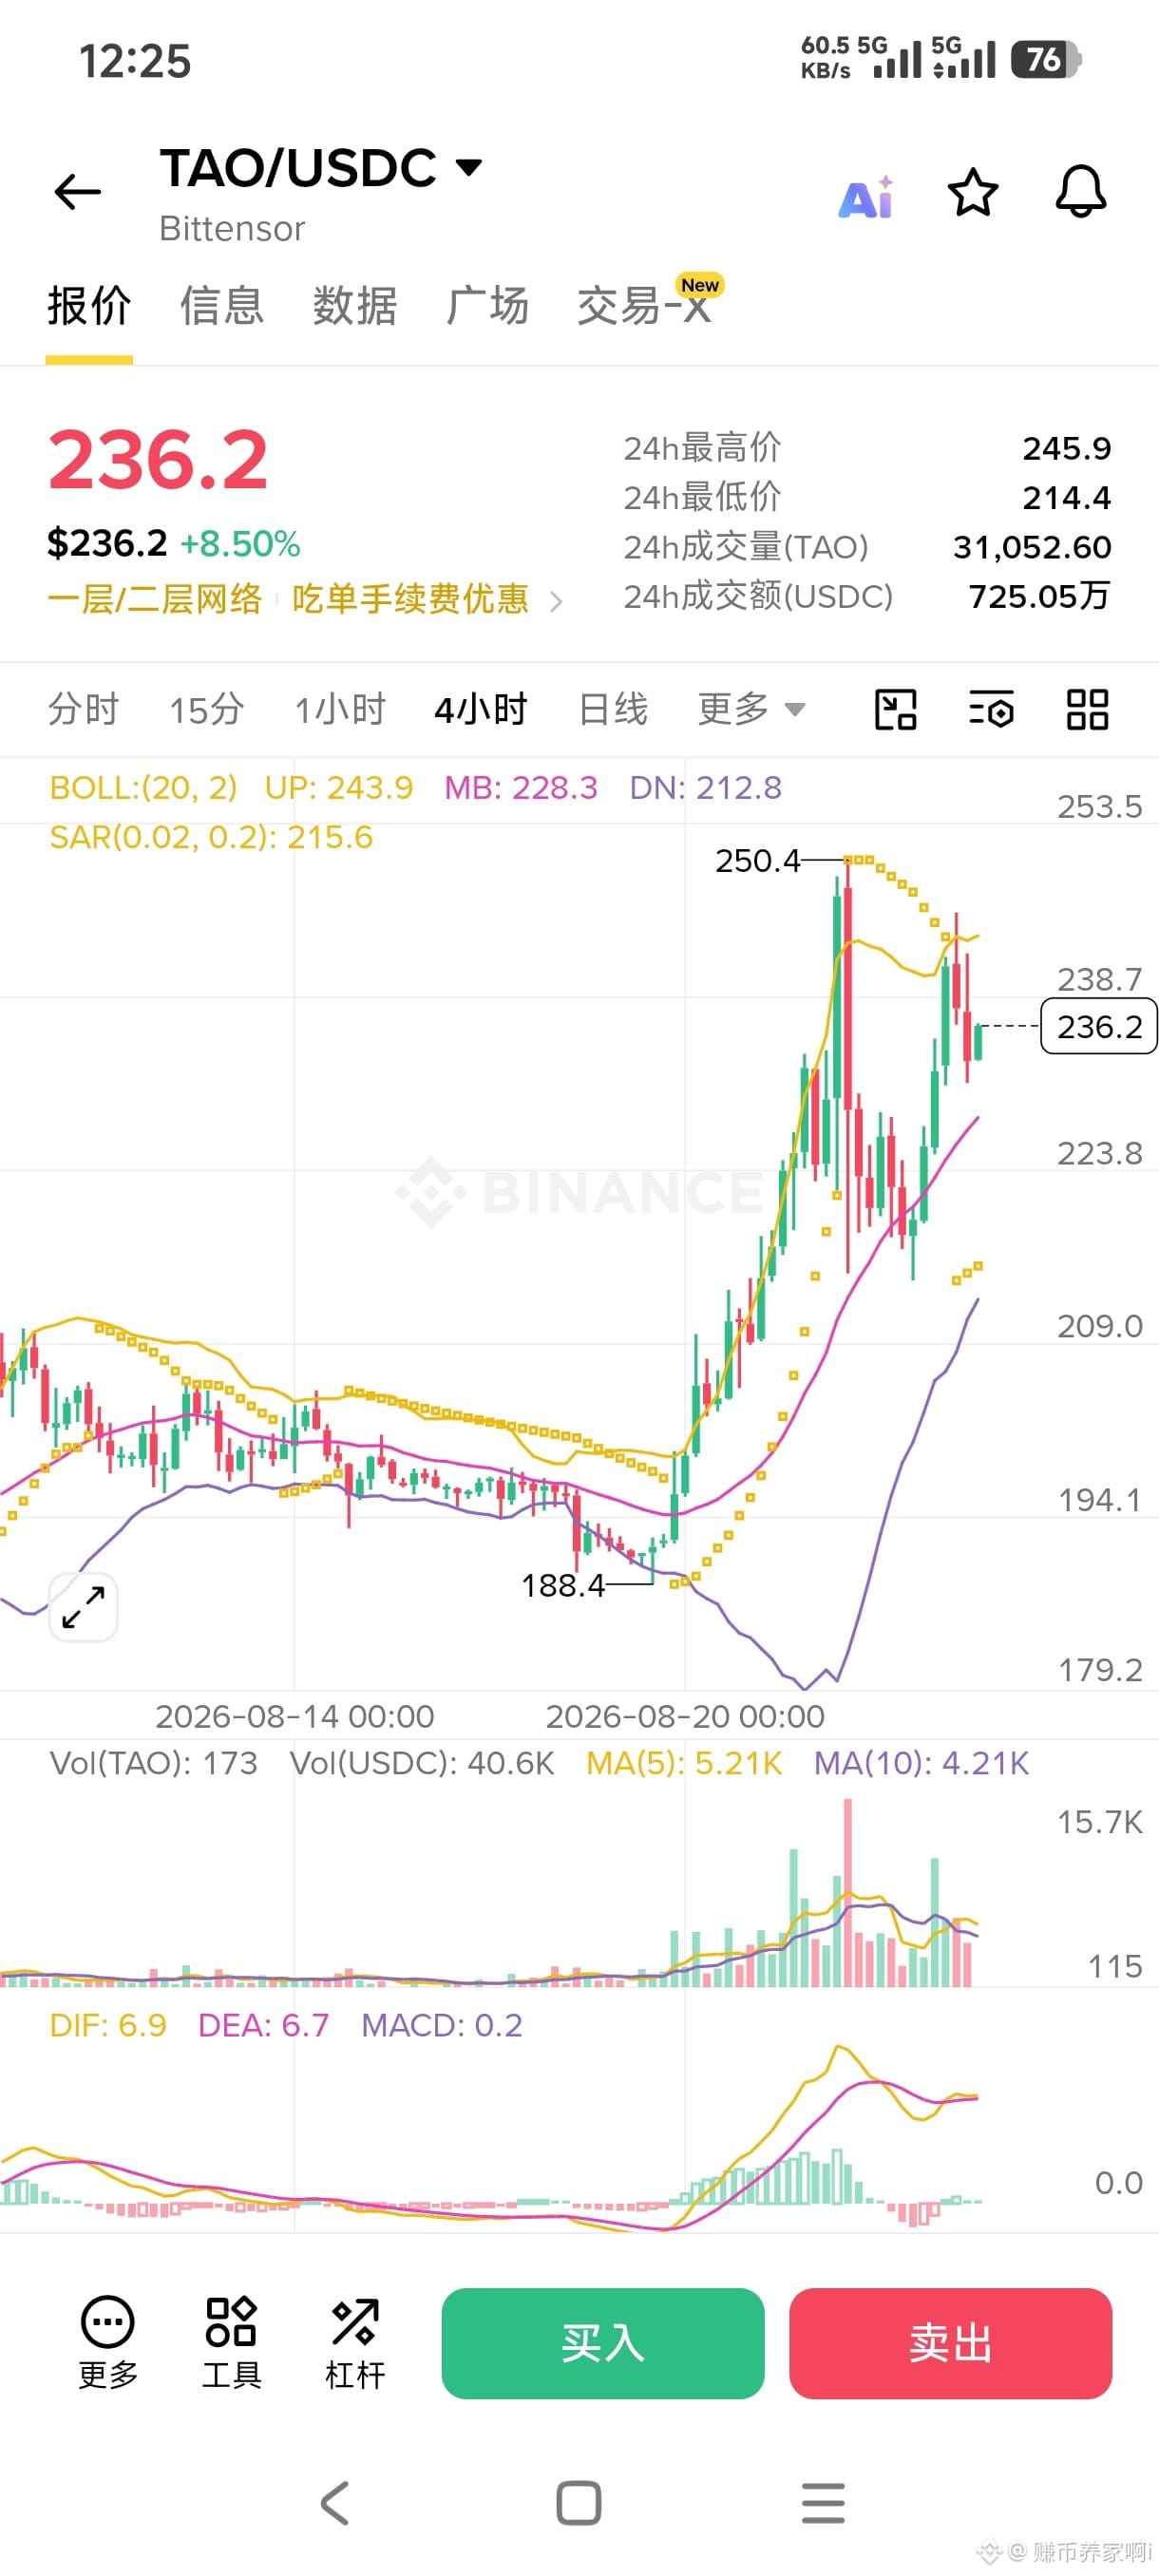
$TAO TAO After this move, it’s clearly unable to push higher anymore. Now it’s just grinding back and forth in the high range.
Focus on the pressure around 243–244 above. 228 below is a very key level.
Whether the market can keep strengthening depends on whether 228 can hold up. If it holds, there’s still a chance to push toward the previous high again. If it directly breaks down through, then in the short term this strong momentum will be gone and it will enter a pullback phase. After a big rally, don’t just chase upward immediately—wait for the market to pull back and then reassess.
Focus on the pressure around 243–244 above. 228 below is a very key level.
Whether the market can keep strengthening depends on whether 228 can hold up. If it holds, there’s still a chance to push toward the previous high again. If it directly breaks down through, then in the short term this strong momentum will be gone and it will enter a pullback phase. After a big rally, don’t just chase upward immediately—wait for the market to pull back and then reassess.
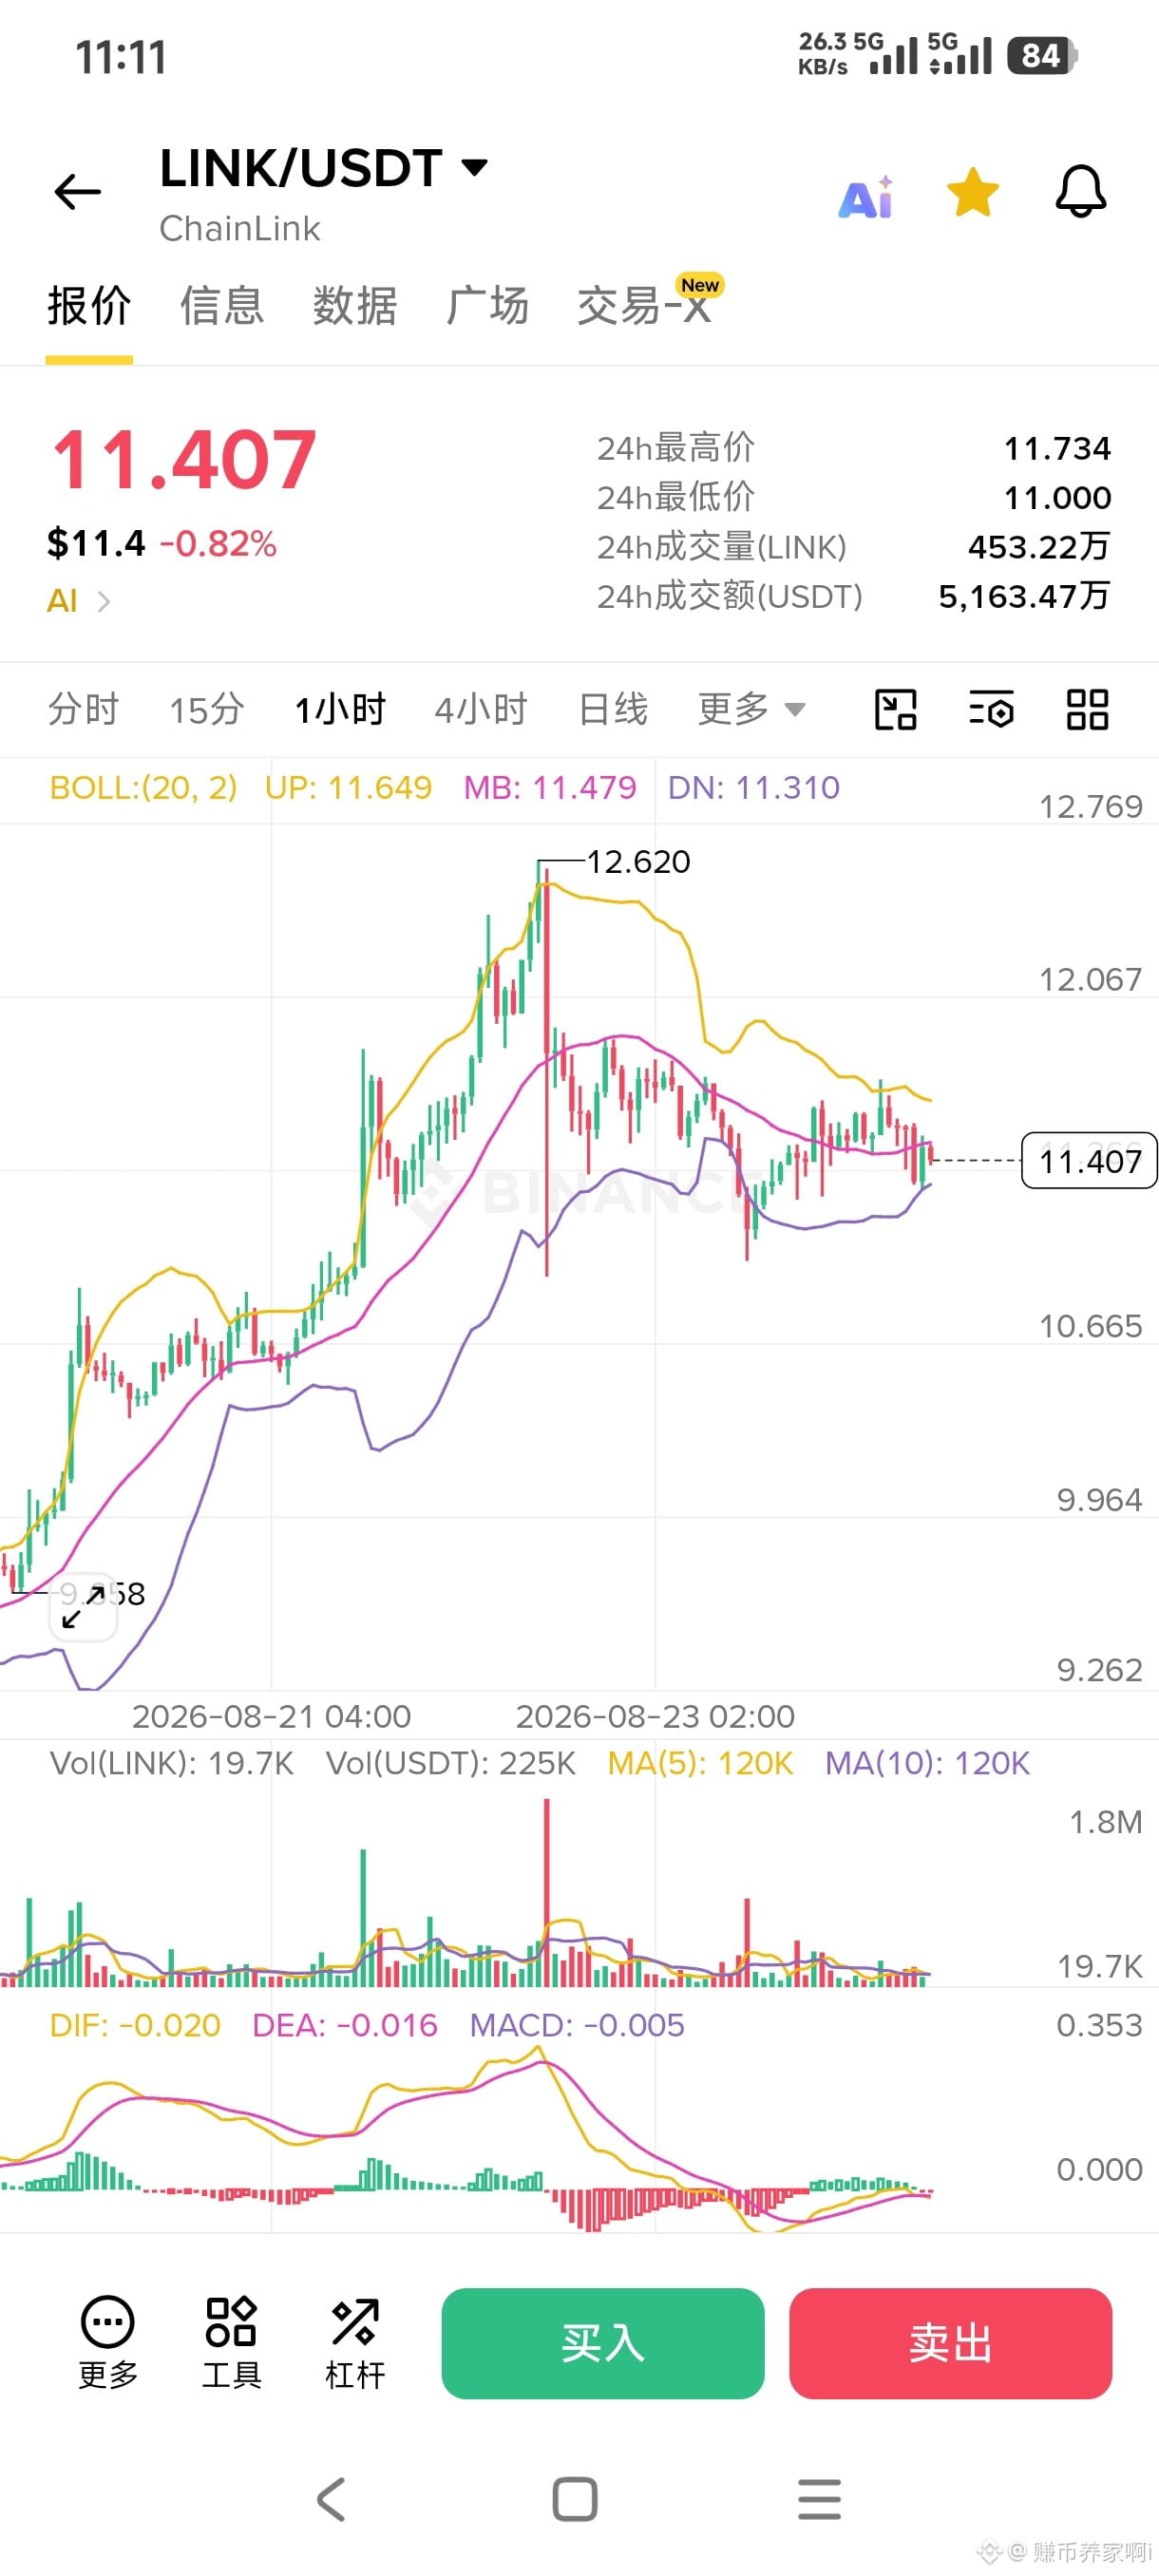
$LINK LINK price trend recap
After the previous surge to 12.62, bullish momentum quickly weakened and the price pulled back into a sideways range-bound consolidation.
Previously, the upper Bollinger Band acted as a strong resistance level. Once price touched it, clear selling pressure appeared. During the pullback, the lower Bollinger Band around 11.31 was tested multiple times and repeatedly held the price, becoming the bottom of the short-term box range.
The MACD has gradually declined from its high point toward the zero axis, and the market has shifted into a balance between bulls and bears—no longer a one-way uptrend.
Key resistance is at 11.64 above, and key support is at 11.31 below.
The failure to hold the higher level after the push up indicates that resistance overhead is heavy; however, the downside support was tested repeatedly without being broken, confirming the range-trading pattern.
If the price later breaks upward through 11.64, it will have a chance to challenge the previous high again. If it breaks below 11.31, the box range will become invalid and the price may seek further lows to the downside.
After the previous surge to 12.62, bullish momentum quickly weakened and the price pulled back into a sideways range-bound consolidation.
Previously, the upper Bollinger Band acted as a strong resistance level. Once price touched it, clear selling pressure appeared. During the pullback, the lower Bollinger Band around 11.31 was tested multiple times and repeatedly held the price, becoming the bottom of the short-term box range.
The MACD has gradually declined from its high point toward the zero axis, and the market has shifted into a balance between bulls and bears—no longer a one-way uptrend.
Key resistance is at 11.64 above, and key support is at 11.31 below.
The failure to hold the higher level after the push up indicates that resistance overhead is heavy; however, the downside support was tested repeatedly without being broken, confirming the range-trading pattern.
If the price later breaks upward through 11.64, it will have a chance to challenge the previous high again. If it breaks below 11.31, the box range will become invalid and the price may seek further lows to the downside.
$BCH BCH complete trading plan
Direction: short-term pullback and dip-buy for long
Entry range: 272-274
Stop loss: 264
First take profit: 286
Second take profit: 298
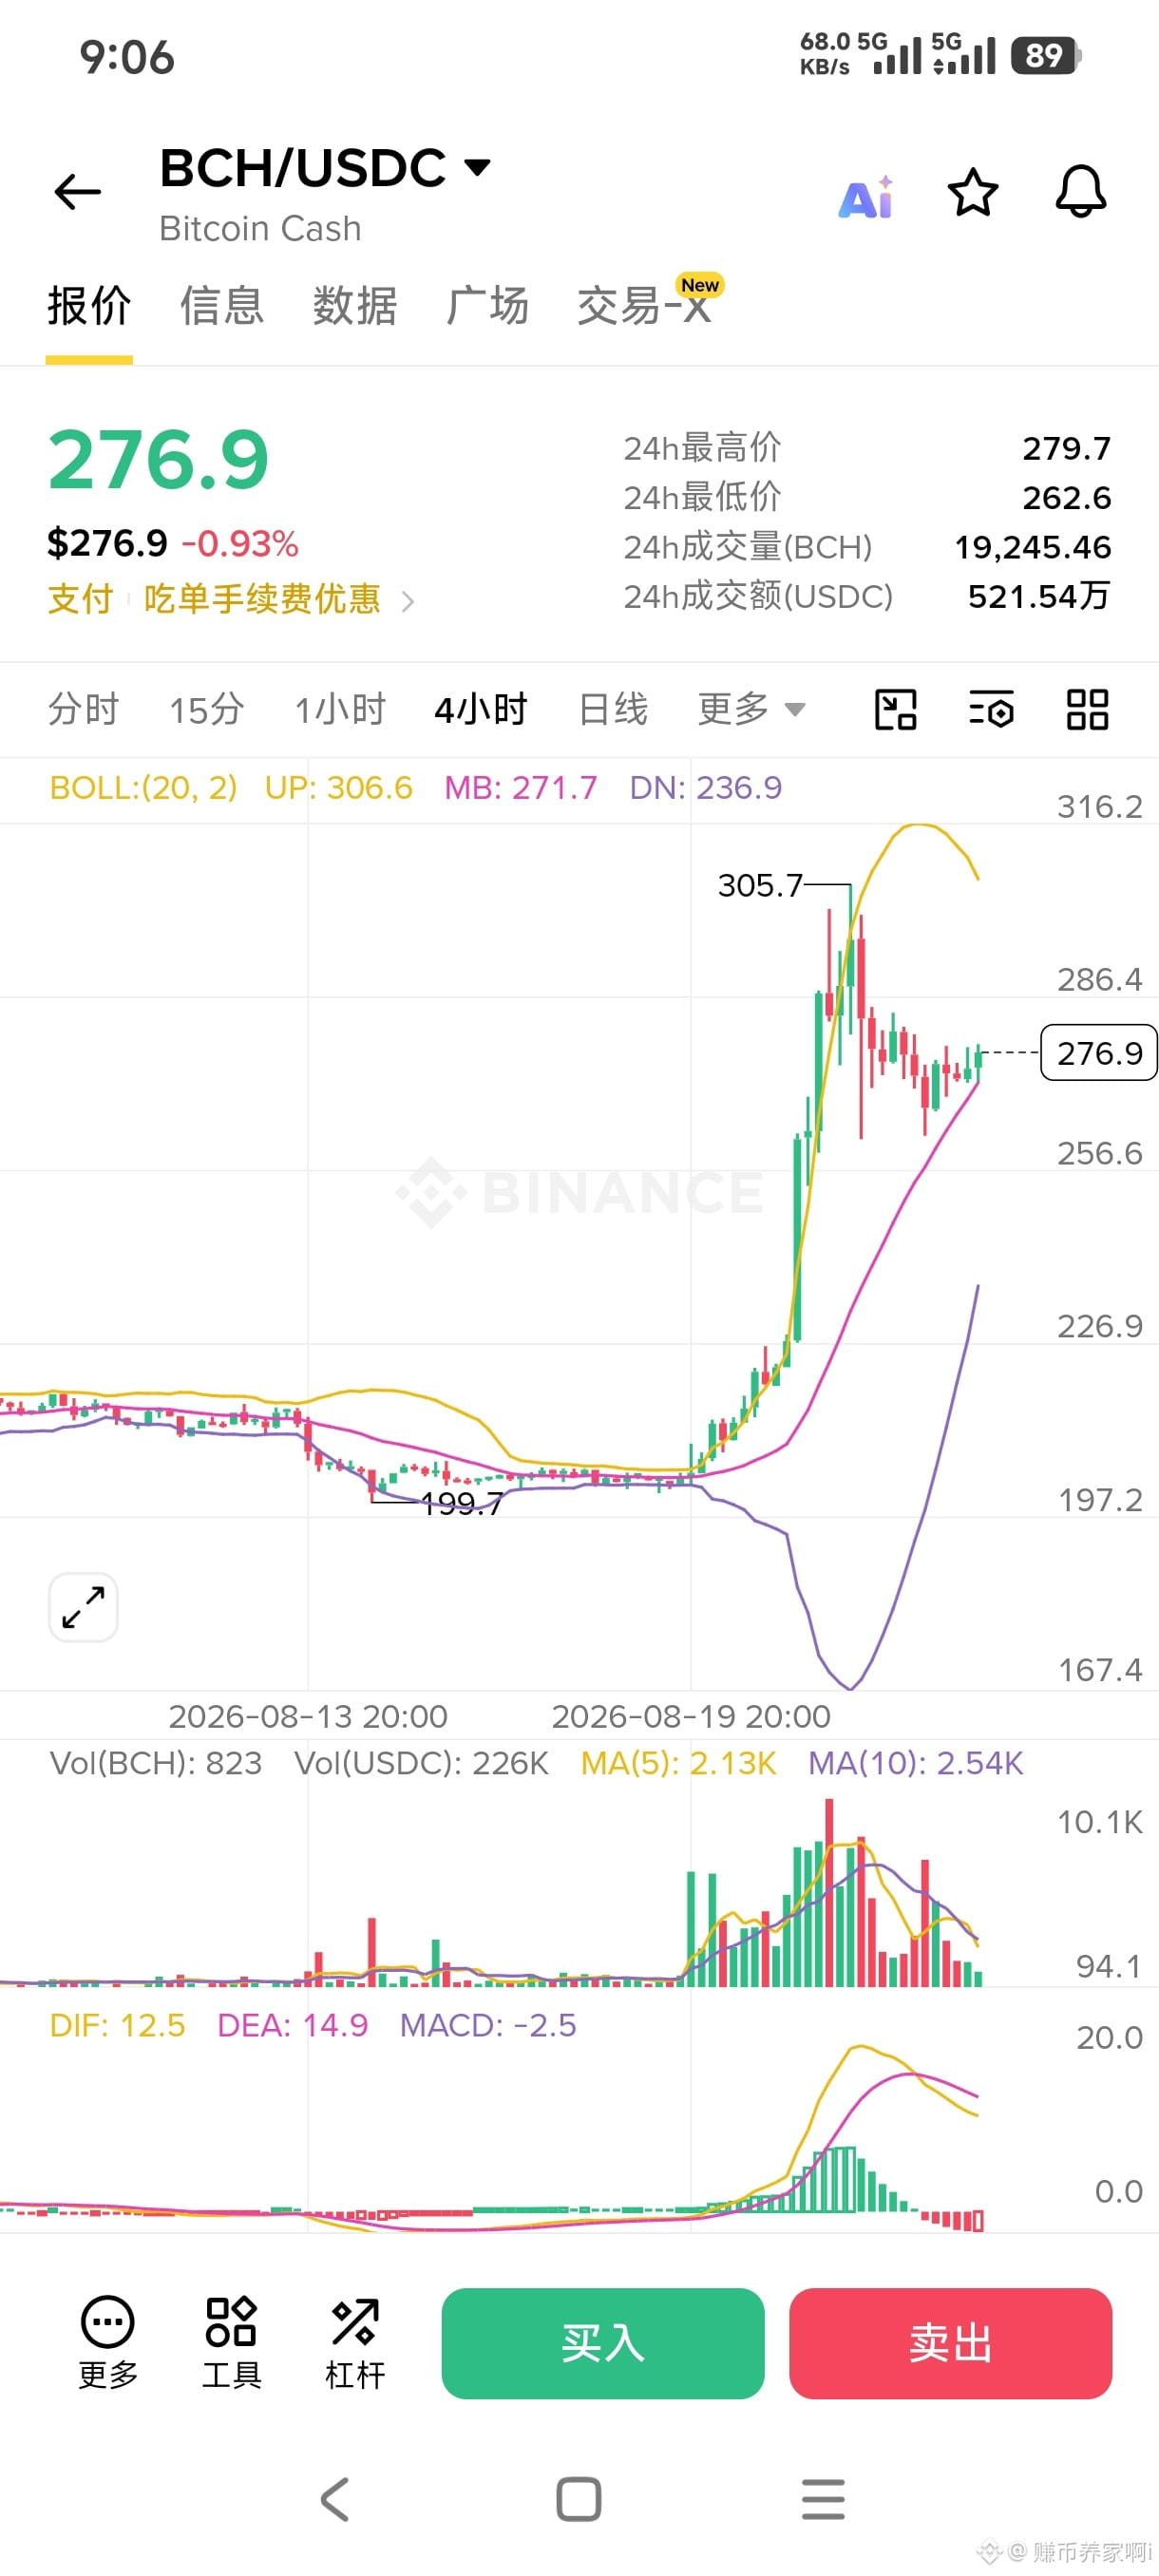
On the 4-hour chart: earlier, it surged quickly from 199.7 to a peak of 305.7. After hitting the high, it began to fall and enter a consolidation range. MACD has already turned negative and upside momentum is weakening. However, the middle Bollinger band at 271.7 is still acting as support, and the current price is right around the middle-band level.
If the middle-band support holds, there’s a chance for a second attempt to test the previous high. If there is a valid breakdown below 264, the structure of this upswing will be damaged, and price will likely probe lower further.
Control your position size—don’t go heavy on this speculative setup.
Direction: short-term pullback and dip-buy for long
Entry range: 272-274
Stop loss: 264
First take profit: 286
Second take profit: 298
On the 4-hour chart: earlier, it surged quickly from 199.7 to a peak of 305.7. After hitting the high, it began to fall and enter a consolidation range. MACD has already turned negative and upside momentum is weakening. However, the middle Bollinger band at 271.7 is still acting as support, and the current price is right around the middle-band level.
If the middle-band support holds, there’s a chance for a second attempt to test the previous high. If there is a valid breakdown below 264, the structure of this upswing will be damaged, and price will likely probe lower further.
Control your position size—don’t go heavy on this speculative setup.
$AAVE 4 Hour-level:
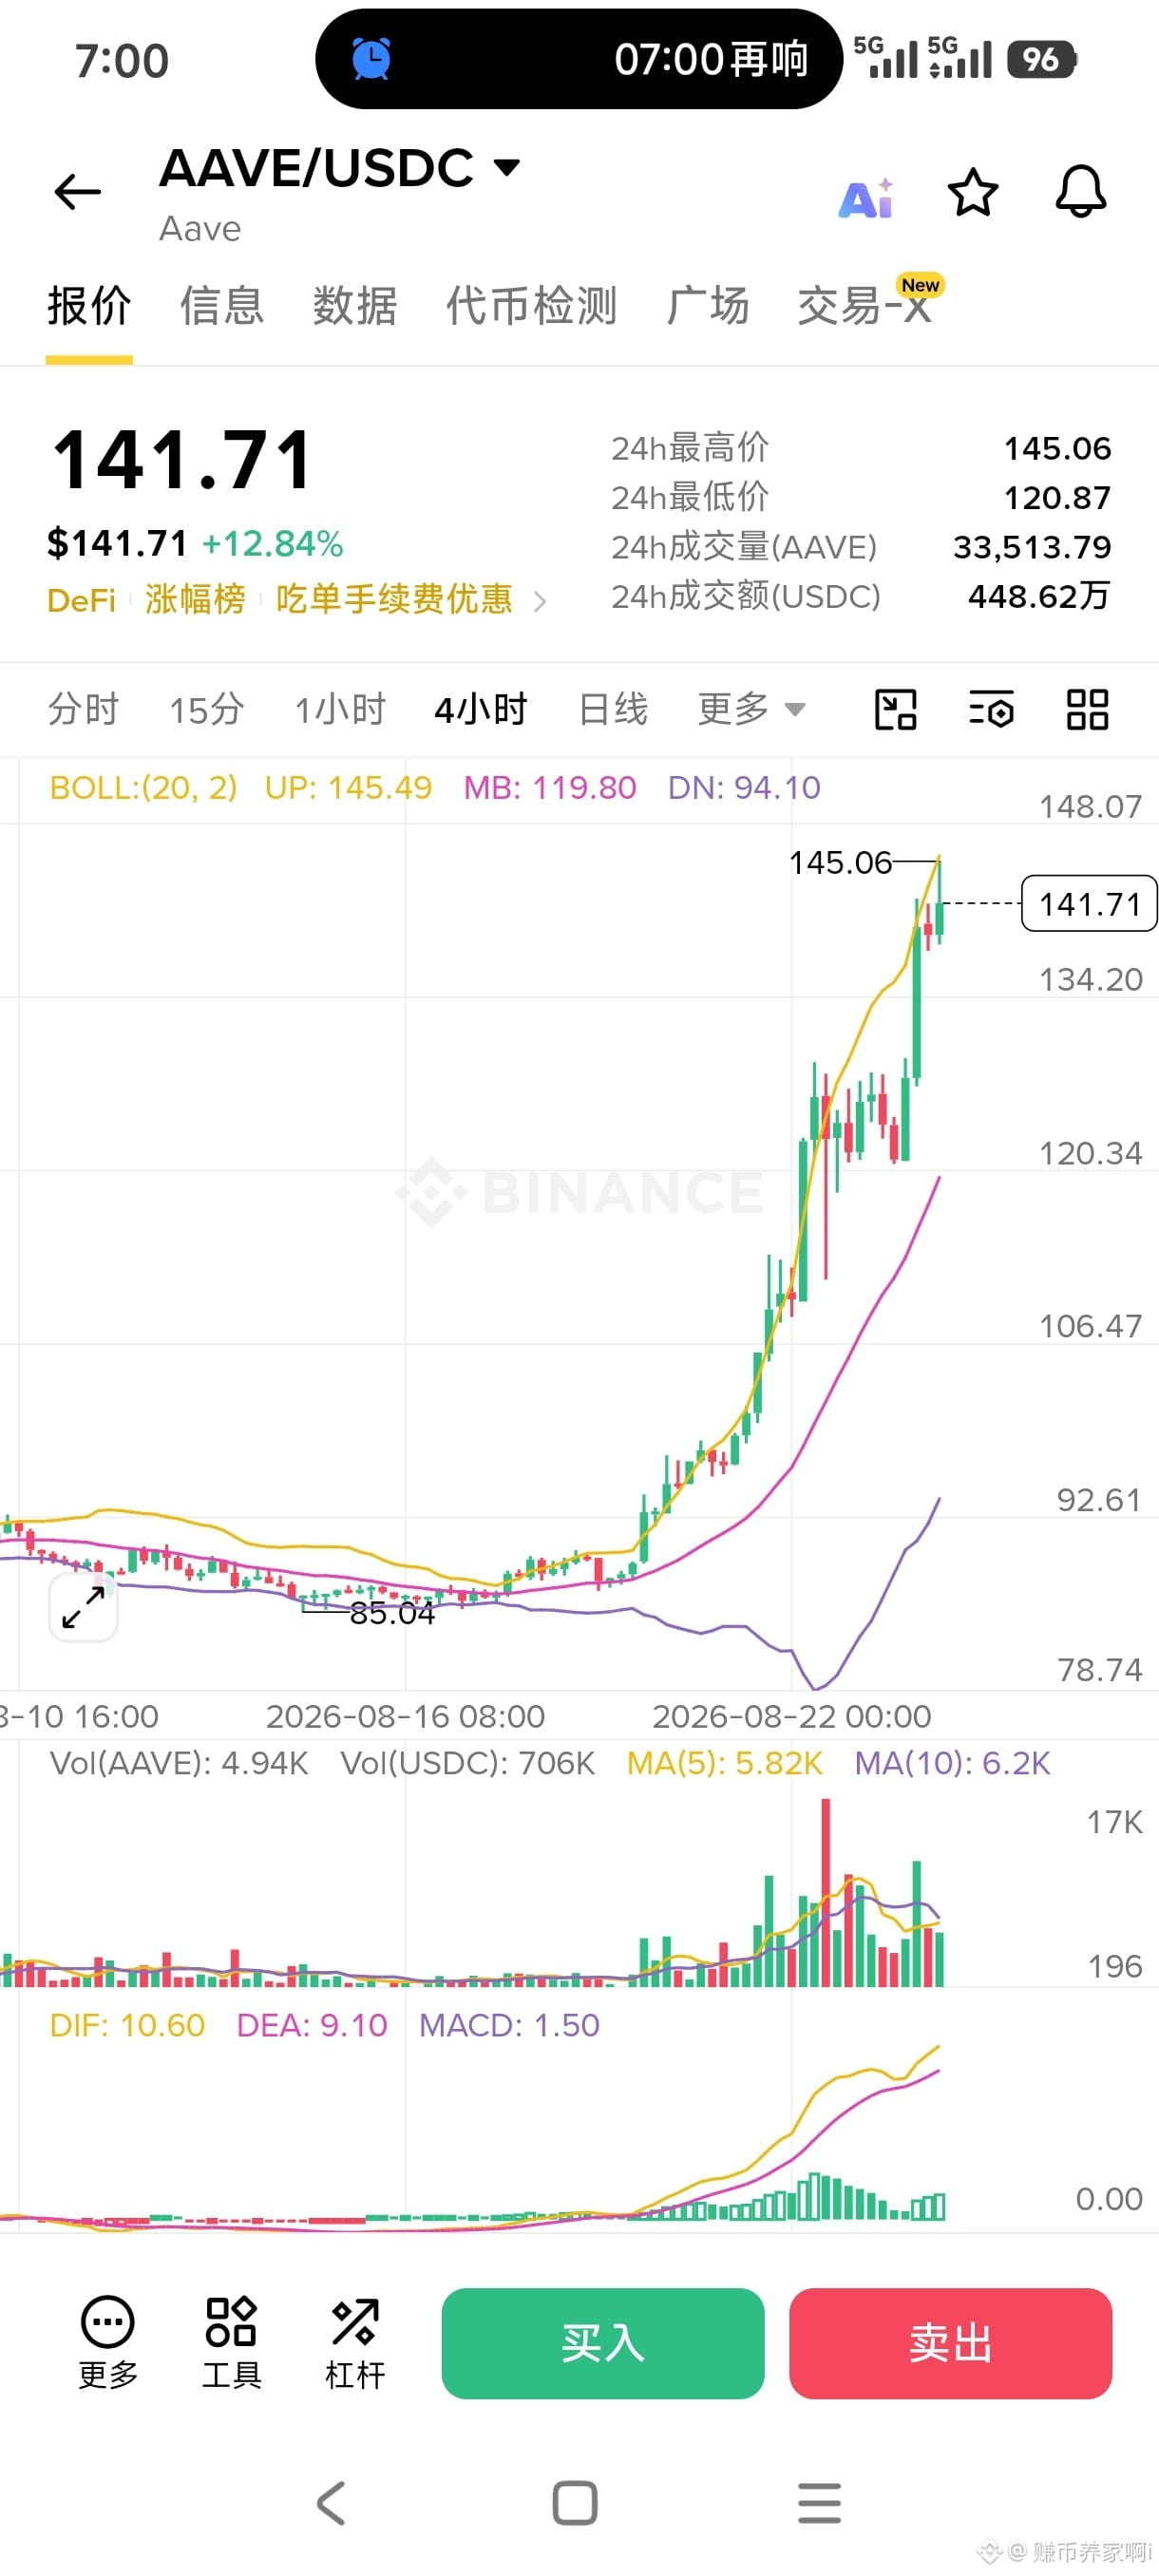
AAVE spikes up to touch the upper Bollinger Band at 145.49, then pulls back to the current price of 141.71.
The Bollinger Bands have opened up significantly, indicating a strong bullish trend, but the candlestick has started to form an upper wick, suggesting a near-term pullback is needed.
The MACD value remains at a high level and bullish momentum is still there, but the DIF shows signs of turning.
Resistance: 144‑145
First support: 134
Core support: Bollinger mid-band 119.8
Trading perspective:
Don’t chase longs. If it retraces and holds above 134, you can look for a second push higher; if it breaks below 134, it will most likely pull back toward the mid-band around 120.
145 above is a strong resistance and is unlikely to be broken through in one shot directly.
AAVE spikes up to touch the upper Bollinger Band at 145.49, then pulls back to the current price of 141.71.
The Bollinger Bands have opened up significantly, indicating a strong bullish trend, but the candlestick has started to form an upper wick, suggesting a near-term pullback is needed.
The MACD value remains at a high level and bullish momentum is still there, but the DIF shows signs of turning.
Resistance: 144‑145
First support: 134
Core support: Bollinger mid-band 119.8
Trading perspective:
Don’t chase longs. If it retraces and holds above 134, you can look for a second push higher; if it breaks below 134, it will most likely pull back toward the mid-band around 120.
145 above is a strong resistance and is unlikely to be broken through in one shot directly.
$TRUMP
Underlying: TRUMPUSDT Perpetual, Isolated Margin
Leverage: 2x, no additional leverage
Margin: Use 12% of the total account funds for this trade
Entry range: 2.44–2.52
Stop-loss: 2.21
First take-profit: 2.73
Second take-profit: 2.92
Execution notes:
No matter whether this hits the stop-loss or take-profit, once the trade ends, close the entire position—do not re-open a new trade.
If there is a sudden massive surge or crash with a gap in the market, abandon this plan immediately—do not force an entry.
The slippage on meme coins is extremely high. Try to place limit orders and use market orders as little as possible.
Underlying: TRUMPUSDT Perpetual, Isolated Margin
Leverage: 2x, no additional leverage
Margin: Use 12% of the total account funds for this trade
Entry range: 2.44–2.52
Stop-loss: 2.21
First take-profit: 2.73
Second take-profit: 2.92
Execution notes:
No matter whether this hits the stop-loss or take-profit, once the trade ends, close the entire position—do not re-open a new trade.
If there is a sudden massive surge or crash with a gap in the market, abandon this plan immediately—do not force an entry.
The slippage on meme coins is extremely high. Try to place limit orders and use market orders as little as possible.
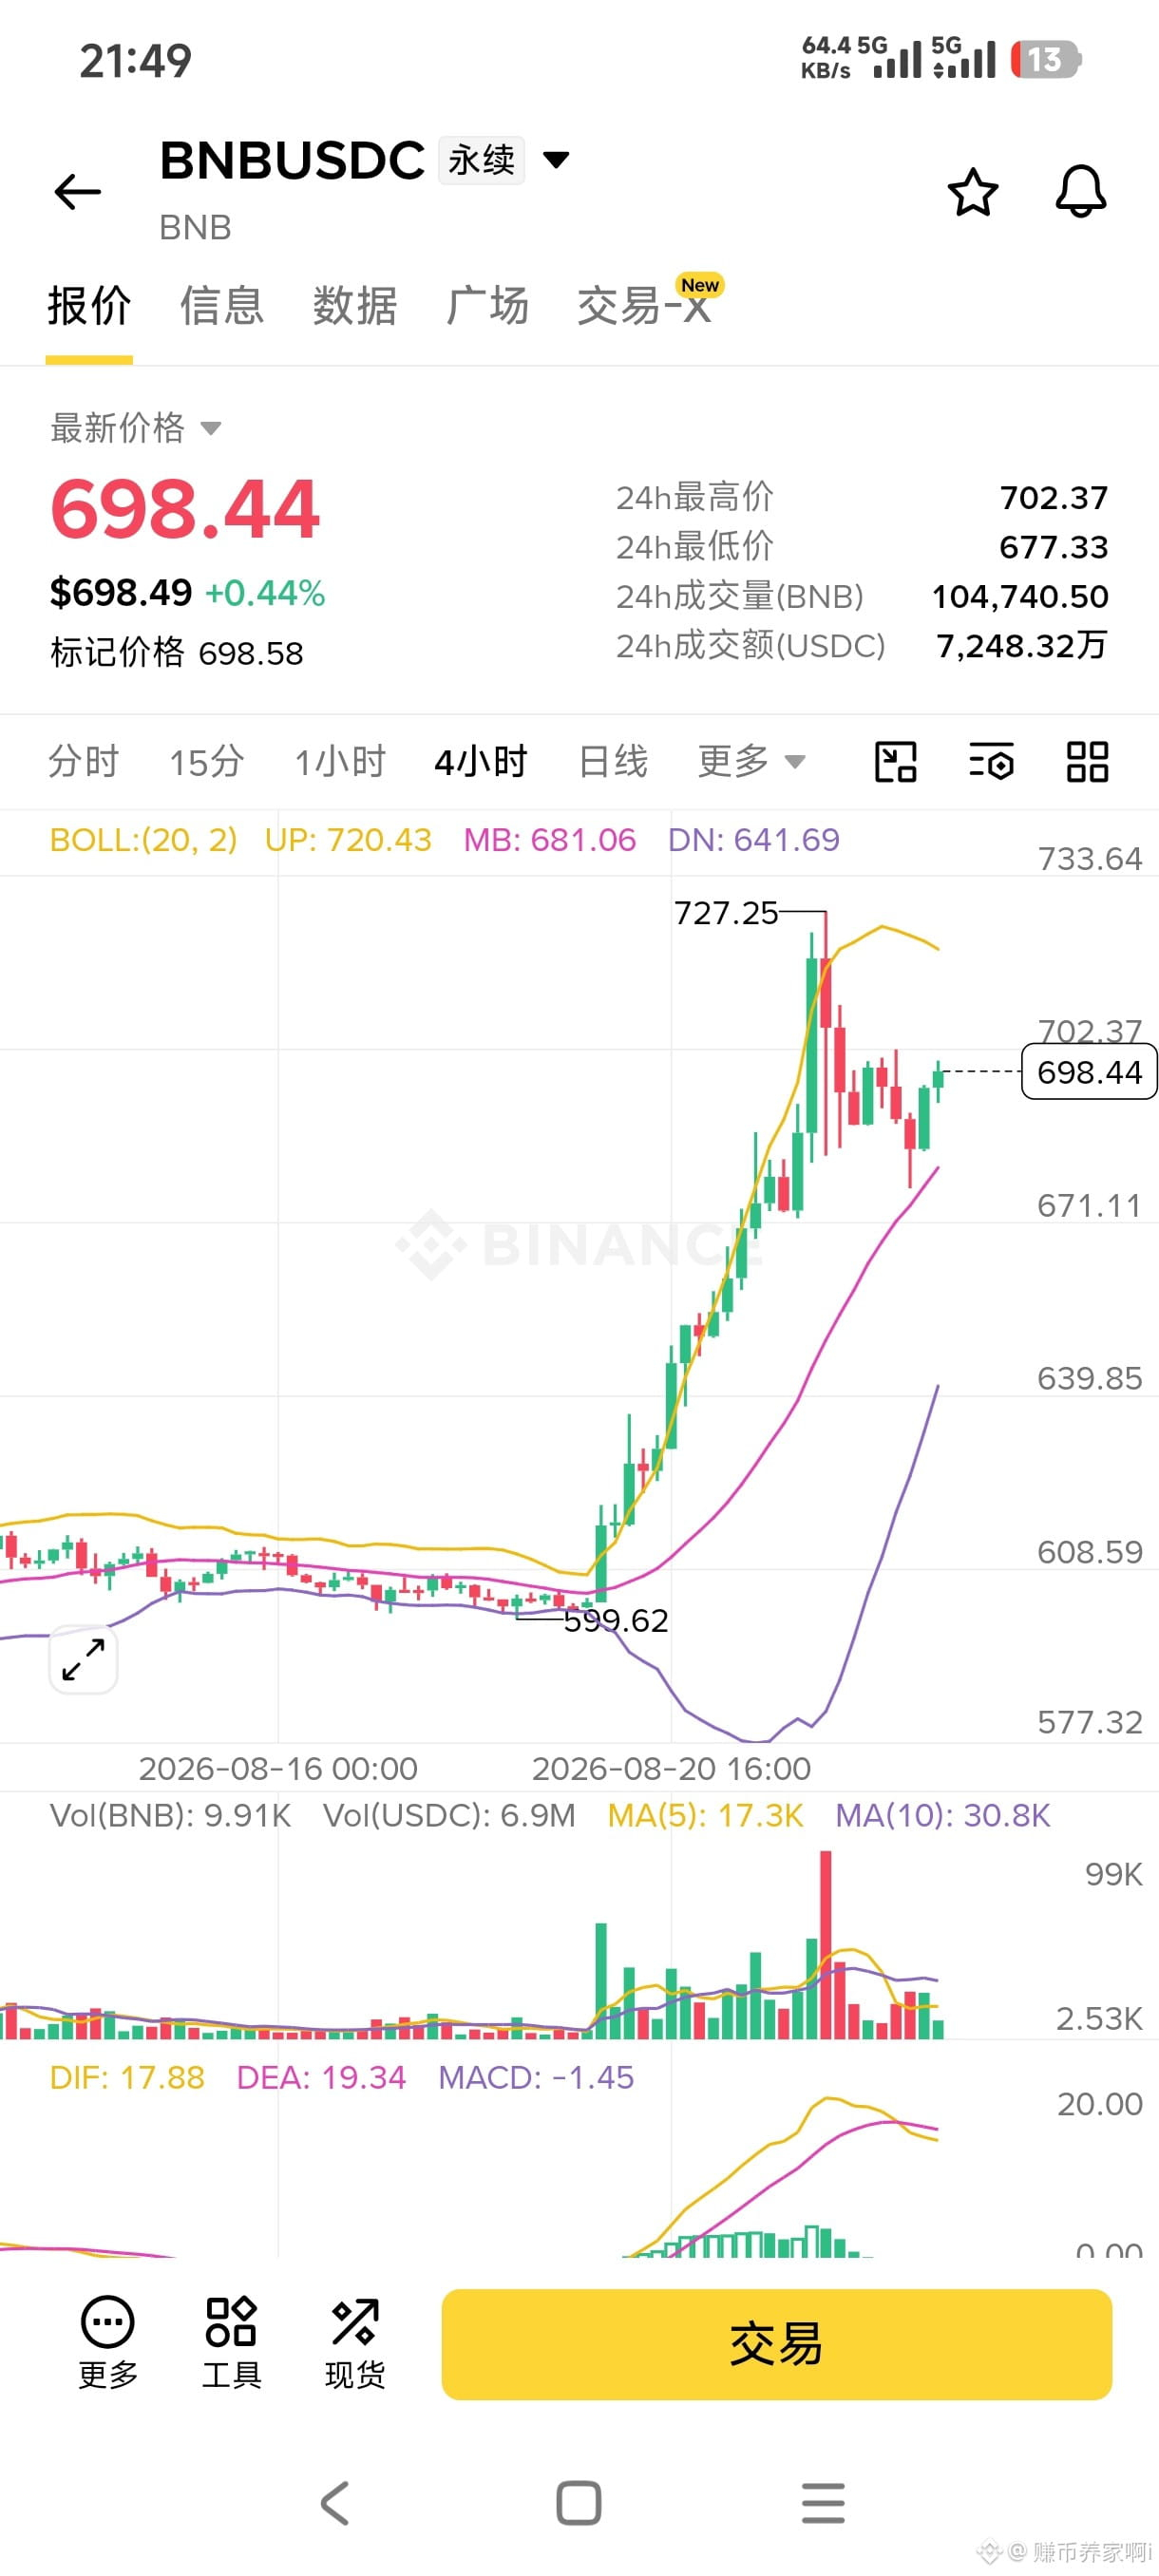
$BNB BNB4-hour chart: after a big rise, there’s a pullback; the Bollinger Bands are opening, and there’s still room for volatility.
Go long
Entry range: 692–694
Take profit: exit upward by 1% from entry
Stop loss: 686
Leverage: 5x
Don’t rush to chase at the current price—wait for the price to pull back into the range before taking action.
Close the position directly at the take profit—don’t get greedy. If the stop loss is hit, exit decisively and don’t hold onto losses. Take this short-term swing only; don’t treat it as a long-term hold.
Go long
Entry range: 692–694
Take profit: exit upward by 1% from entry
Stop loss: 686
Leverage: 5x
Don’t rush to chase at the current price—wait for the price to pull back into the range before taking action.
Close the position directly at the take profit—don’t get greedy. If the stop loss is hit, exit decisively and don’t hold onto losses. Take this short-term swing only; don’t treat it as a long-term hold.
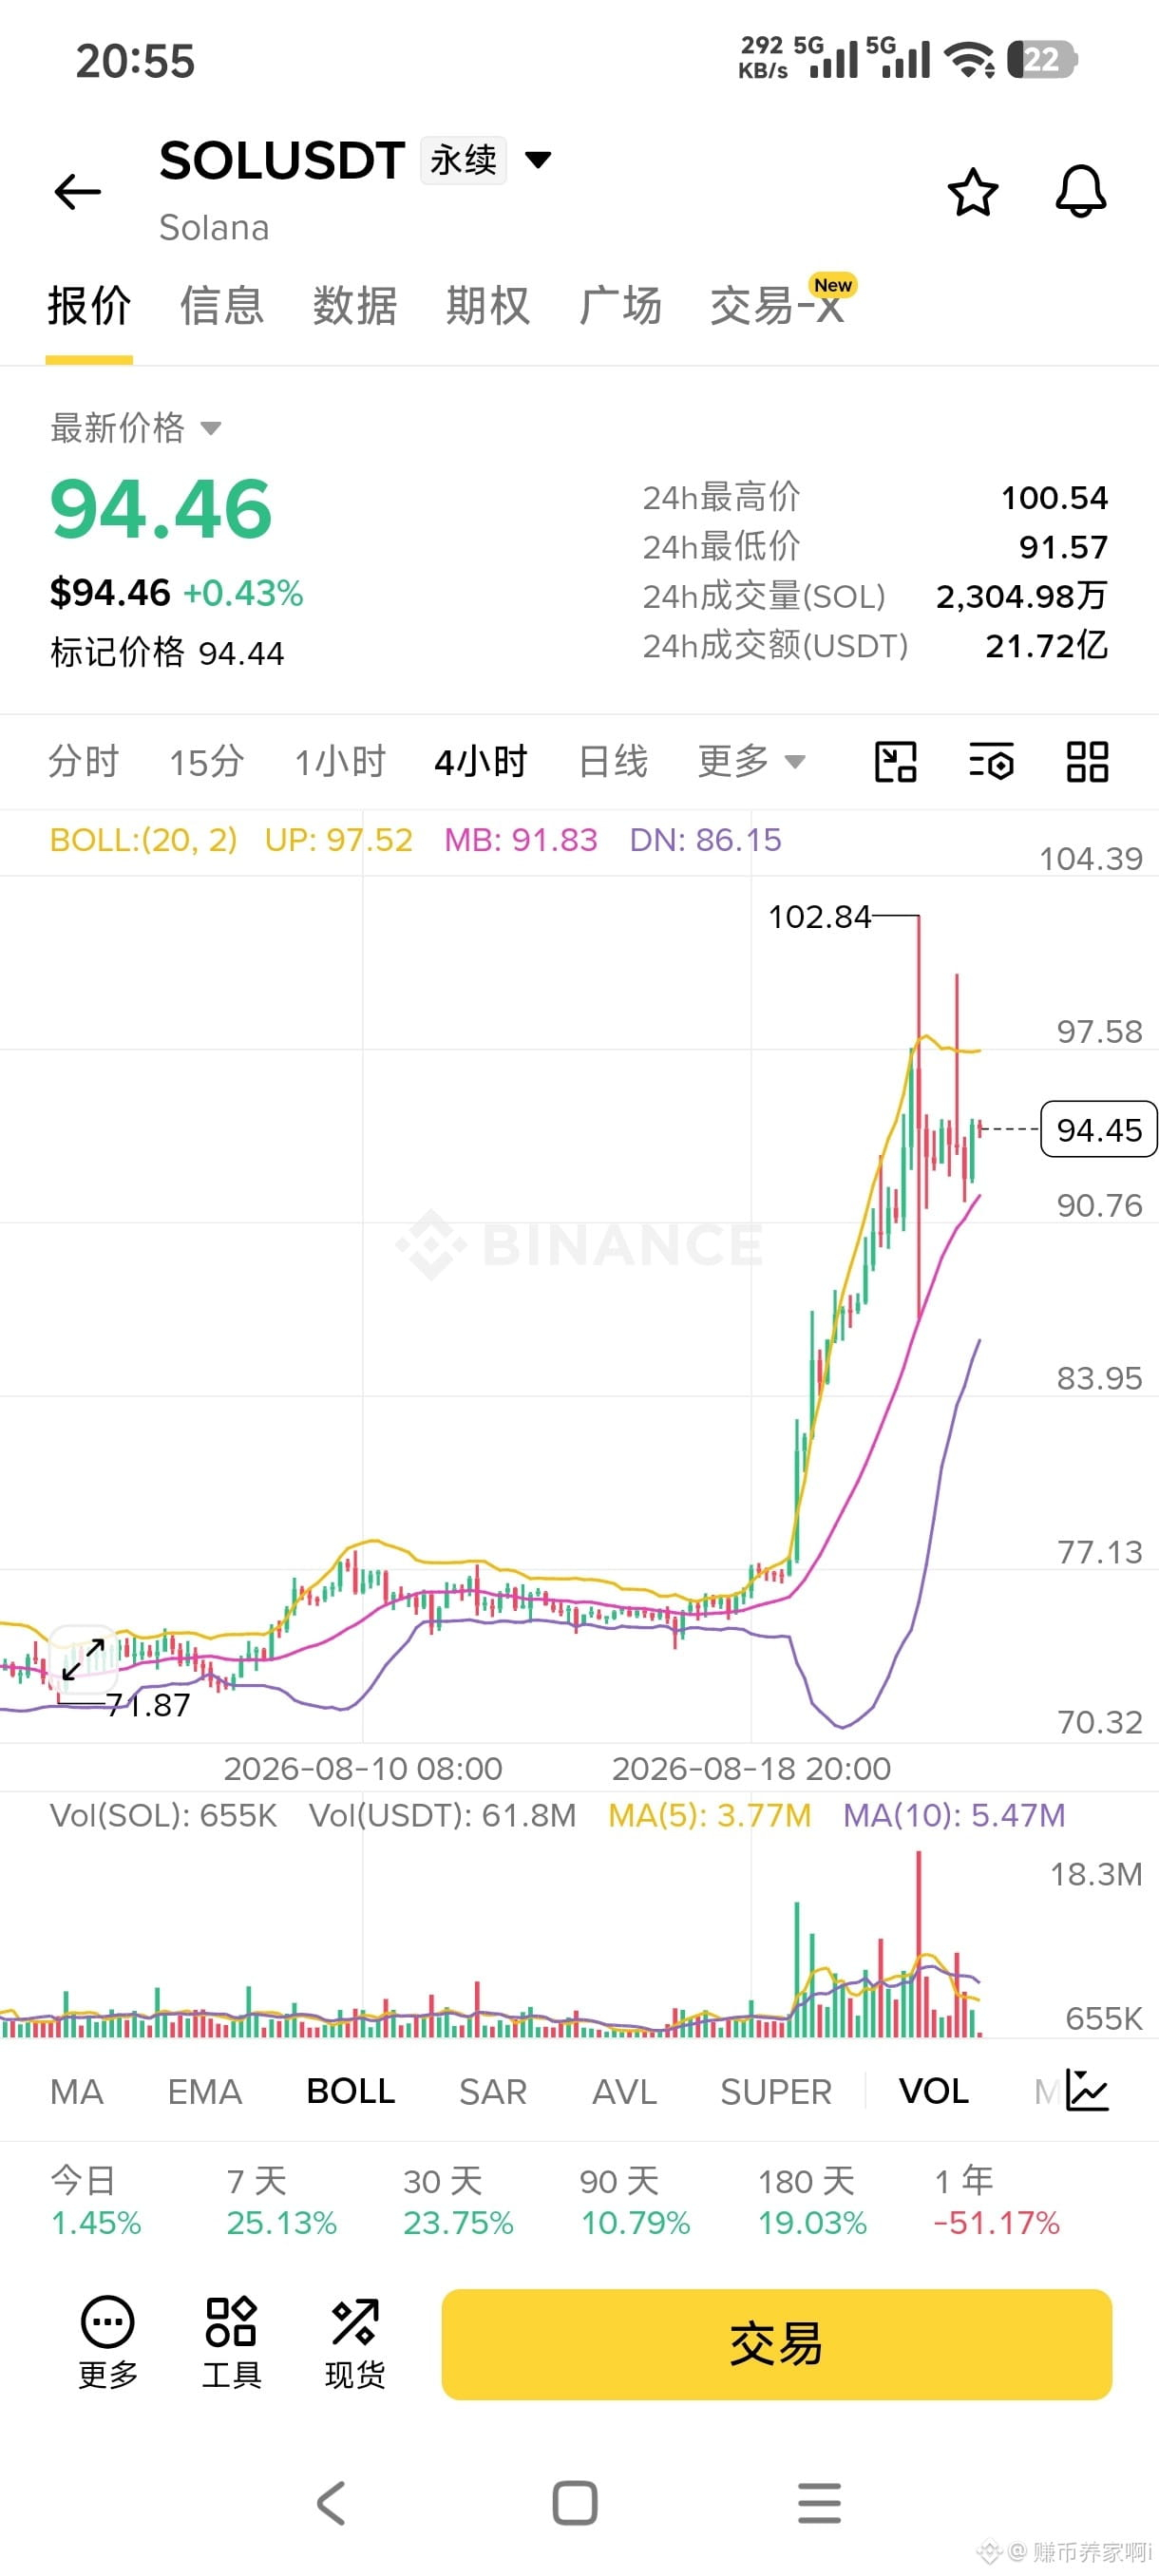
$SOL SOL After this spike high, the “needle” pullback is essentially a large-scale cleanup of in-market funds.
When it pushed up to around 102, a large amount of chase-long capital surged into the market at once—huge amounts of long positions piled up at the high levels. This liquidity is the target for liquidation hunting.
A long bearish needle drop like that is specifically meant to sweep away those high-position longs. Once the liquidation cascade is triggered, it further drags the price downward.
After the longs have been washed out once, shorts then rush in again to bet on a further decline. As a result, the price finally stops falling and stabilizes around 94. Once the short positions accumulate, there is also the risk of them being forced into a reverse liquidation (a squeeze upward).
Now looking at it, the area above 100–102 is heavily stacked with trapped, underwater positions. This portion will become strong sell pressure later on.
Below, 91–92 is the low of this round of rapid pullback, where there is supporting/absorbing capital propping it up.
Right now it’s stuck in the middle, with both sides holding a lot of positions: whichever side can’t hold, the market will move toward the other side.
Don’t just focus on whether the candles are red or green. Many of these needle moves aren’t purely technical price action—they’re often targeting liquidation liquidity.
When it pushed up to around 102, a large amount of chase-long capital surged into the market at once—huge amounts of long positions piled up at the high levels. This liquidity is the target for liquidation hunting.
A long bearish needle drop like that is specifically meant to sweep away those high-position longs. Once the liquidation cascade is triggered, it further drags the price downward.
After the longs have been washed out once, shorts then rush in again to bet on a further decline. As a result, the price finally stops falling and stabilizes around 94. Once the short positions accumulate, there is also the risk of them being forced into a reverse liquidation (a squeeze upward).
Now looking at it, the area above 100–102 is heavily stacked with trapped, underwater positions. This portion will become strong sell pressure later on.
Below, 91–92 is the low of this round of rapid pullback, where there is supporting/absorbing capital propping it up.
Right now it’s stuck in the middle, with both sides holding a lot of positions: whichever side can’t hold, the market will move toward the other side.
Don’t just focus on whether the candles are red or green. Many of these needle moves aren’t purely technical price action—they’re often targeting liquidation liquidity.
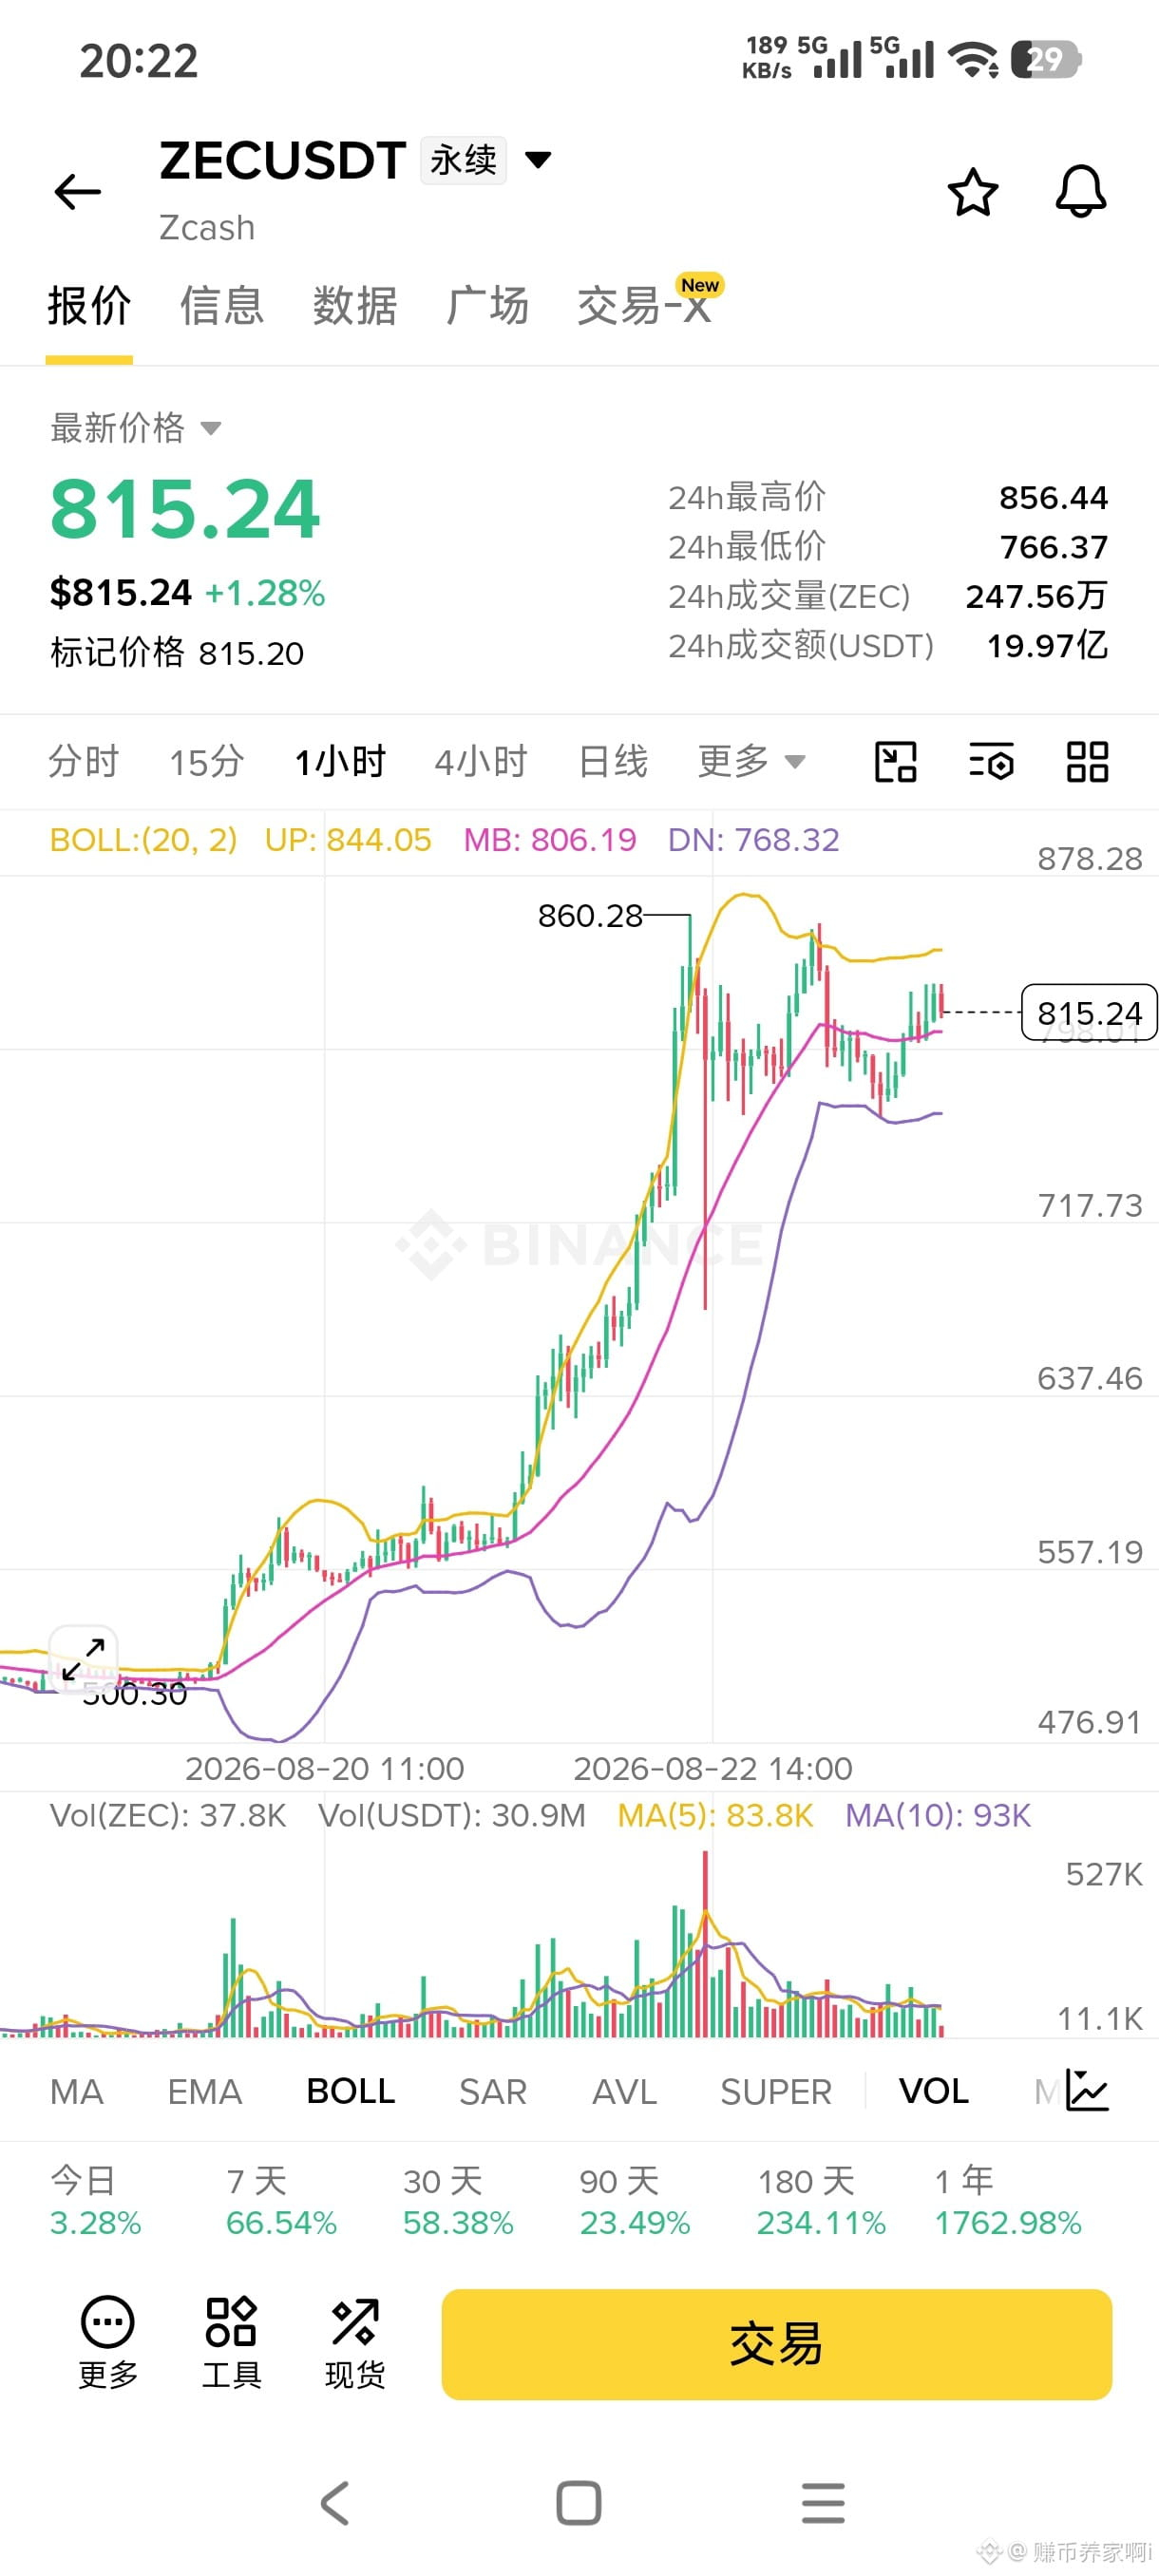
$ZEC ZEC This chart is truly outrageous. These past two days have been a two-way squeeze, with both long and short sides getting crushed in both directions.
They pushed it up all the way to 860 in one go. A lot of people saw the rally looking strong, rushed in to chase longs, and the result was immediate—straight down comes a nasty pin bar that hammers hard, sweeping a whole bunch of longs right out of the game.
Just when the shorts thought they could finally breathe easy, thinking a big drop was about to start, the price was forcibly yanked back to around 815.
Long and short, round after round—scalping harvest after harvest. It’s just too hard for retail traders to play.
No matter whether you go long or short, if you don’t control your position size even a little, one random instant pin bar and your account is immediately hurt.
From the outside, it looks like these big bullish candles are轰轰烈烈, but in reality, most people who actually trade futures didn’t make money— instead they got slapped in both directions. Up? Still loss. Down? Also loss.
They pushed it up all the way to 860 in one go. A lot of people saw the rally looking strong, rushed in to chase longs, and the result was immediate—straight down comes a nasty pin bar that hammers hard, sweeping a whole bunch of longs right out of the game.
Just when the shorts thought they could finally breathe easy, thinking a big drop was about to start, the price was forcibly yanked back to around 815.
Long and short, round after round—scalping harvest after harvest. It’s just too hard for retail traders to play.
No matter whether you go long or short, if you don’t control your position size even a little, one random instant pin bar and your account is immediately hurt.
From the outside, it looks like these big bullish candles are轰轰烈烈, but in reality, most people who actually trade futures didn’t make money— instead they got slapped in both directions. Up? Still loss. Down? Also loss.
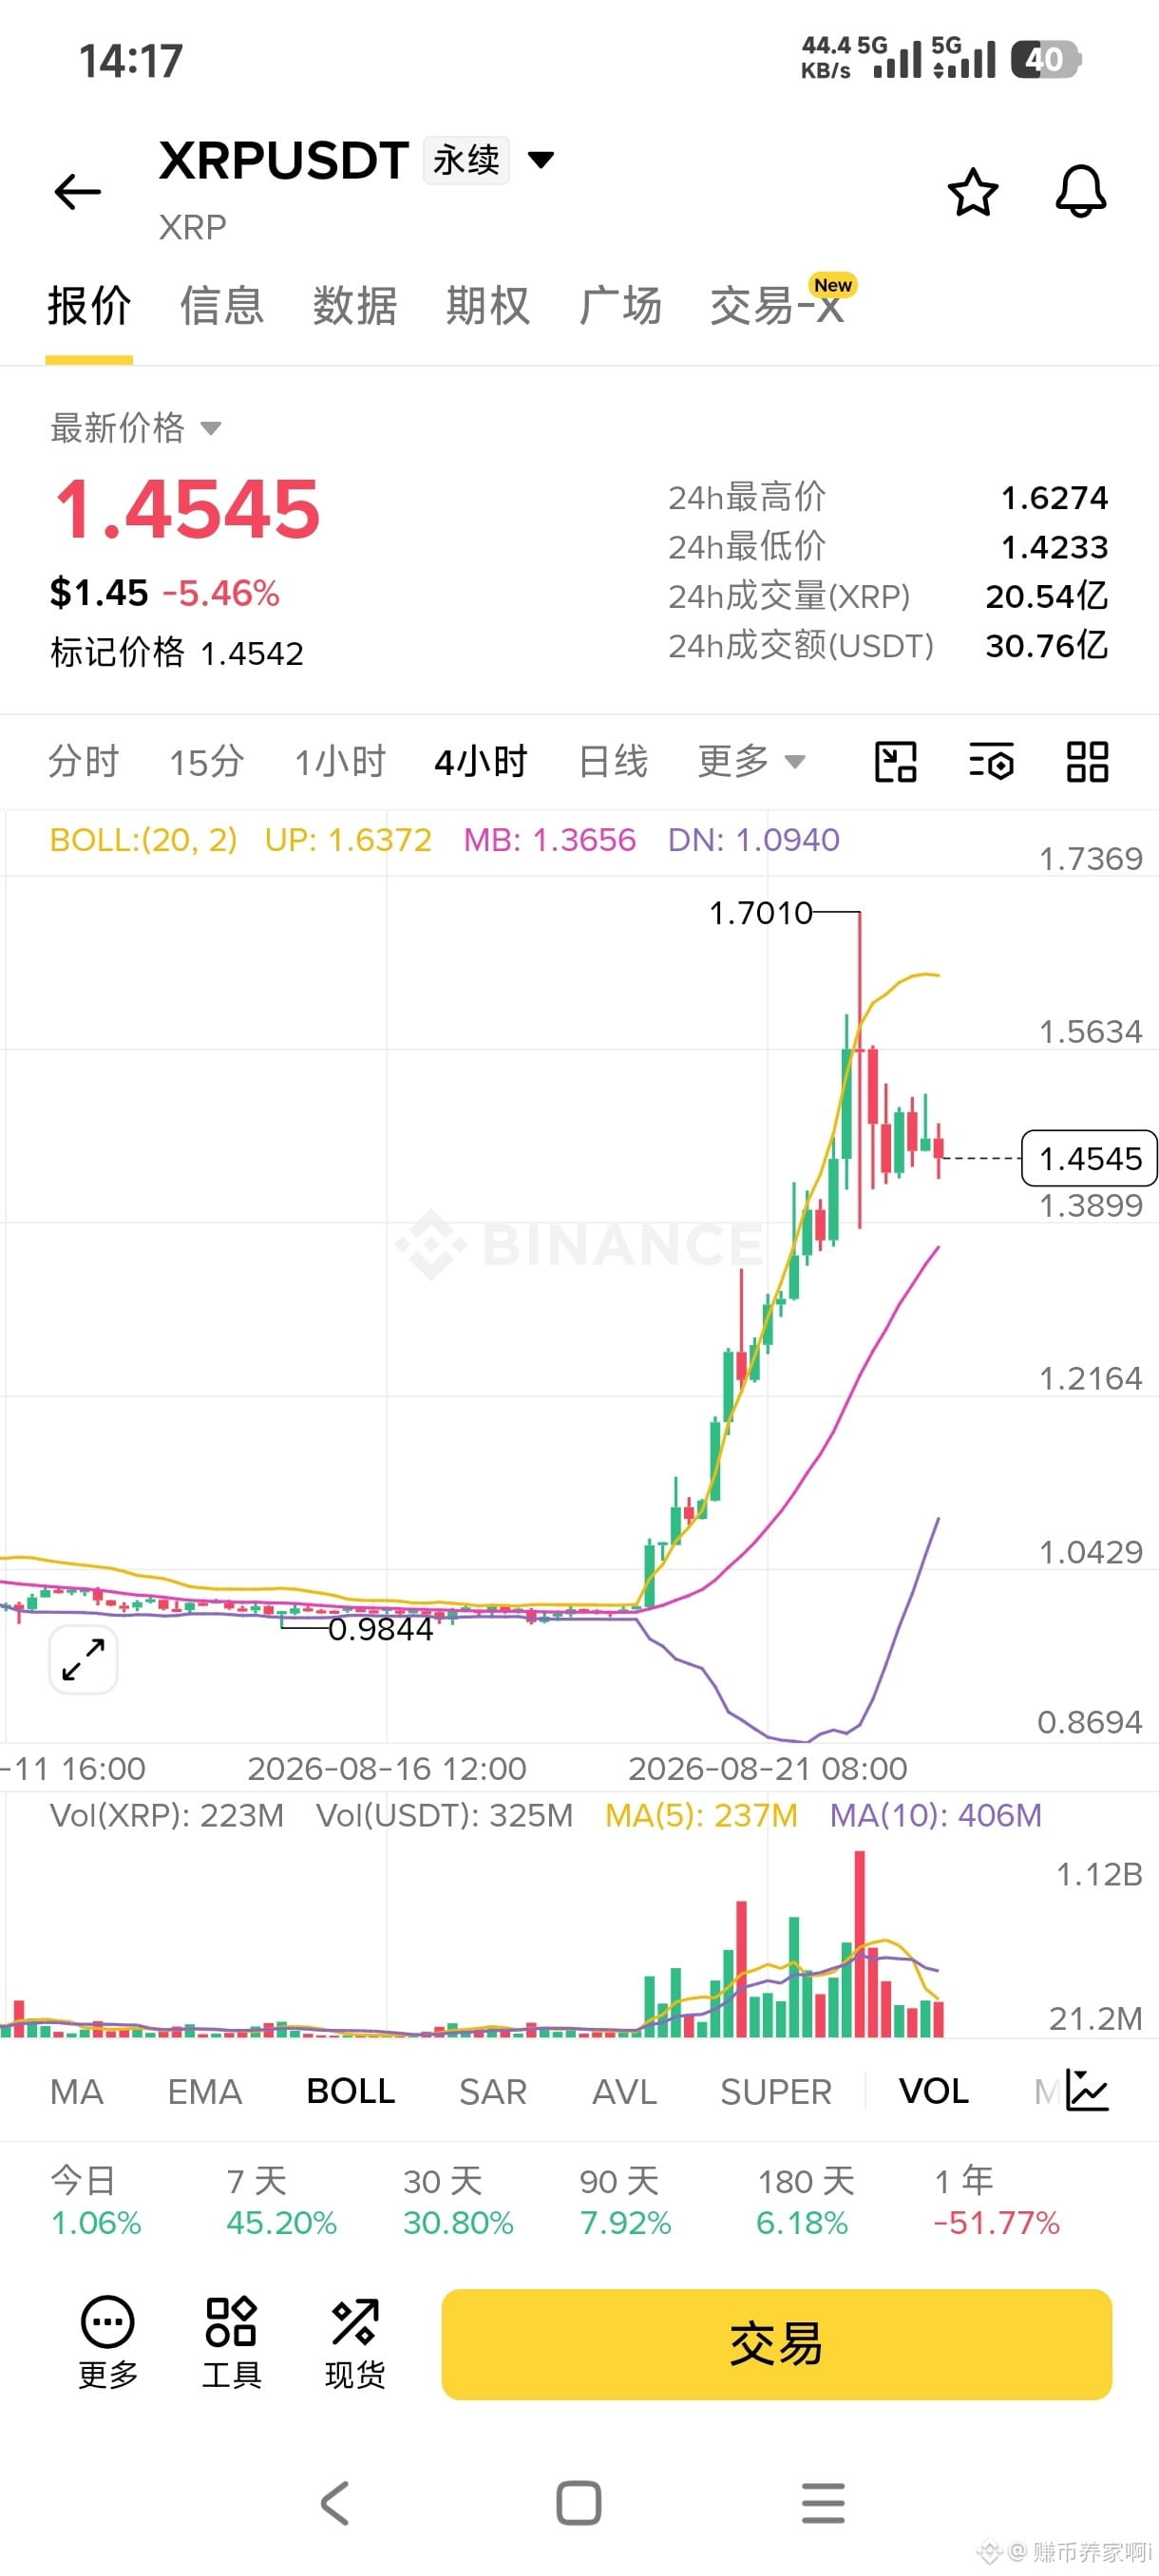
$XRP Market situation: On the 4-hour timeframe, a strong surge has been underway. After breaking up to 1.7010, it quickly pulled back. We are currently in the retracement stage after the upward move. Overall, the Bollinger middle band is pointing upward; the larger trend is still generally bullish. In the short term, sell pressure has been released, volatility is high, and the risk of spike wicks is elevated.
Direction: Only go long; do not chase shorts
Entry range: 1.370–1.390
Leverage: 2–3x
Stop loss: 1.310. If the mark price breaks and stays below it, exit immediately.
First target: Around 1.550, a pressure/resistance level. When reached, reduce position first.
Second target: Push to the prior high before the move at 1.7010
Key execution points:
1. After experiencing a sharp pump and pullback, the market is oscillating violently. Do not participate with heavy position sizing. Use limit orders as much as possible to avoid slippage.
2. Use mark-price triggers for conditional orders to prevent momentary spike wicks from sweeping your stop loss.
3. If the price keeps falling and breaks below 1.3566, the Bollinger middle band, immediately abandon this long setup—do not hold the loss and hard-bottom catch.
4. This is a retracement after a big rally. Reversal can happen quickly. When you reach the target areas, take profit actively and lock in gains—do not overhold.
Direction: Only go long; do not chase shorts
Entry range: 1.370–1.390
Leverage: 2–3x
Stop loss: 1.310. If the mark price breaks and stays below it, exit immediately.
First target: Around 1.550, a pressure/resistance level. When reached, reduce position first.
Second target: Push to the prior high before the move at 1.7010
Key execution points:
1. After experiencing a sharp pump and pullback, the market is oscillating violently. Do not participate with heavy position sizing. Use limit orders as much as possible to avoid slippage.
2. Use mark-price triggers for conditional orders to prevent momentary spike wicks from sweeping your stop loss.
3. If the price keeps falling and breaks below 1.3566, the Bollinger middle band, immediately abandon this long setup—do not hold the loss and hard-bottom catch.
4. This is a retracement after a big rally. Reversal can happen quickly. When you reach the target areas, take profit actively and lock in gains—do not overhold.
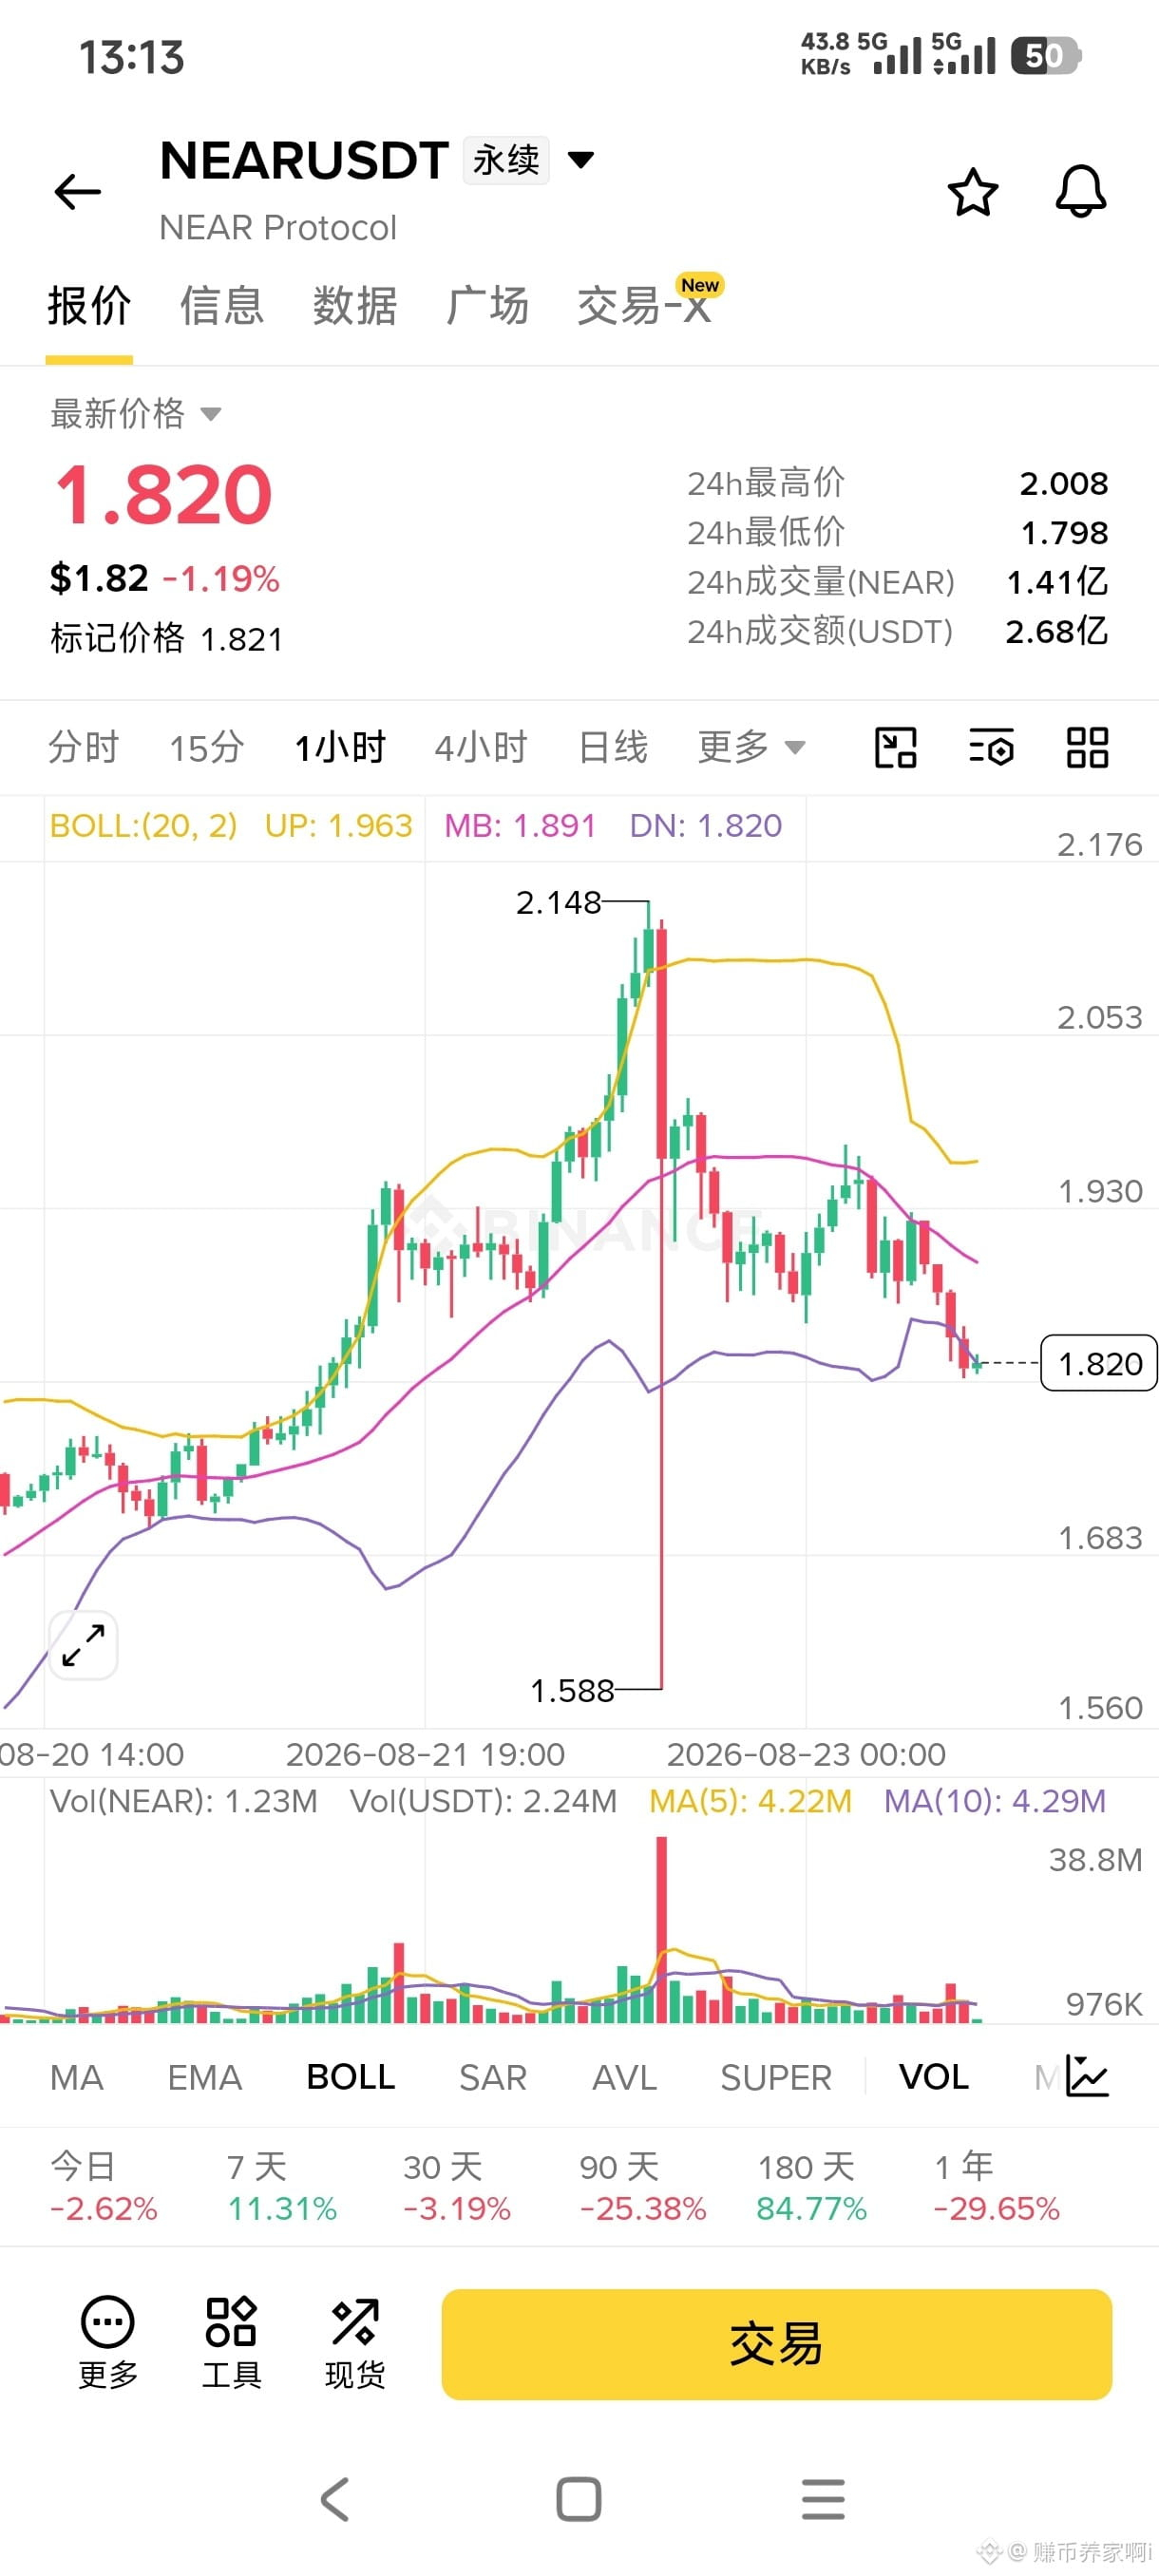
$NEAR
After the one-hour breakout surged 2.148 and then produced a deep needle-like dip, it suddenly dropped to 1.588. The price then rebounded to repair, and is currently trading near the lower Bollinger Band.
After one round of upswing, it was met with concentrated heavy selling. The long wick swept out many long positions directly. During the rebound, the swing highs kept trending lower; the Bollinger mid-band has continued to slope downward, and the overall market has already weakened.
After experiencing such an extreme needle, market sentiment becomes highly sensitive. Don’t jump in and bottom-fish just because the decline looks large. A needle is only a one-time washout and does not necessarily mean an immediate reversal upward. Each time the rebound approaches the area around the Bollinger mid-band, there will be strong selling pressure.
At this stage, don’t rush to enter with heavy position sizes. In the aftermath of an extreme needle, these back-and-forth sweeps will likely keep occurring frequently. If you do participate, set your stop-loss with enough room to avoid getting knocked out again by a sudden needle-like move. Don’t hold losses and gamble on a rebound.
After the one-hour breakout surged 2.148 and then produced a deep needle-like dip, it suddenly dropped to 1.588. The price then rebounded to repair, and is currently trading near the lower Bollinger Band.
After one round of upswing, it was met with concentrated heavy selling. The long wick swept out many long positions directly. During the rebound, the swing highs kept trending lower; the Bollinger mid-band has continued to slope downward, and the overall market has already weakened.
After experiencing such an extreme needle, market sentiment becomes highly sensitive. Don’t jump in and bottom-fish just because the decline looks large. A needle is only a one-time washout and does not necessarily mean an immediate reversal upward. Each time the rebound approaches the area around the Bollinger mid-band, there will be strong selling pressure.
At this stage, don’t rush to enter with heavy position sizes. In the aftermath of an extreme needle, these back-and-forth sweeps will likely keep occurring frequently. If you do participate, set your stop-loss with enough room to avoid getting knocked out again by a sudden needle-like move. Don’t hold losses and gamble on a rebound.
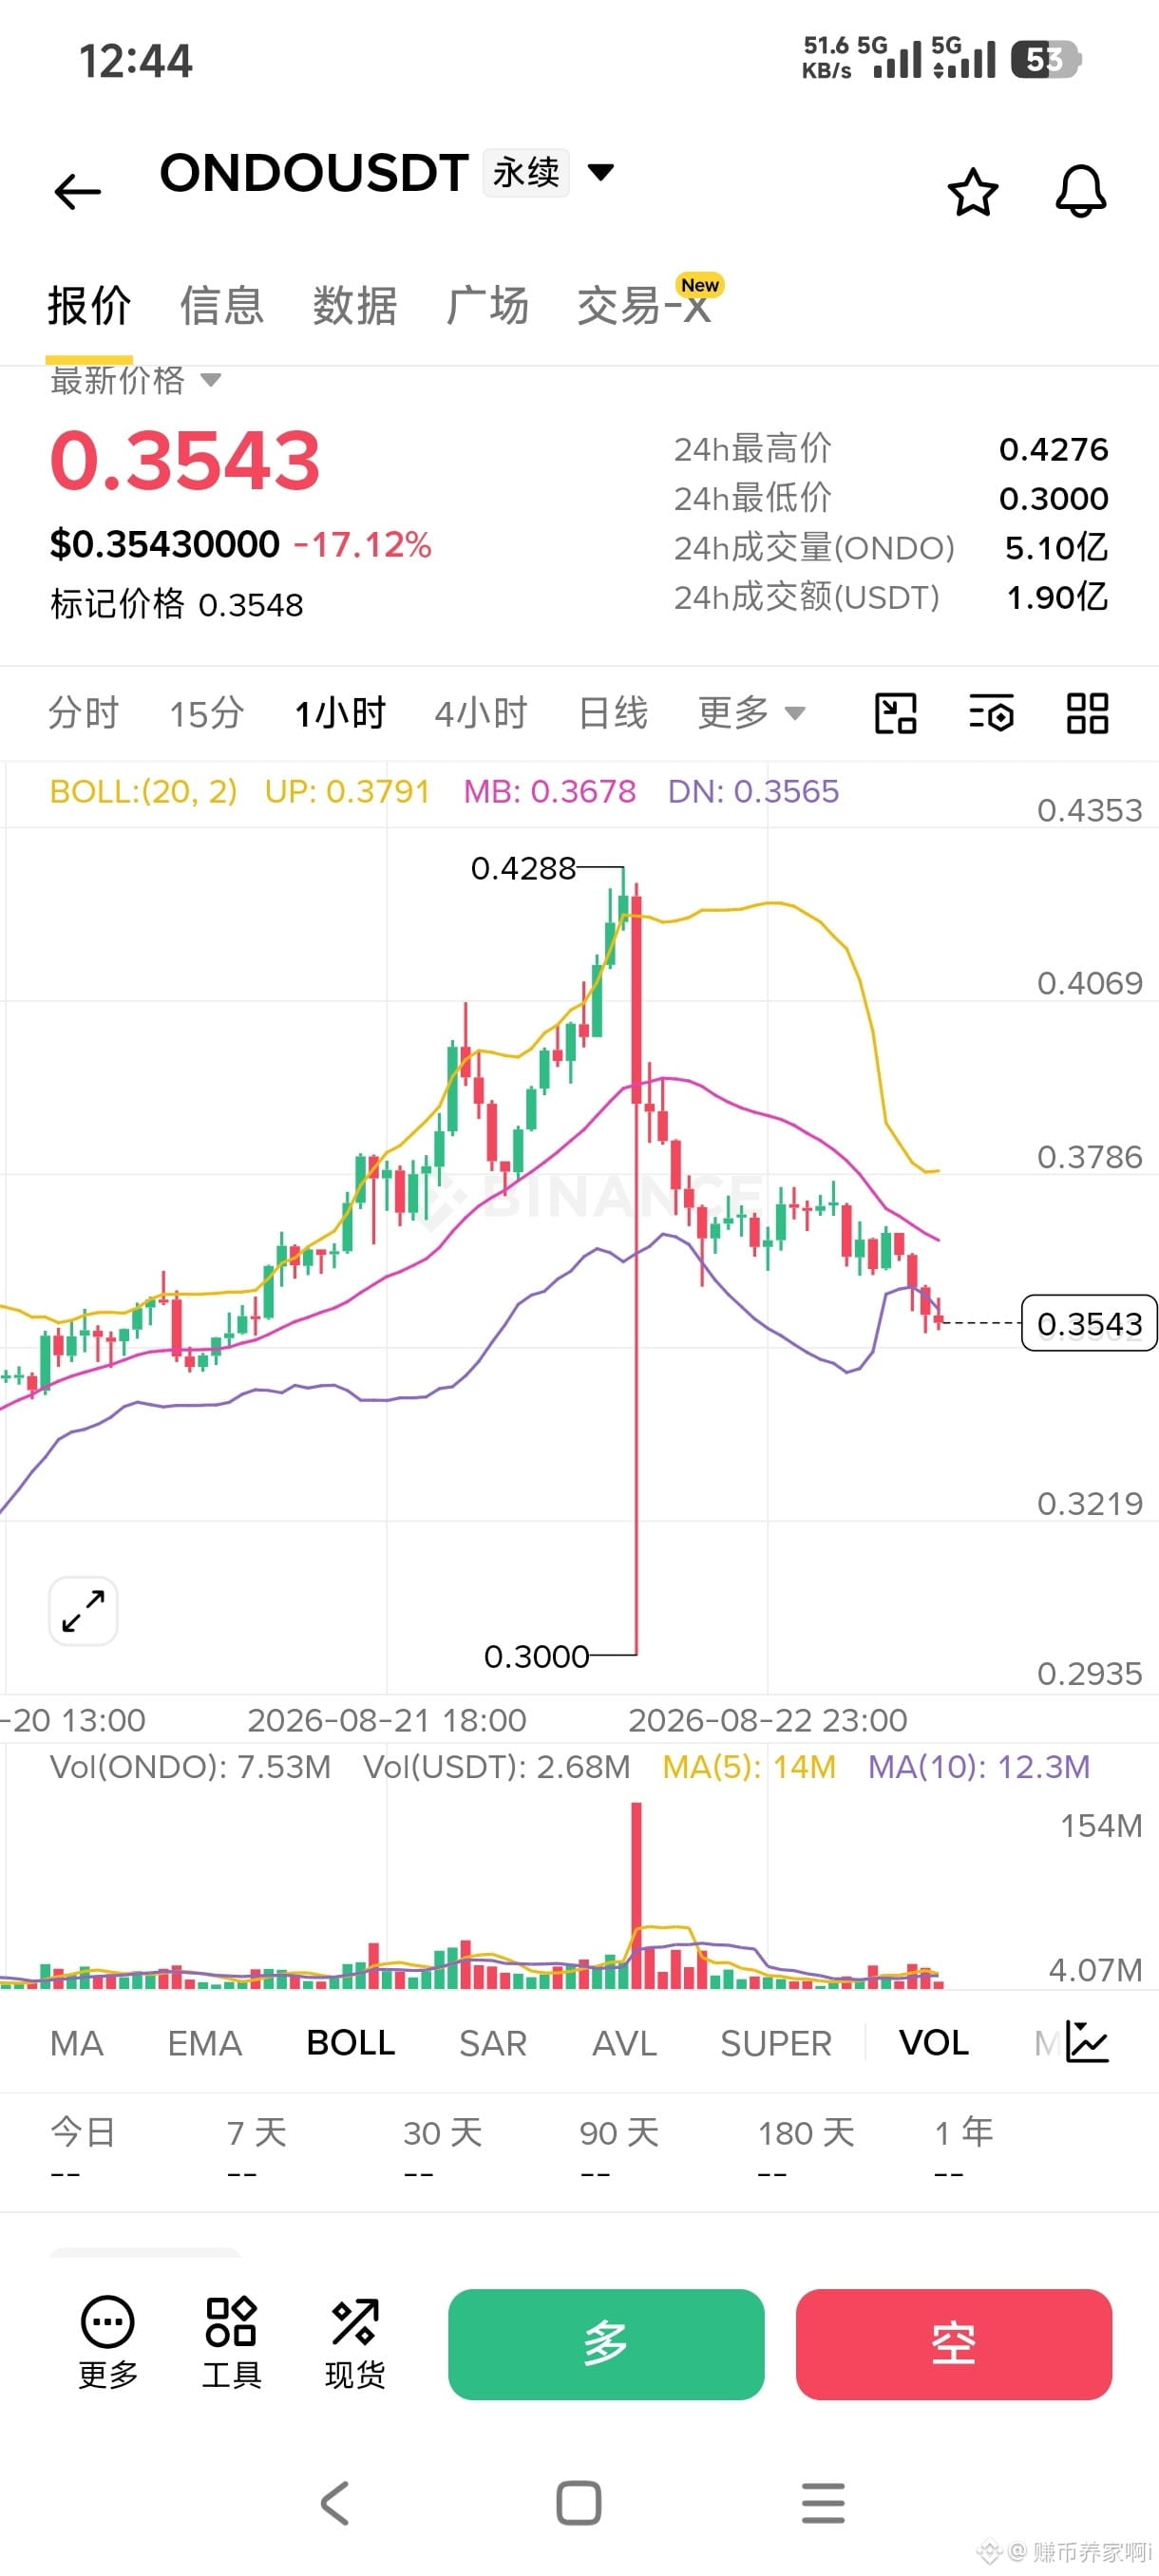
$ONDO On an hourly chart, you can see a typical pin-sweep shakeout pattern: the price spikes up to 0.4288 and is quickly smashed down to 0.3000. After a rapid, violent sell-off, the price rebounds somewhat.
After a big surge, the main fund flows concentratedly leave the market. A single long lower shadow washes out a large amount of positions. The rebound does not manage to reclaim the previous high area; the Bollinger Bands begin to turn downward, the highs keep stepping lower, and the overall market looks weak.
For coins that have shown such extreme pin-sweep behavior, the行情 (market action) will be highly unstable. Chasing a bottom is risky—seeing the price drop a lot and then going long often makes it easy to experience another round of further downside.
A rebound into resistance is pressure. Don’t subjectively assume that since it has already fallen, it will definitely rebound. After capital has fled, it will continue to grind lower for a while.
When placing trades, try to wait for the rebound to reach a resistance level before participating, and don’t catch falling knives. At the same time, set stop-loss levels with enough room to avoid getting caught if another extreme pin-sweep occurs.
After a big surge, the main fund flows concentratedly leave the market. A single long lower shadow washes out a large amount of positions. The rebound does not manage to reclaim the previous high area; the Bollinger Bands begin to turn downward, the highs keep stepping lower, and the overall market looks weak.
For coins that have shown such extreme pin-sweep behavior, the行情 (market action) will be highly unstable. Chasing a bottom is risky—seeing the price drop a lot and then going long often makes it easy to experience another round of further downside.
A rebound into resistance is pressure. Don’t subjectively assume that since it has already fallen, it will definitely rebound. After capital has fled, it will continue to grind lower for a while.
When placing trades, try to wait for the rebound to reach a resistance level before participating, and don’t catch falling knives. At the same time, set stop-loss levels with enough room to avoid getting caught if another extreme pin-sweep occurs.
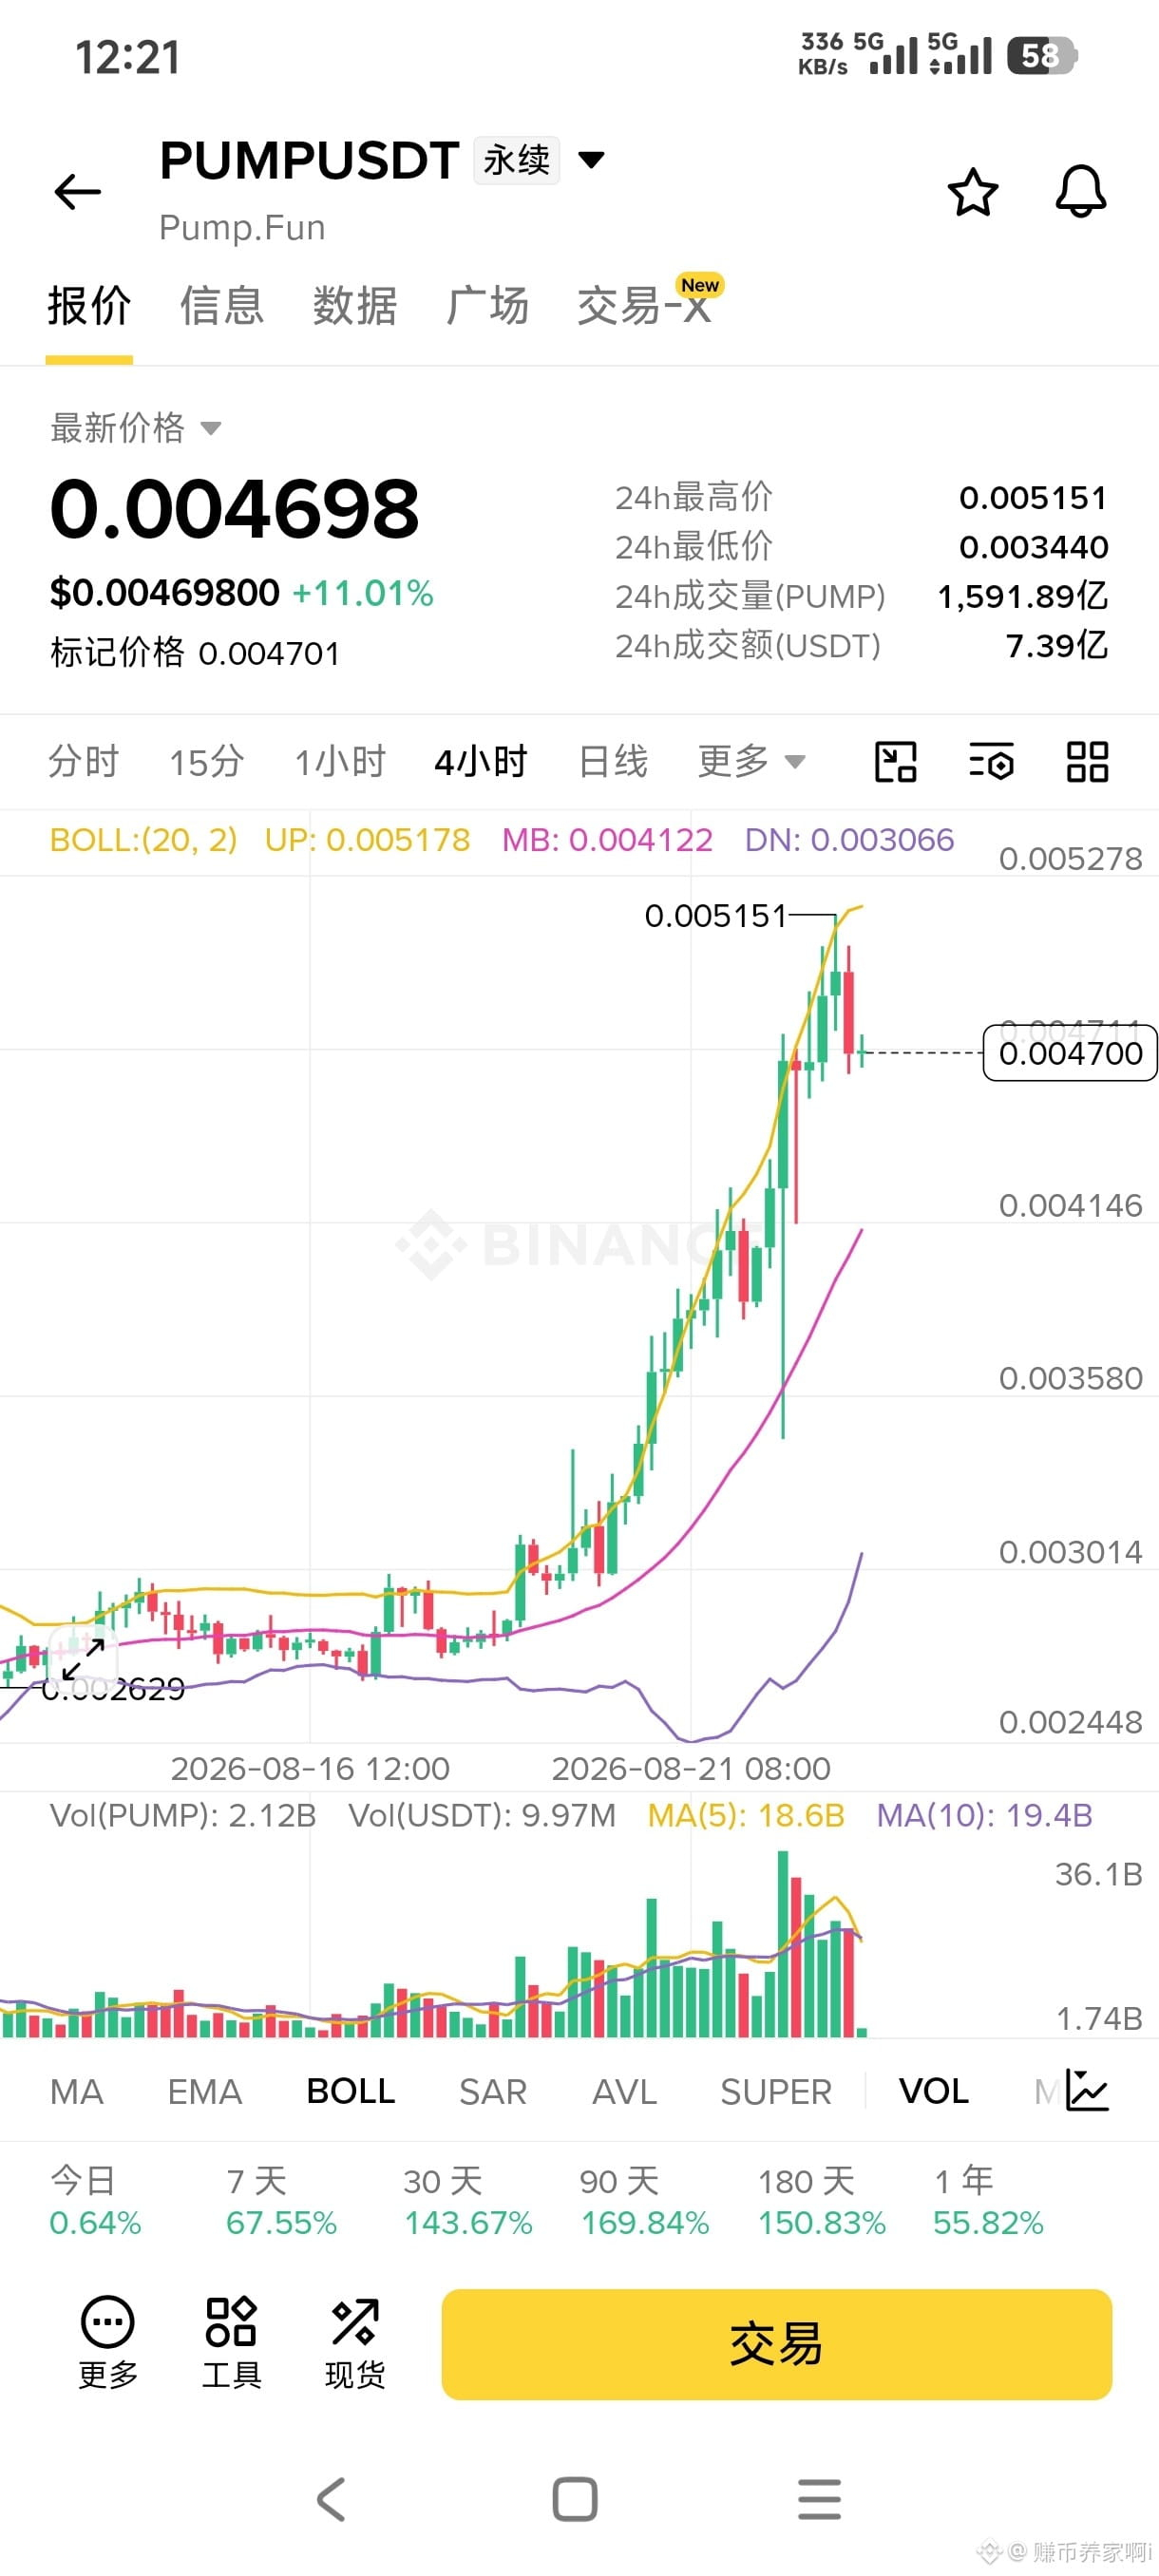
$$PUMP Current order book situation: 4 hours of continuous aggressive surge. After spiking to 0.005151, it pulled back and retested the Bollinger middle band. Overall moving averages are trending upward. This is a short-term shakeout after a big surge. The coin’s price swings are extremely volatile, and needle-like wicks occur very frequently.
Direction: Only go long; don’t touch shorts
Opening range: 0.00410–0.00425
Leverage: 2–3x
Stop loss: 0.00360. If the mark price validly breaks down, exit immediately.
First target: Around 0.00510, the previous high resistance area. When reached, reduce position first.
Second target: If the price breaks above the previous high, it opens up more upside space.
Practical points:
1. The coin is wildly volatile; do not participate with a heavy position. Slippage on market orders will be very noticeable—prefer limit orders.
2. Use conditional orders triggered by the mark price to avoid being swept out by momentary wicks.
3. If it directly breaks down below 0.004122, the Bollinger middle band, abandon this long and don’t hold through losses.
4. For assets that have had a sudden blowout, reversals happen very fast. Once profits reach the target area, actively take profits. $PUMP
Direction: Only go long; don’t touch shorts
Opening range: 0.00410–0.00425
Leverage: 2–3x
Stop loss: 0.00360. If the mark price validly breaks down, exit immediately.
First target: Around 0.00510, the previous high resistance area. When reached, reduce position first.
Second target: If the price breaks above the previous high, it opens up more upside space.
Practical points:
1. The coin is wildly volatile; do not participate with a heavy position. Slippage on market orders will be very noticeable—prefer limit orders.
2. Use conditional orders triggered by the mark price to avoid being swept out by momentary wicks.
3. If it directly breaks down below 0.004122, the Bollinger middle band, abandon this long and don’t hold through losses.
4. For assets that have had a sudden blowout, reversals happen very fast. Once profits reach the target area, actively take profits. $PUMP
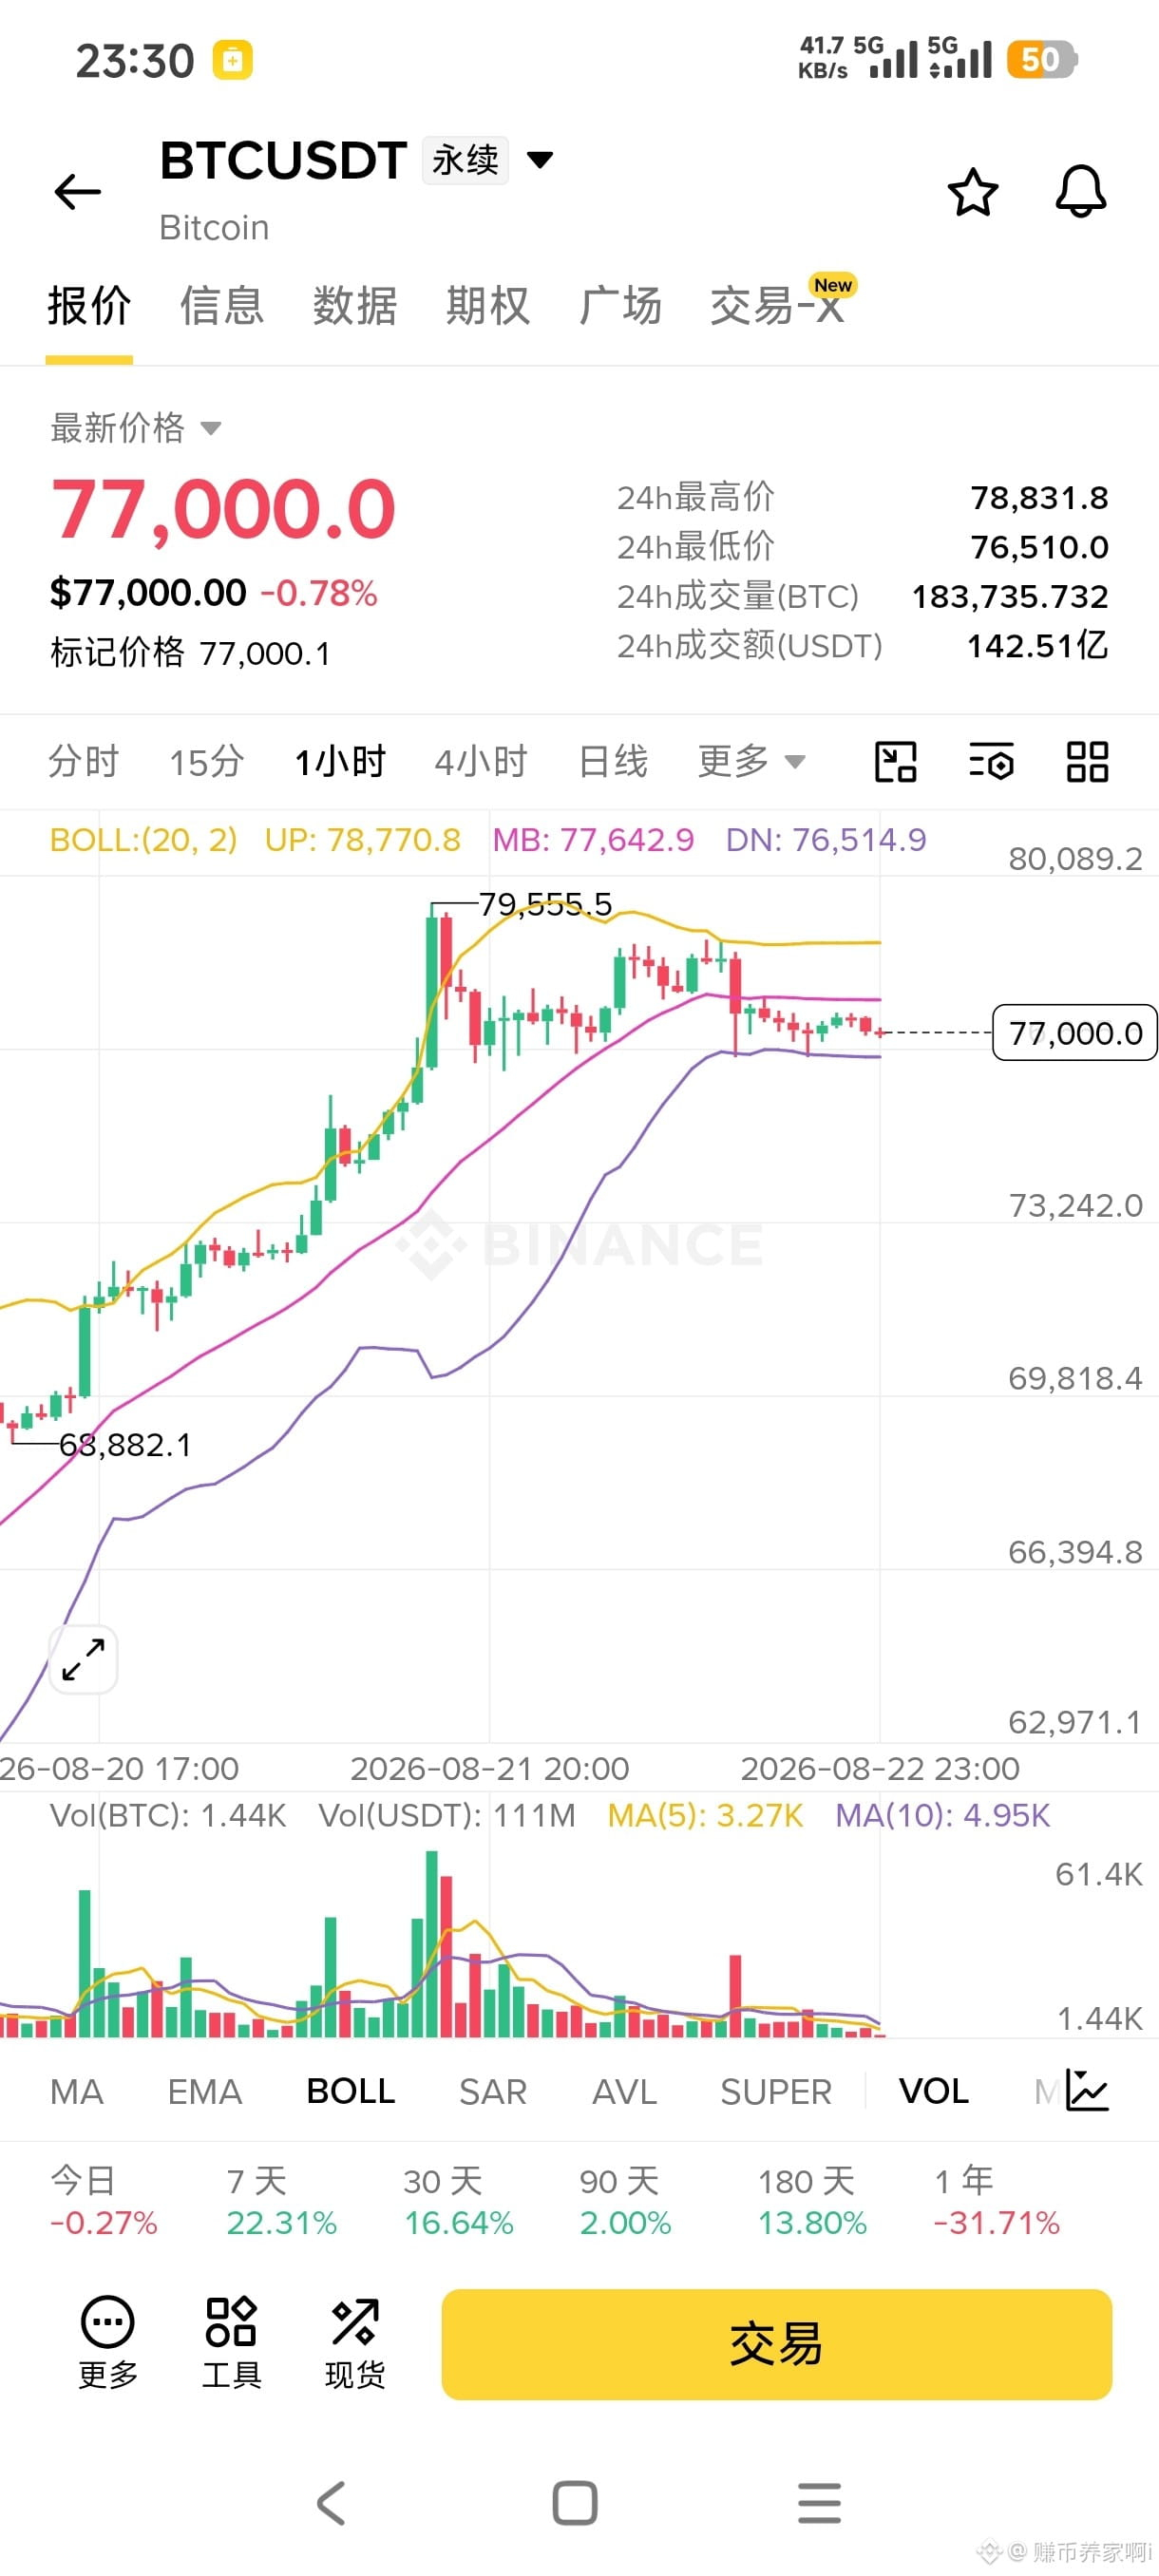
$BTC hour-level, after spiking up to 79555.5 it gradually pulled back, and is now ranging around the Bollinger midline.
Conditions for a bullish move: if the price holds above 77640, the long side will have a chance to once again test the overhead resistance zone around 78770‑79550 to open up upward room.
Conditions for a weakening market: a valid breakdown below 76510 would break the short-term upward momentum, and price would further seek support to the downside.
Right now, it is a high-level sideways consolidation after a big rally, with no clear direction.
Upward: the previous highs face very heavy selling pressure. Downward: buy orders below provide support; for now it is a tug-of-war between bulls and bears.
In this kind of phase, don’t make subjective bets on a one-way move. As long as key support and resistance levels are not broken, the probability is high that price will keep oscillating and washing out. Rushing to open positions makes it easy to get swept back and forth.
Only after a breakout or a breakdown of key levels will a clear trend emerge.$BTC
Conditions for a bullish move: if the price holds above 77640, the long side will have a chance to once again test the overhead resistance zone around 78770‑79550 to open up upward room.
Conditions for a weakening market: a valid breakdown below 76510 would break the short-term upward momentum, and price would further seek support to the downside.
Right now, it is a high-level sideways consolidation after a big rally, with no clear direction.
Upward: the previous highs face very heavy selling pressure. Downward: buy orders below provide support; for now it is a tug-of-war between bulls and bears.
In this kind of phase, don’t make subjective bets on a one-way move. As long as key support and resistance levels are not broken, the probability is high that price will keep oscillating and washing out. Rushing to open positions makes it easy to get swept back and forth.
Only after a breakout or a breakdown of key levels will a clear trend emerge.$BTC
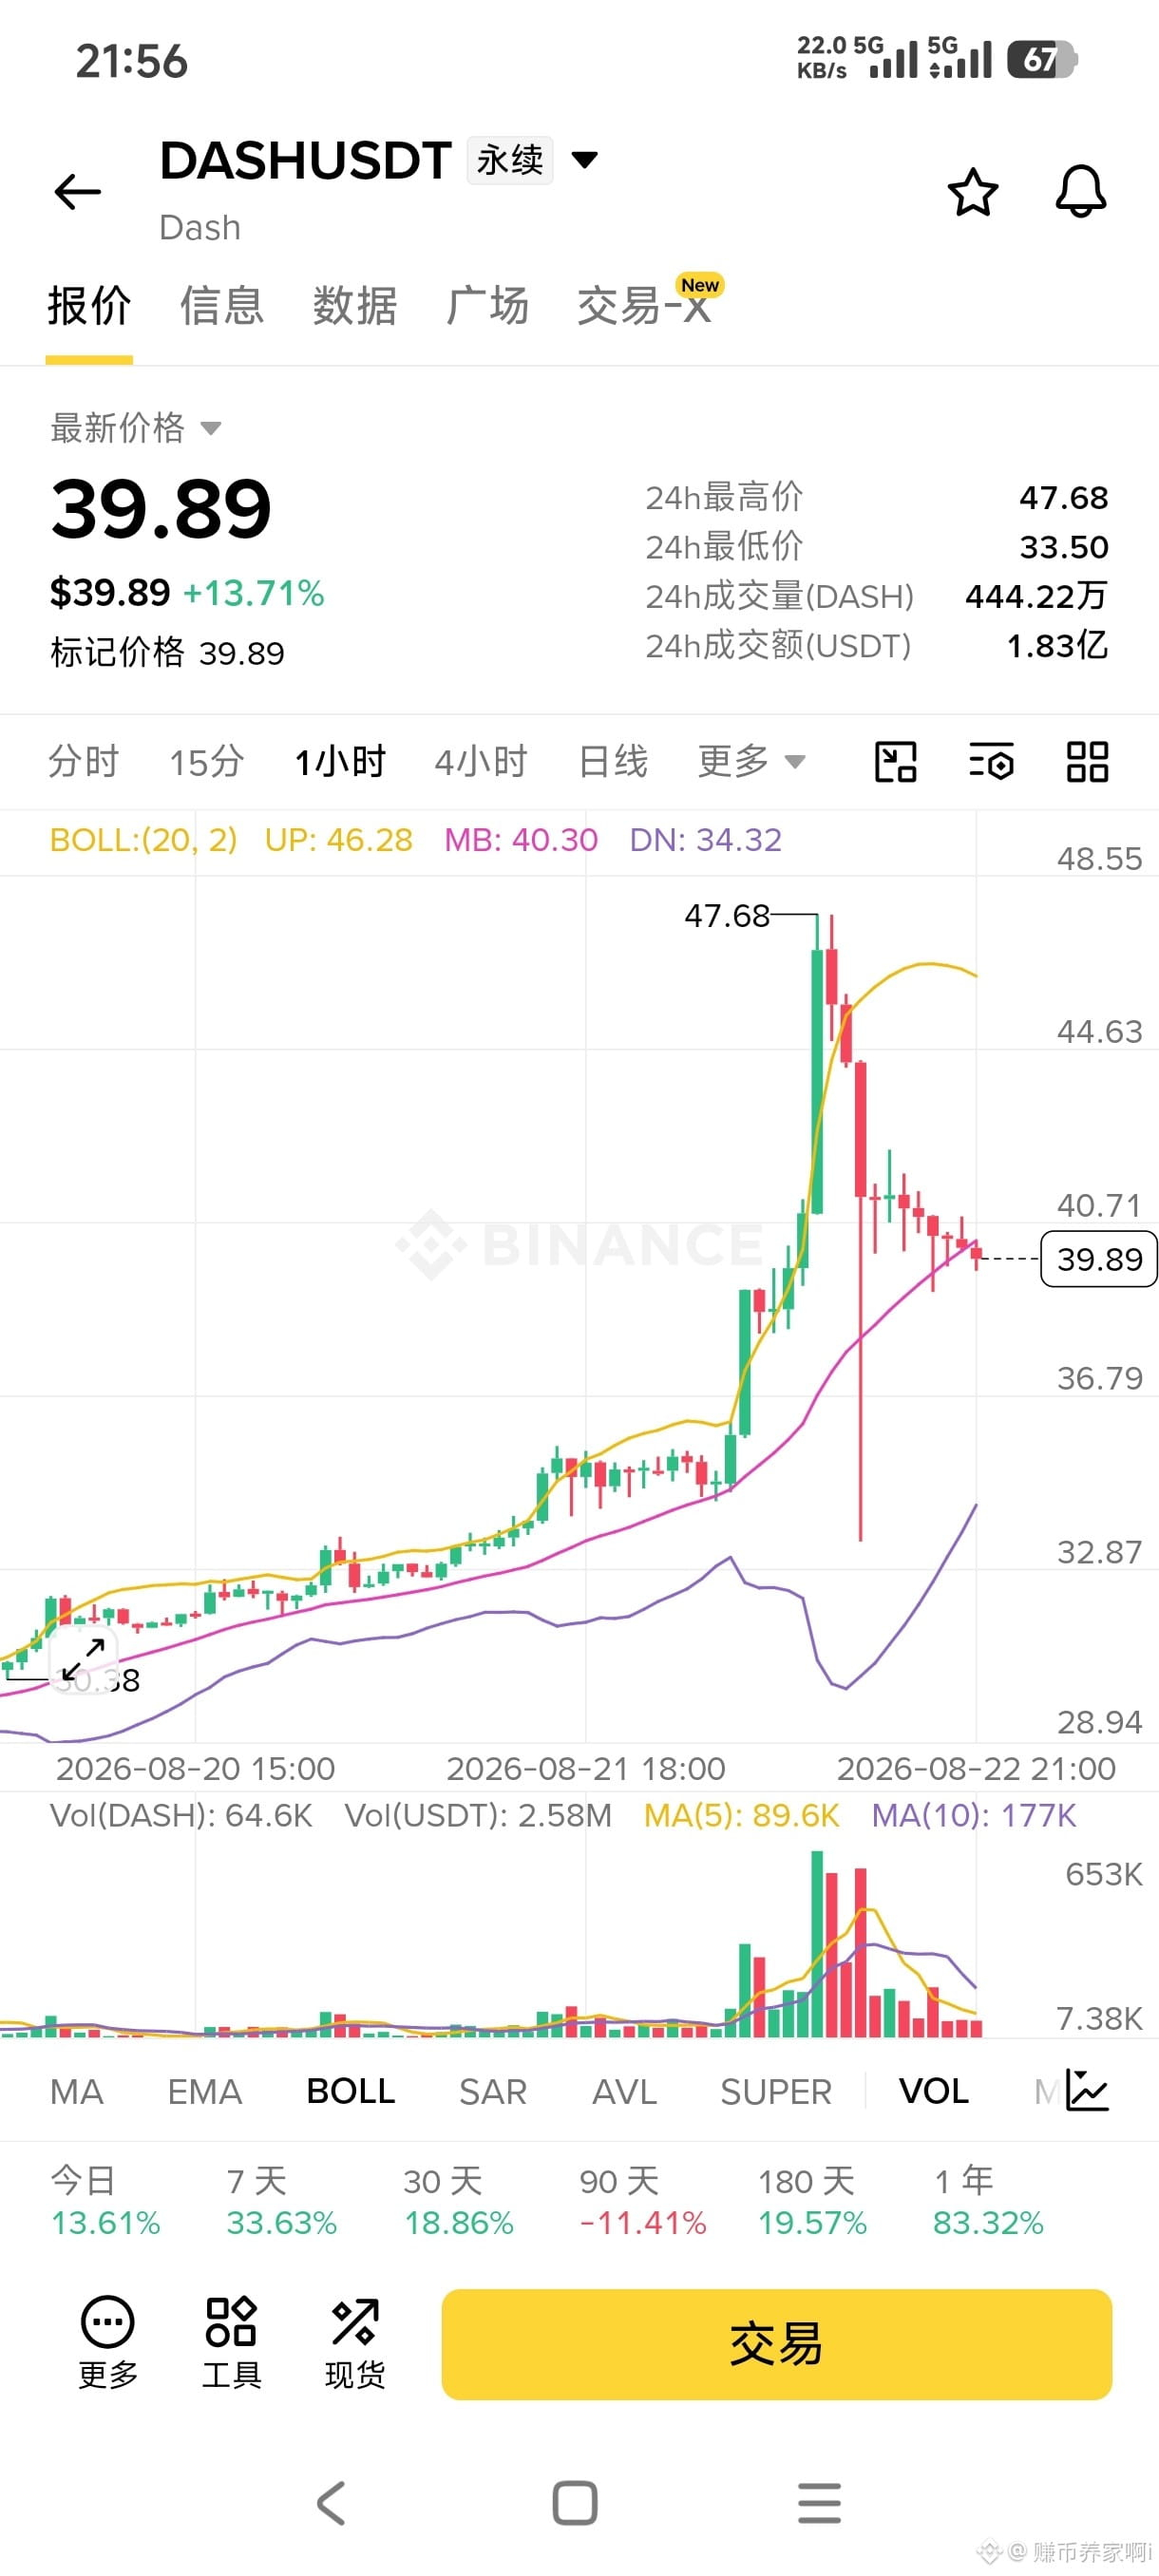
$DASH Seeing the DASH candle that surged high then pulled back, I feel especially strongly about it. I already suffered a loss like this before—when a coin does a sudden spike.
A violent rally pushed straight up to 47.68, then turned around and a big bearish candle slammed down hard. In the middle, there was also a very deep lower wick. Many people see a big rise and get carried away; they watch the momentum and chase in. The result is that the moment they enter, the profit-taking crowd collectively bails out, and they get trapped instantly.
Looking at the market right now: after a violent surge comes a consolidation phase where the move is digested. Don’t rush to enter a heavy position. In this kind of行情 right after a burst of volume, sweeping the order book with back-and-forth wick pokes is normal. If you do choose to participate, make sure leverage is kept very low. Beforehand, decide in your mind the maximum loss you can tolerate—then, once price reaches your level, exit decisively. Don’t stubbornly hold and “die-carry.”
A big rally doesn’t mean it will keep going up. Even if your paper profits look great, if they don’t get realized, they don’t belong to you. $DASH
A violent rally pushed straight up to 47.68, then turned around and a big bearish candle slammed down hard. In the middle, there was also a very deep lower wick. Many people see a big rise and get carried away; they watch the momentum and chase in. The result is that the moment they enter, the profit-taking crowd collectively bails out, and they get trapped instantly.
Looking at the market right now: after a violent surge comes a consolidation phase where the move is digested. Don’t rush to enter a heavy position. In this kind of行情 right after a burst of volume, sweeping the order book with back-and-forth wick pokes is normal. If you do choose to participate, make sure leverage is kept very low. Beforehand, decide in your mind the maximum loss you can tolerate—then, once price reaches your level, exit decisively. Don’t stubbornly hold and “die-carry.”
A big rally doesn’t mean it will keep going up. Even if your paper profits look great, if they don’t get realized, they don’t belong to you. $DASH
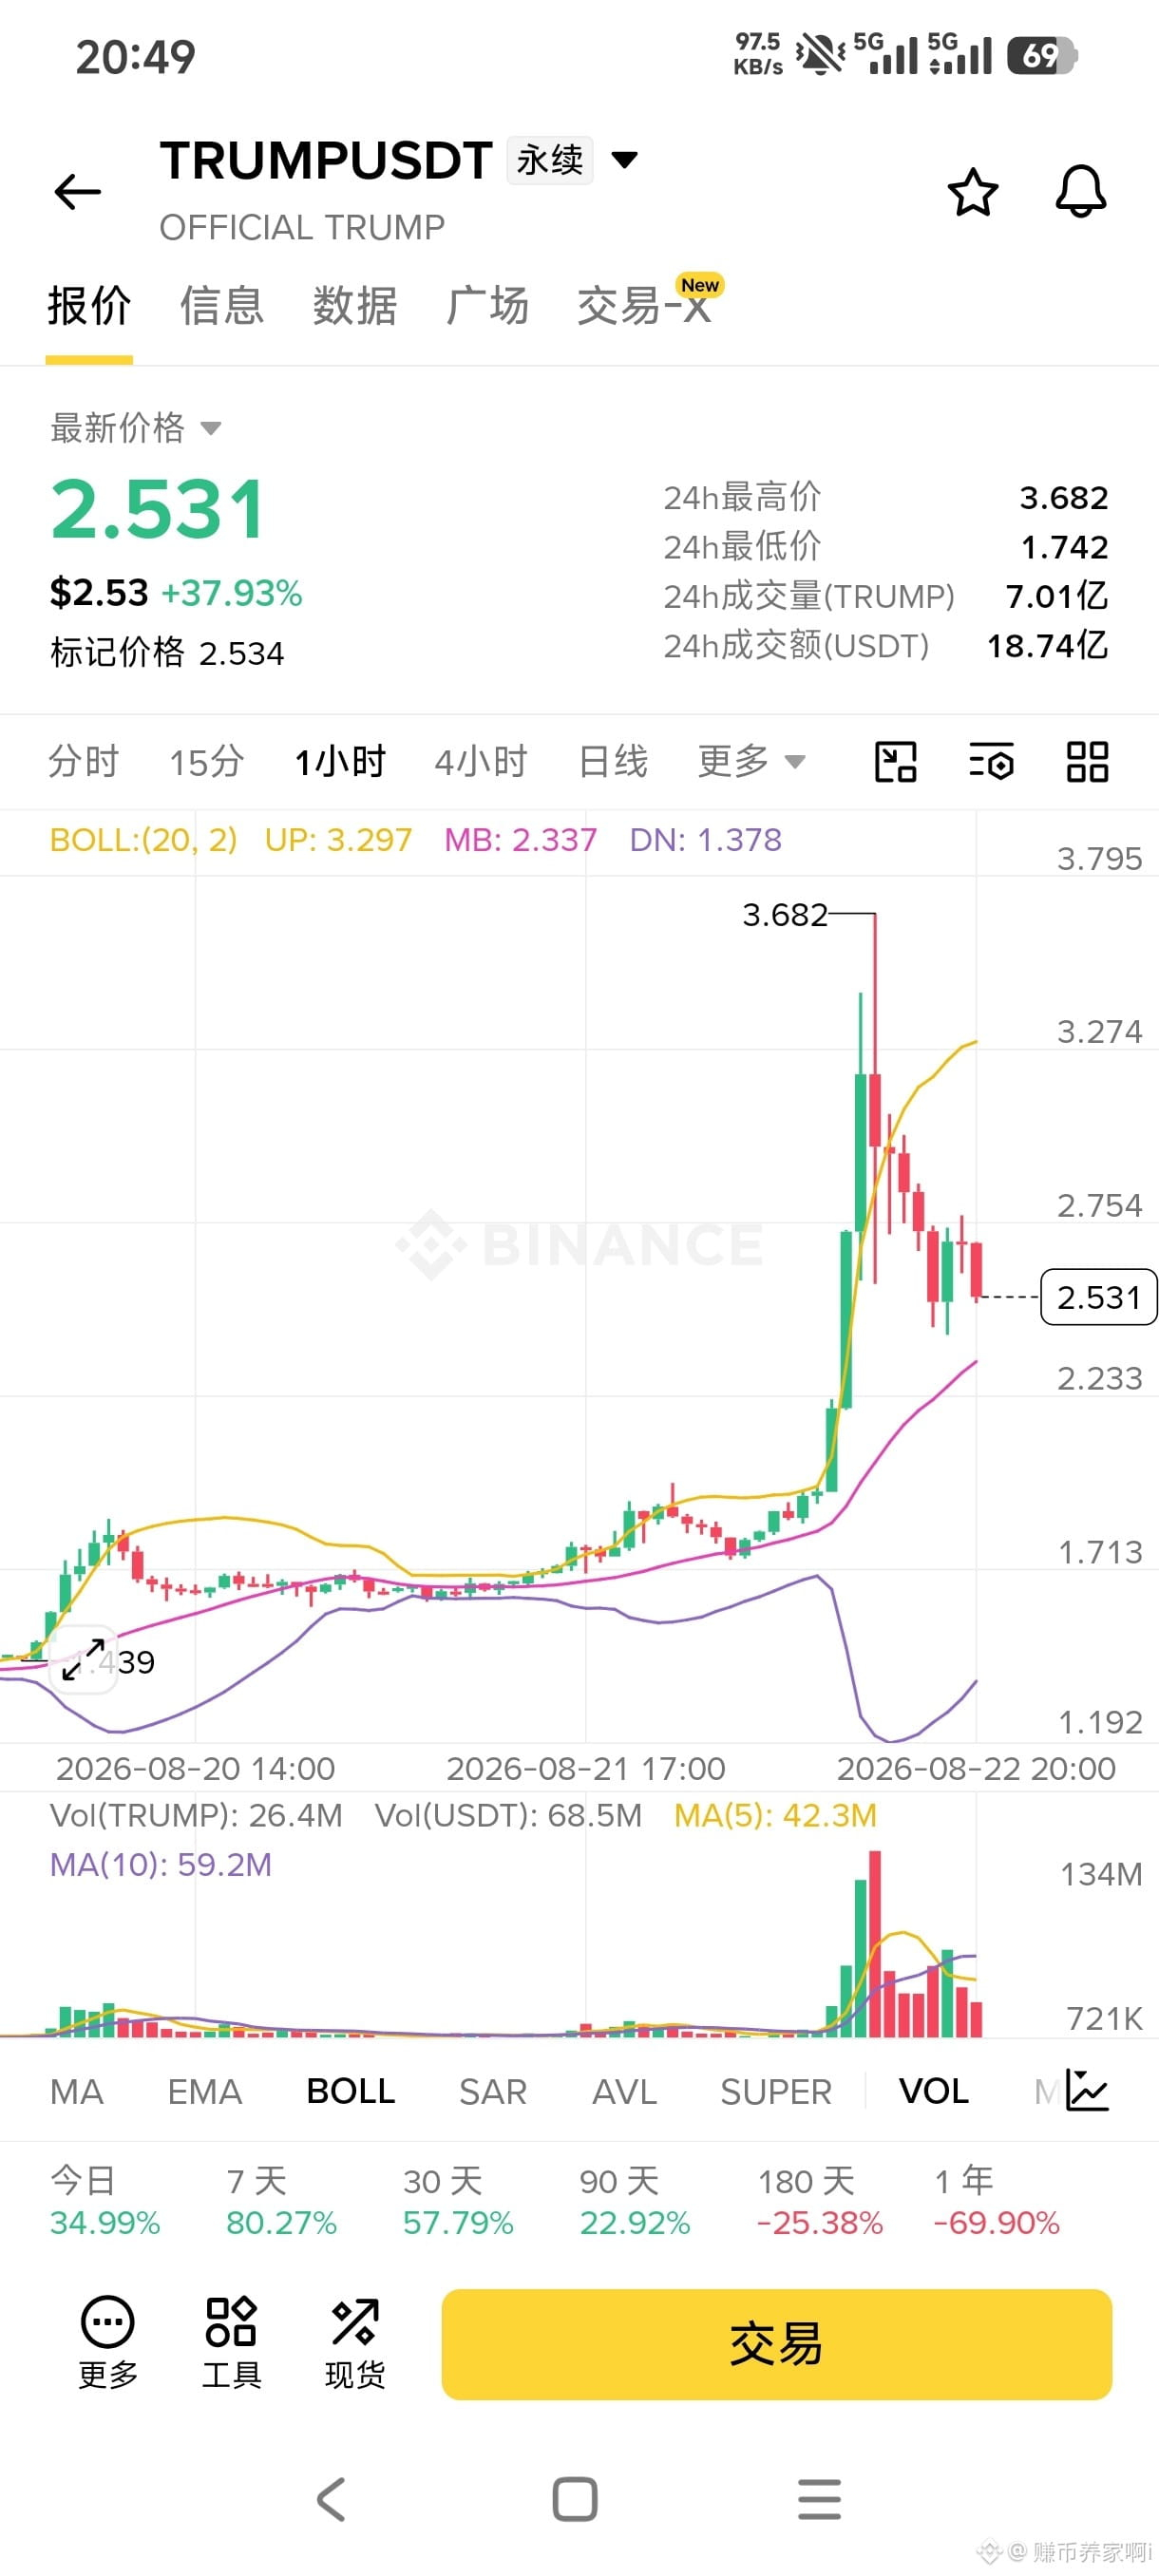
$TRUMP
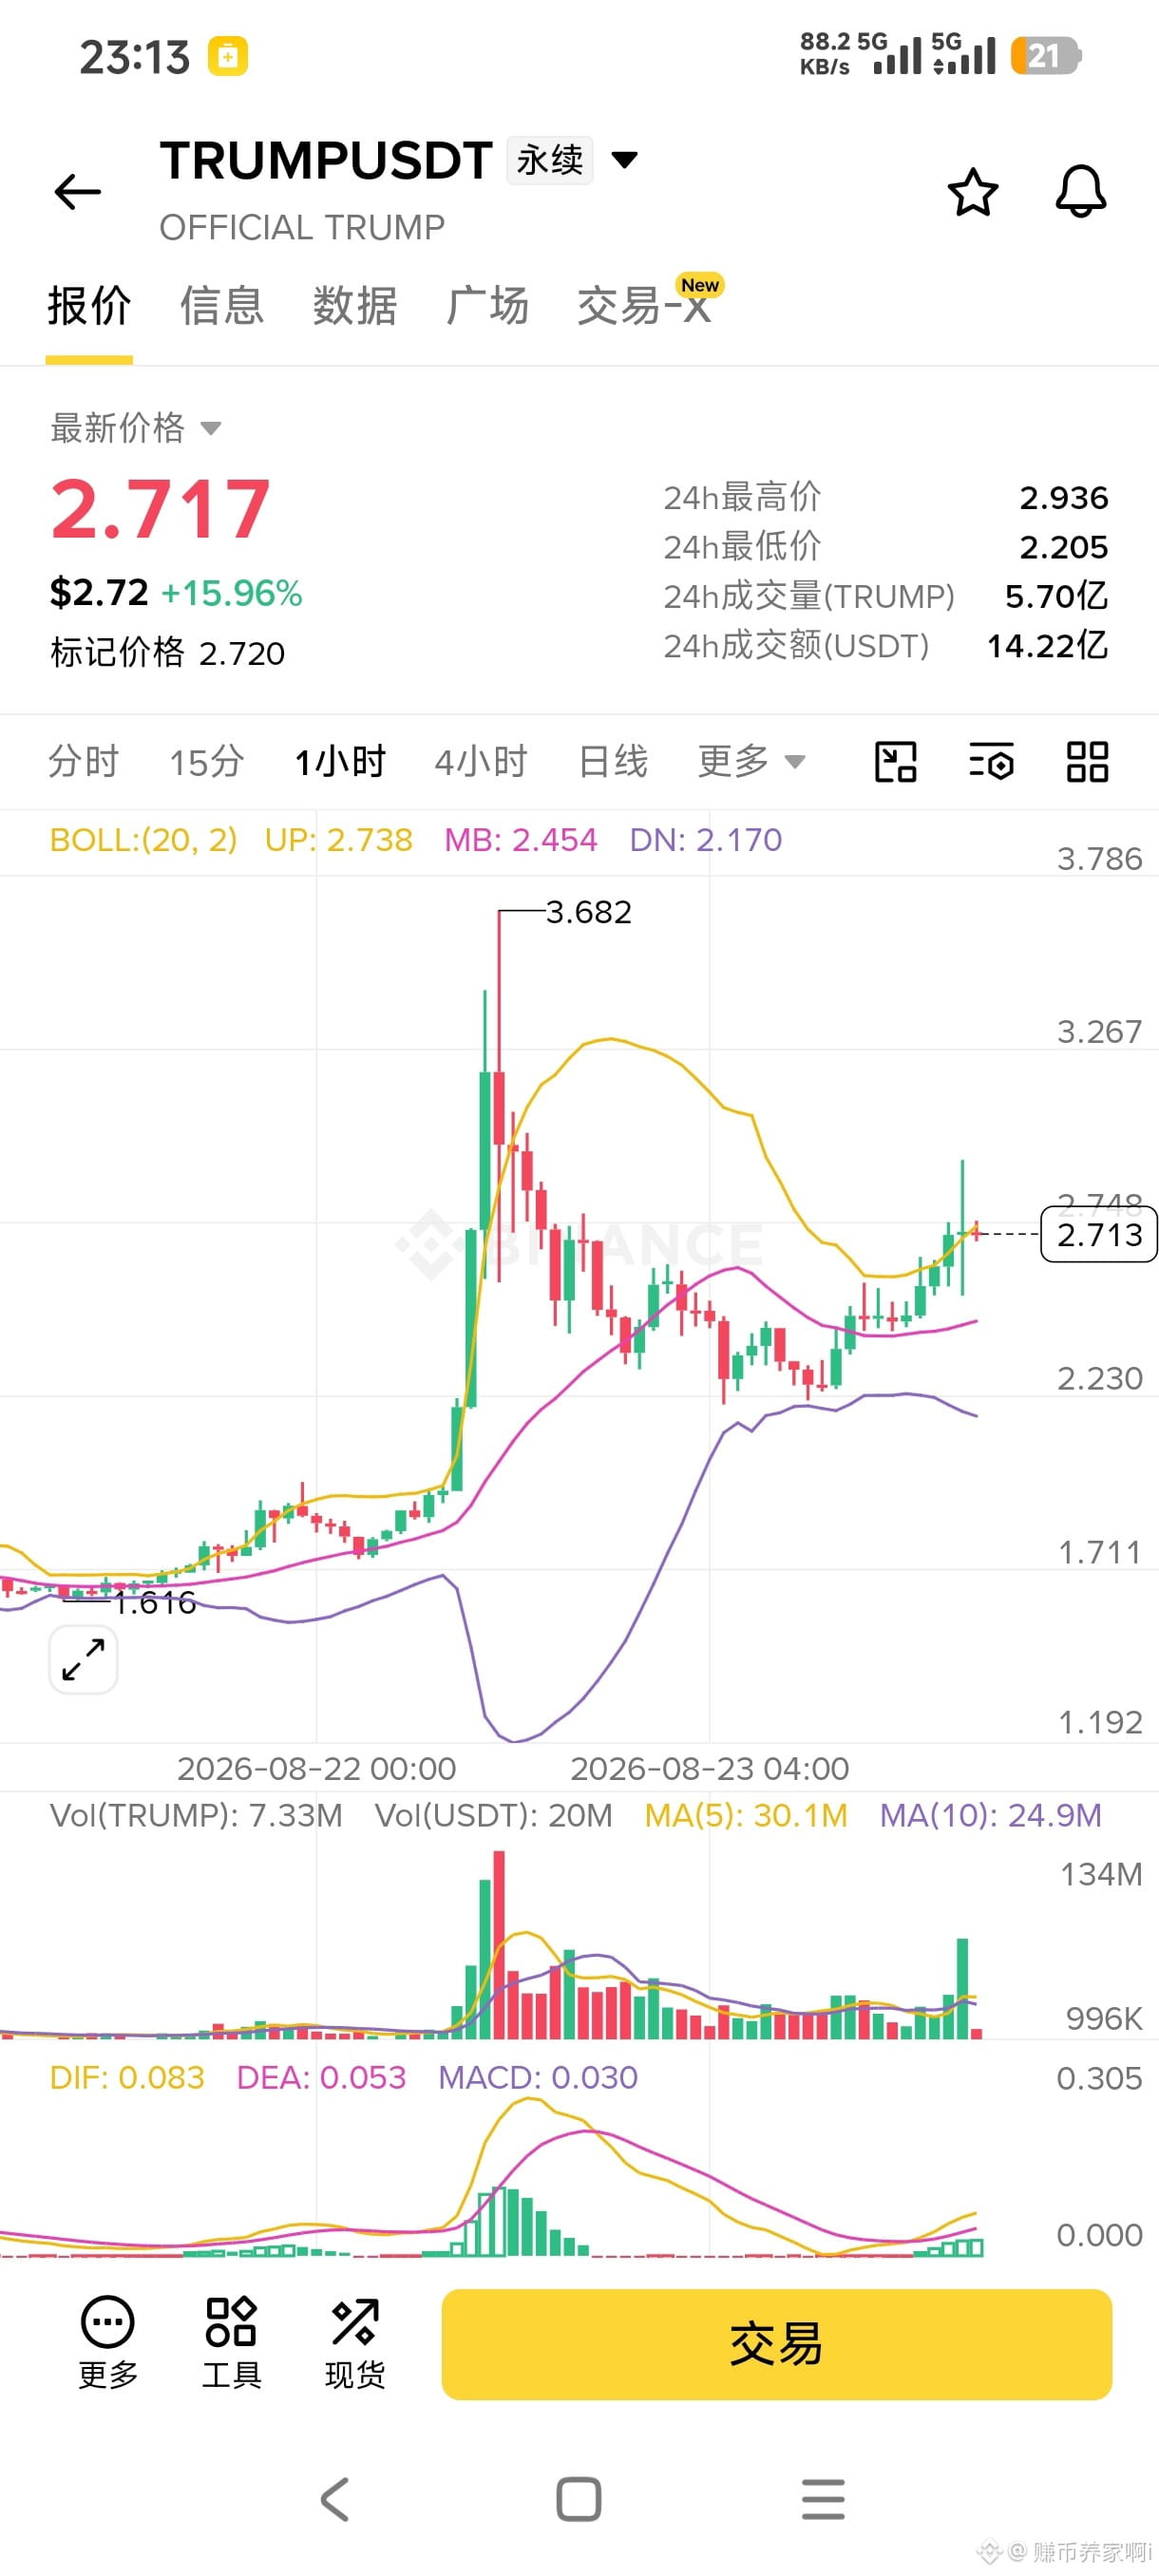
Market situation: On the 1-hour timeframe, it surged sharply and spiked up to 3.682, then dropped back significantly. This is a pullback and washout after a violent breakout. Overall moving averages remain trending upward. Meme coin funding/positioning is in fierce competition; wick spikes will be very frequent.
Direction: Only go long; don’t short.
Entry range: 2.42–2.50
Leverage: 2–3x. Meme coins must not be used with high leverage.
Stop loss: 2.20. If the mark price effectively breaks below it, this long setup’s structure is invalidated—exit immediately.
First target: 2.90–2.98. Near the upper Bollinger band resistance zone; when it reaches there, reduce position first.
Second target: Probe the previous high again around 3.68.
Trading reminders:
1. This coin is extremely volatile; upward/downward wick spikes are the norm. You must control your position size—never go in heavy/overallocate.
2. For conditional orders, choose triggers based on the mark price to avoid getting stopped out by brief, momentary wick sweeps.
3. If it directly breaks below 2.337 (the Bollinger middle band), immediately give up this long position—don’t stubbornly hold and force a rebound.
4. With high market volatility, slippage on market orders will be very large. Prefer limit orders for execution.
Meme coin trading is all about funding sentiment; it’s only suitable for participating with a small position size. Don’t go heavy and bet on major moves.$TRUMP
Market situation: On the 1-hour timeframe, it surged sharply and spiked up to 3.682, then dropped back significantly. This is a pullback and washout after a violent breakout. Overall moving averages remain trending upward. Meme coin funding/positioning is in fierce competition; wick spikes will be very frequent.
Direction: Only go long; don’t short.
Entry range: 2.42–2.50
Leverage: 2–3x. Meme coins must not be used with high leverage.
Stop loss: 2.20. If the mark price effectively breaks below it, this long setup’s structure is invalidated—exit immediately.
First target: 2.90–2.98. Near the upper Bollinger band resistance zone; when it reaches there, reduce position first.
Second target: Probe the previous high again around 3.68.
Trading reminders:
1. This coin is extremely volatile; upward/downward wick spikes are the norm. You must control your position size—never go in heavy/overallocate.
2. For conditional orders, choose triggers based on the mark price to avoid getting stopped out by brief, momentary wick sweeps.
3. If it directly breaks below 2.337 (the Bollinger middle band), immediately give up this long position—don’t stubbornly hold and force a rebound.
4. With high market volatility, slippage on market orders will be very large. Prefer limit orders for execution.
Meme coin trading is all about funding sentiment; it’s only suitable for participating with a small position size. Don’t go heavy and bet on major moves.$TRUMP
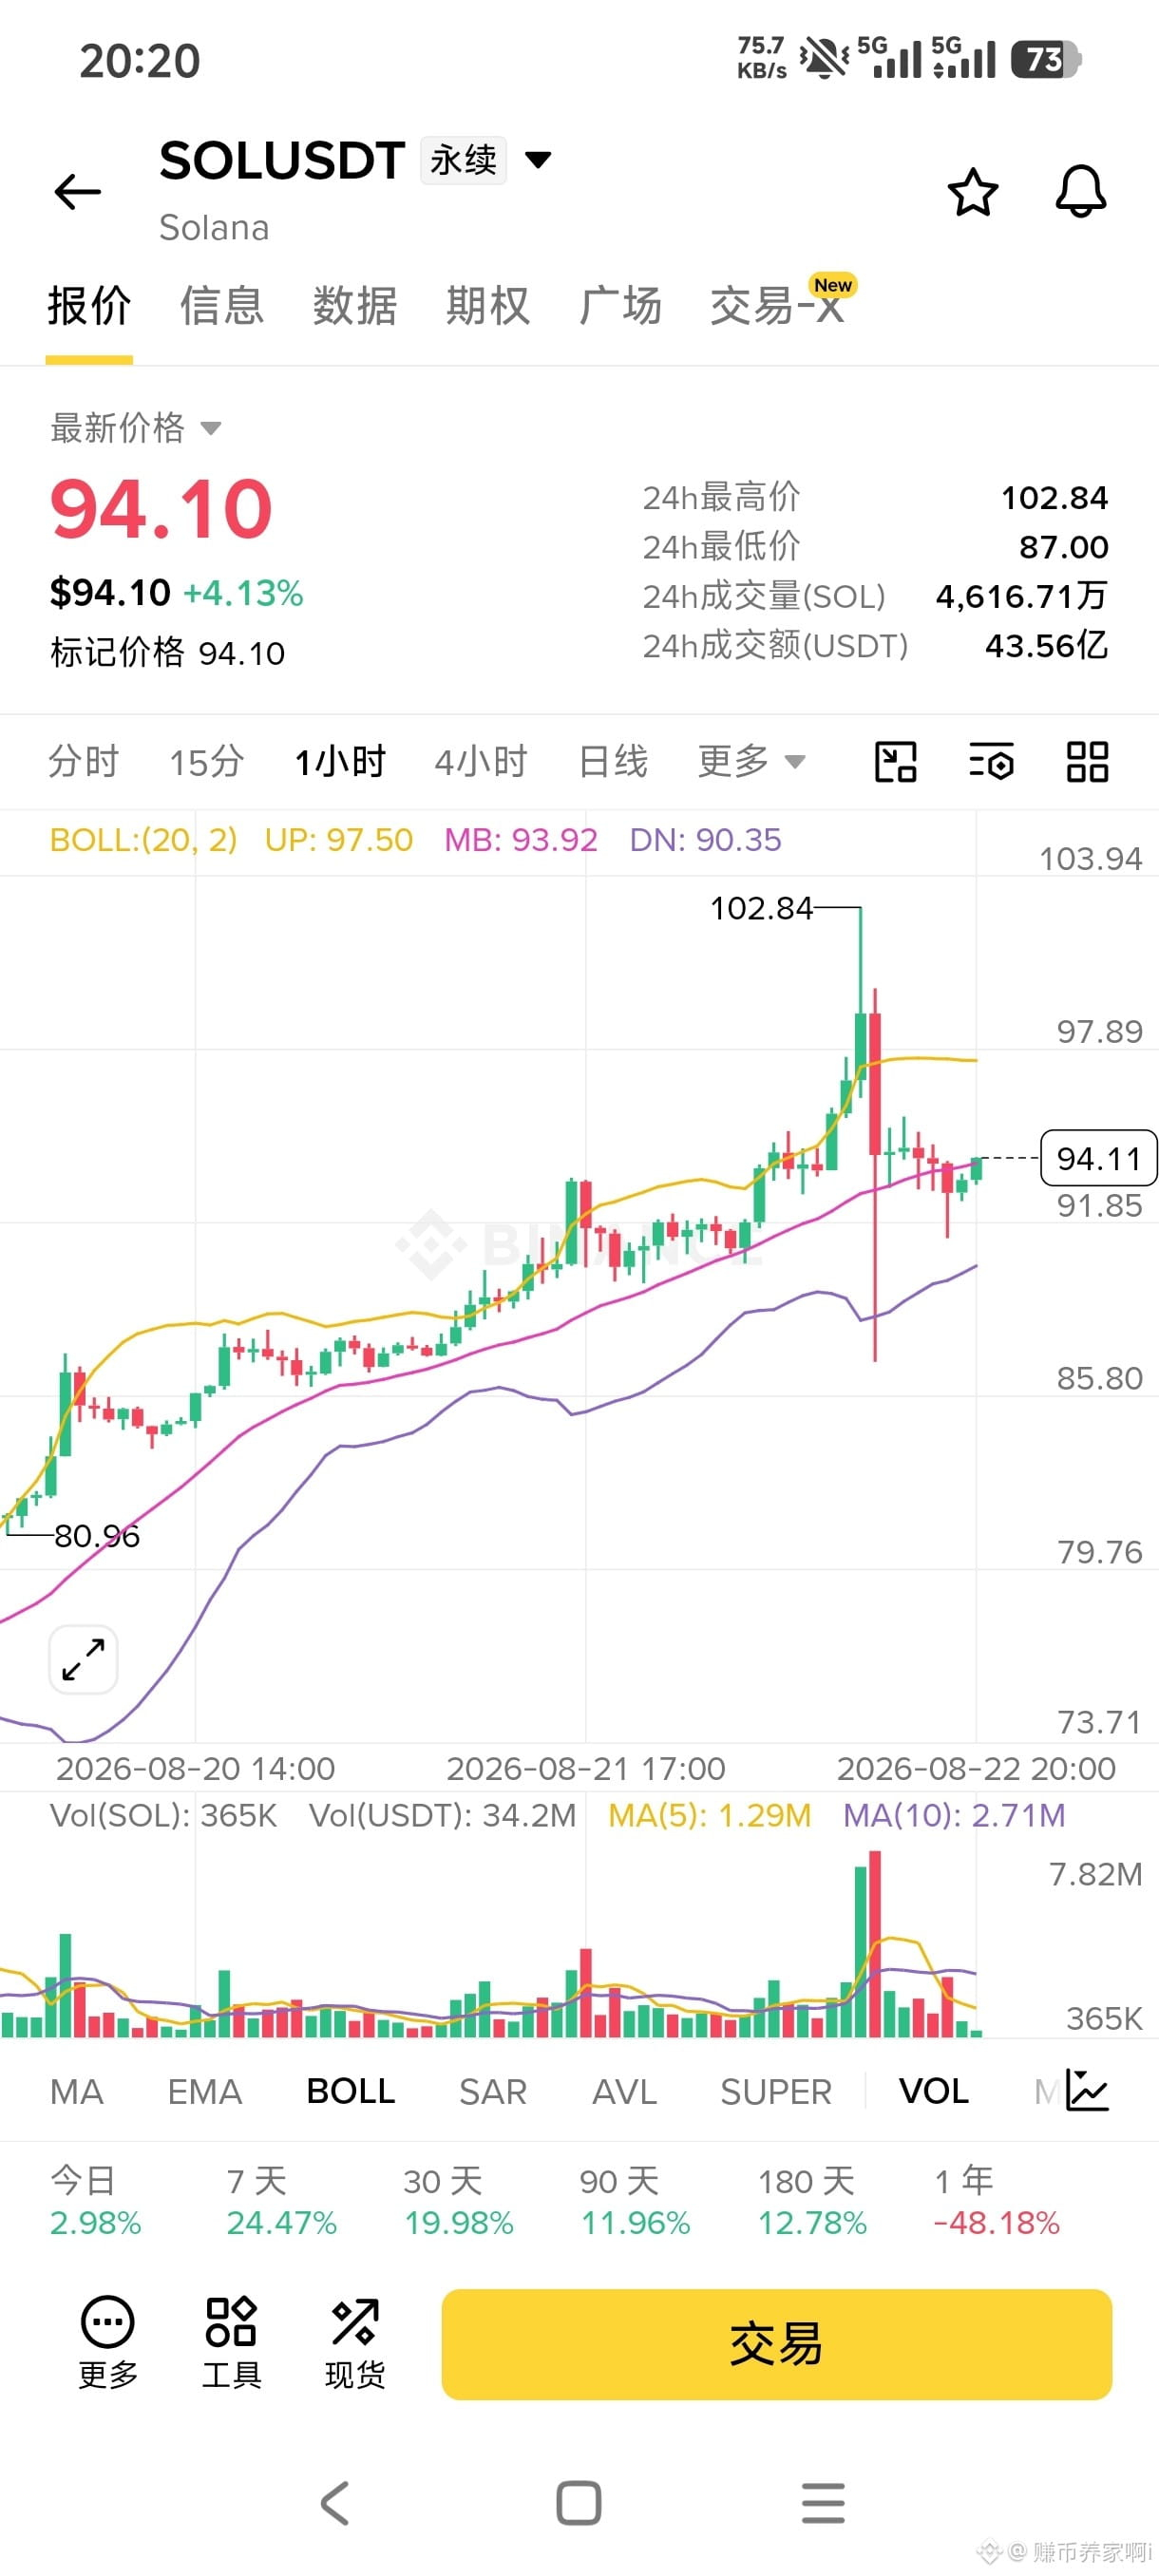
$SOL Market status: In the last 1 hour, there was a spike up of 102.84 with a long upper wick that hammered the market. It then retraced to the middle Bollinger Band. The overall trend remains upward. This is the consolidation/recovery phase after a big surge.
Direction: Long
Entry range: 93.4–94.2
Leverage: 2–5x
Stop loss: 89.8. If the closing/mark price breaks down and is validly below this level, the uptrend structure is invalid—exit immediately.
First target: 97–97.5 (Bollinger upper band resistance; you can reduce part of the position here)
Second target: test the previous high around 102
Execution notes:
1. After a violent spike/pin, the price is very likely to sweep back and forth—strictly avoid increasing leverage.
2. Use conditional orders triggered by the mark price to avoid false triggers caused by instantaneous wick spikes.
3. If support at 90.35 is directly broken, immediately give up this long trade—don’t stubbornly hold losses. $SOL
Direction: Long
Entry range: 93.4–94.2
Leverage: 2–5x
Stop loss: 89.8. If the closing/mark price breaks down and is validly below this level, the uptrend structure is invalid—exit immediately.
First target: 97–97.5 (Bollinger upper band resistance; you can reduce part of the position here)
Second target: test the previous high around 102
Execution notes:
1. After a violent spike/pin, the price is very likely to sweep back and forth—strictly avoid increasing leverage.
2. Use conditional orders triggered by the mark price to avoid false triggers caused by instantaneous wick spikes.
3. If support at 90.35 is directly broken, immediately give up this long trade—don’t stubbornly hold losses. $SOL
$AAVE
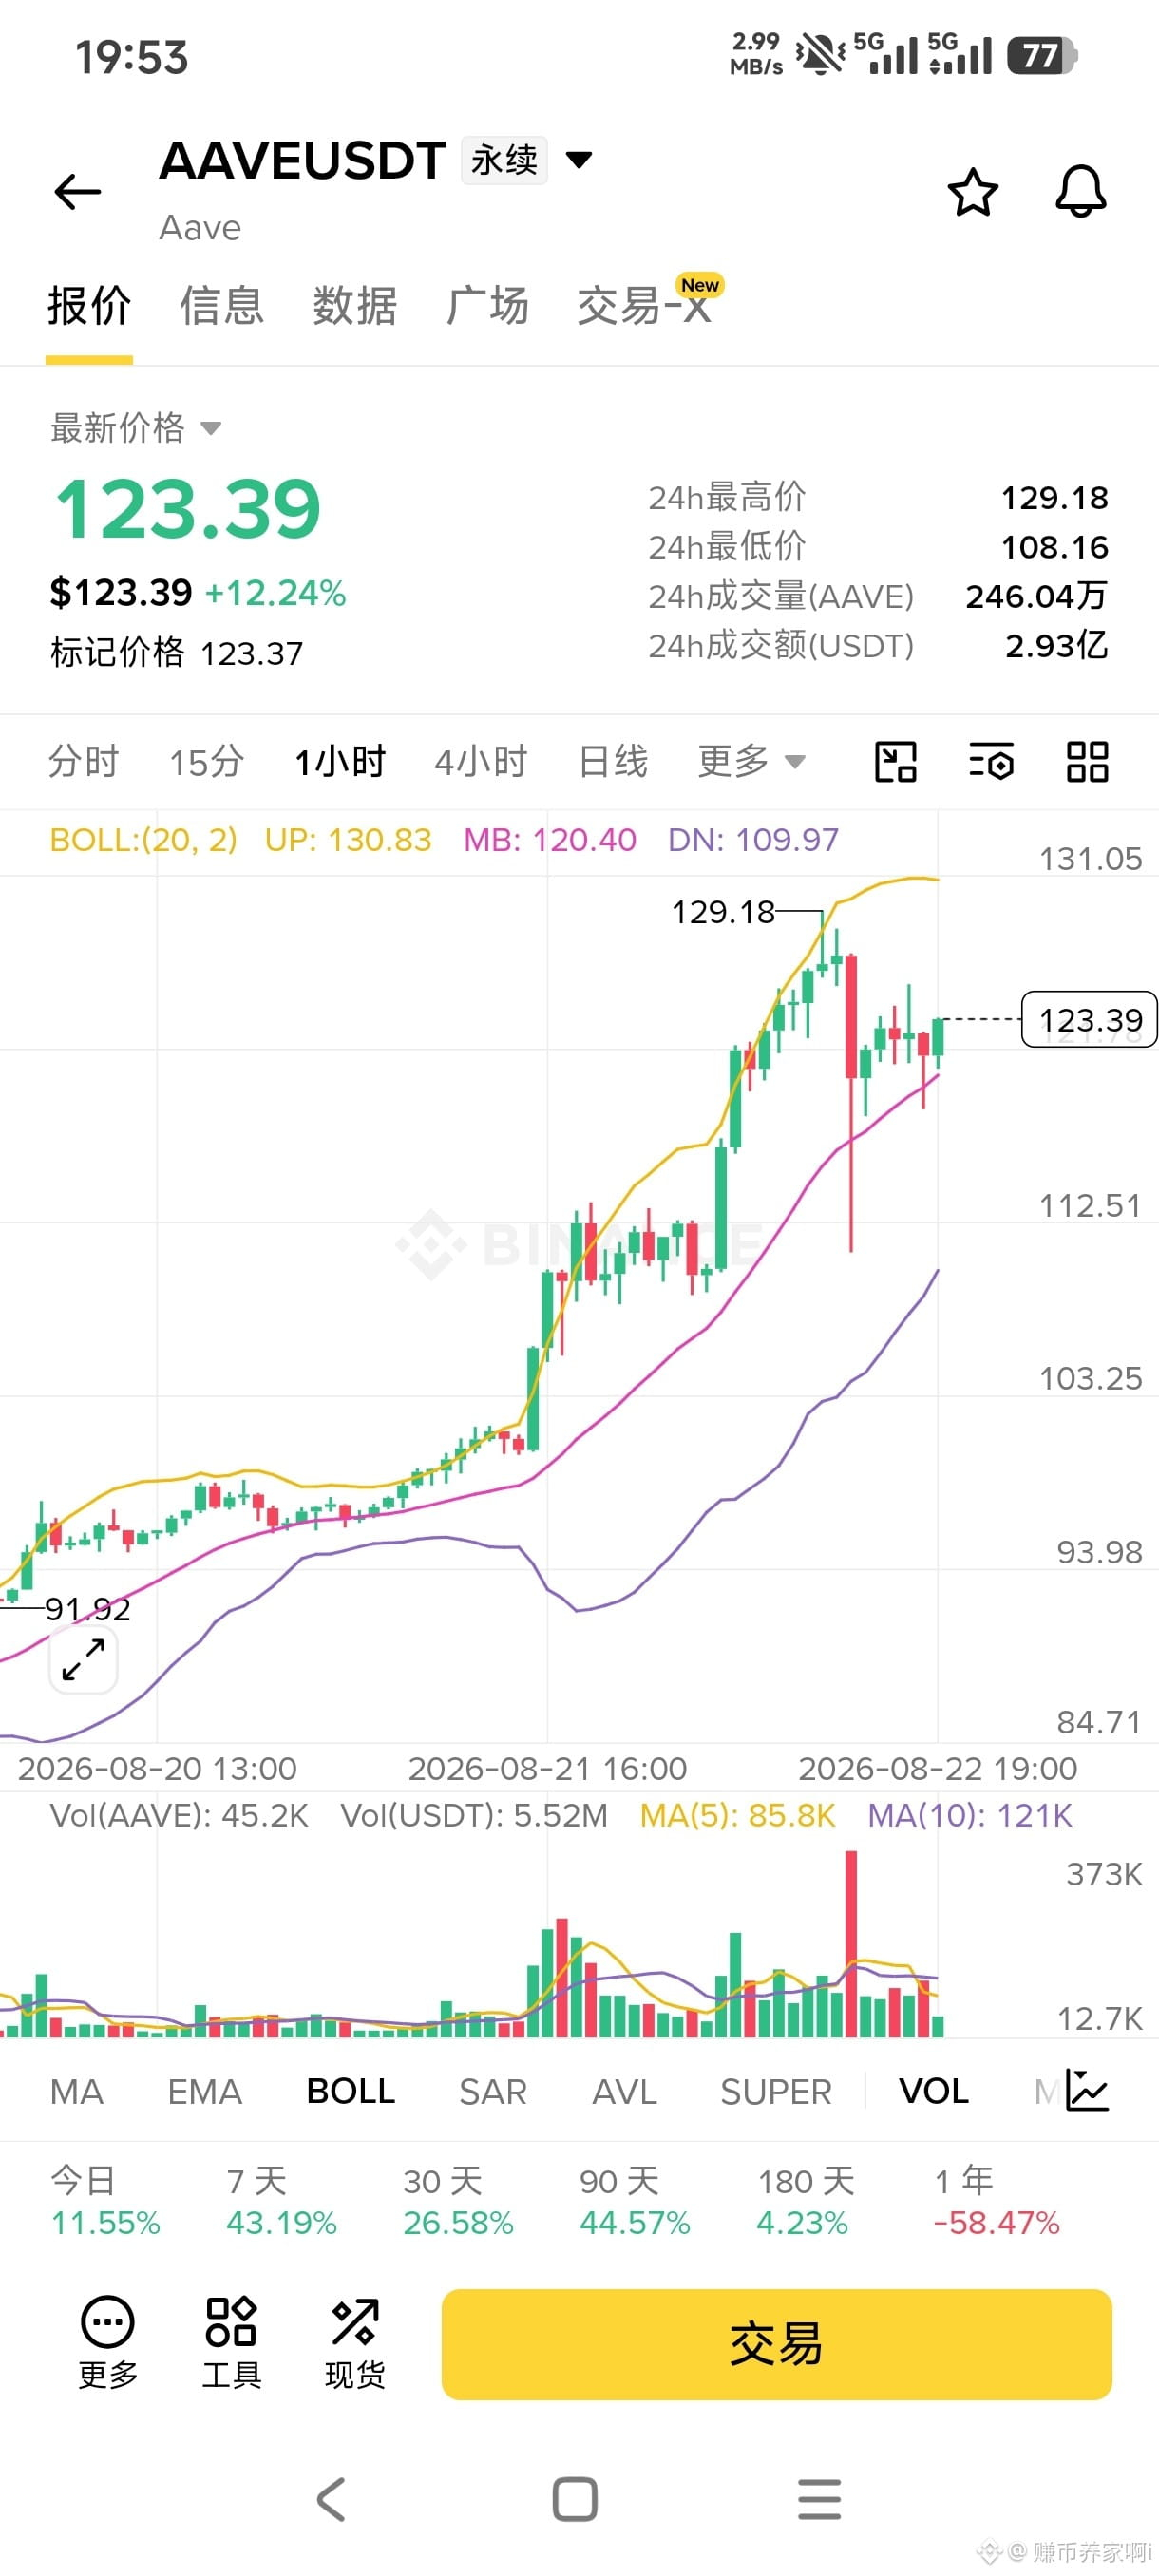
Looking back at this AAVE move, it surged higher step by step, directly hitting the 129.18 peak, only to get heavily dumped right afterward.
Earlier, the bulls’ momentum looked especially strong—many people chased and entered at higher levels. But after surging upward, a single large bearish candle sent the price falling back. The 129.18 level is the real, tangible short-term resistance in this round: once price pushed up, it couldn’t hold, and a large amount of profit-taking orders simply rushed to exit.
After the drop, it bounced back quickly—without a straight, continuous collapse—which suggests that buy orders below are still holding up. When you look back at the area around 120, that’s now a critical hurdle.
Previously, the market turned strong because it held steady above this zone. If later this level can’t be defended, then the momentum of this strong upward move will be discounted.
After a big rally, don’t blindly assume it will keep going up forever. No matter how strong the market is, when it reaches high levels, capital will still choose to take profits.
Have you gotten any gains from this AAVE move?👇$AAVE
Looking back at this AAVE move, it surged higher step by step, directly hitting the 129.18 peak, only to get heavily dumped right afterward.
Earlier, the bulls’ momentum looked especially strong—many people chased and entered at higher levels. But after surging upward, a single large bearish candle sent the price falling back. The 129.18 level is the real, tangible short-term resistance in this round: once price pushed up, it couldn’t hold, and a large amount of profit-taking orders simply rushed to exit.
After the drop, it bounced back quickly—without a straight, continuous collapse—which suggests that buy orders below are still holding up. When you look back at the area around 120, that’s now a critical hurdle.
Previously, the market turned strong because it held steady above this zone. If later this level can’t be defended, then the momentum of this strong upward move will be discounted.
After a big rally, don’t blindly assume it will keep going up forever. No matter how strong the market is, when it reaches high levels, capital will still choose to take profits.
Have you gotten any gains from this AAVE move?👇$AAVE
$$LINK $LINK
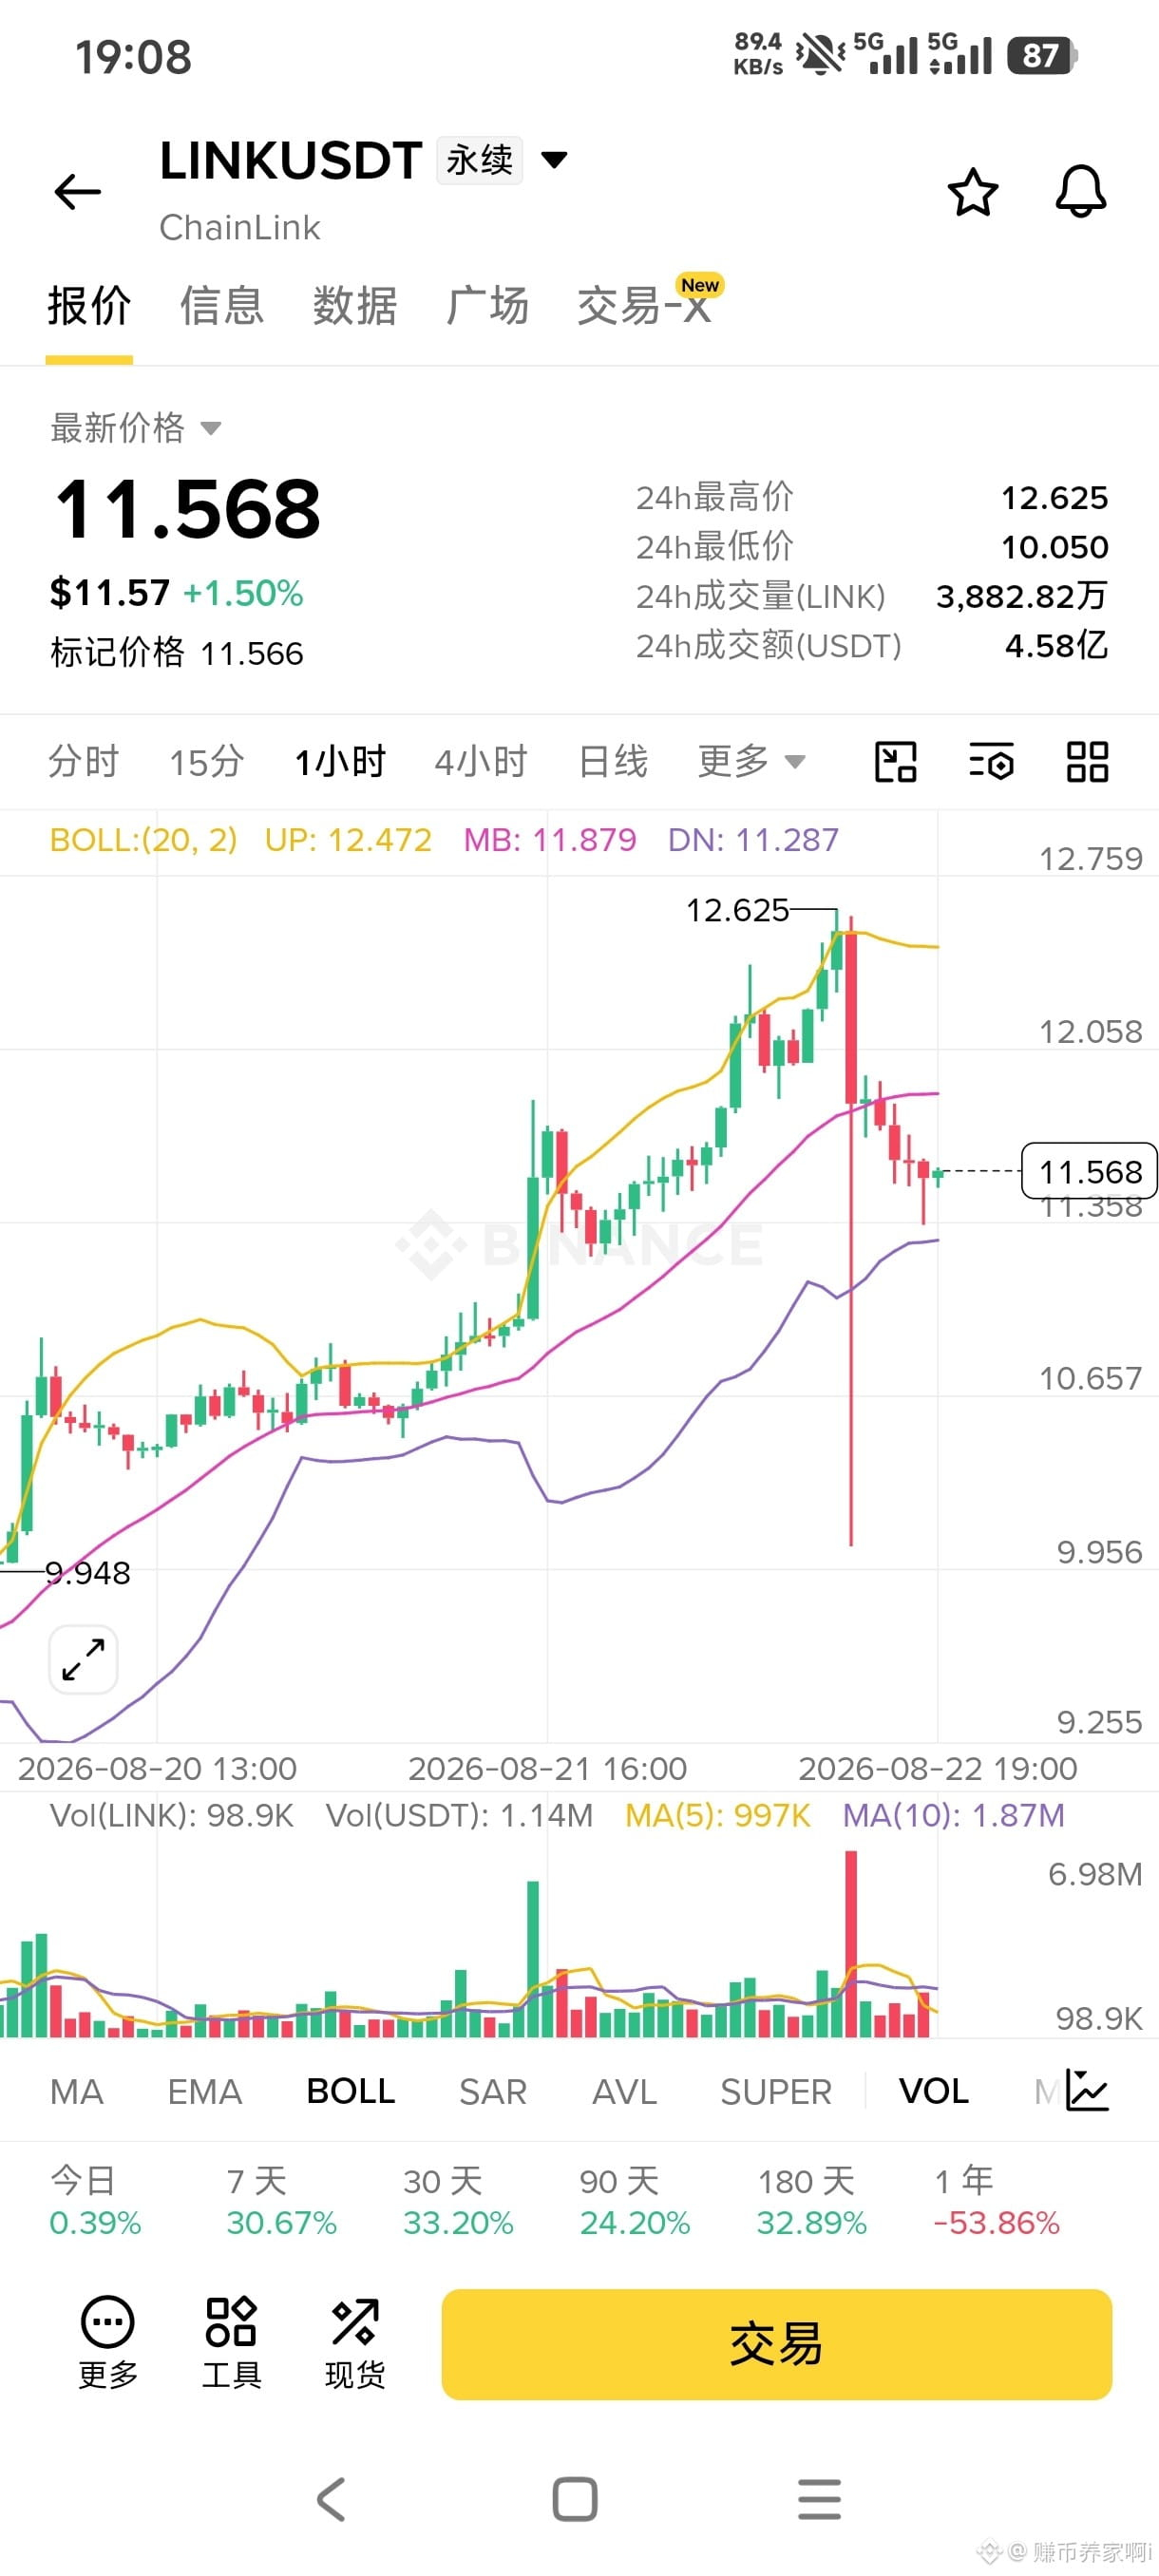
After pushing up to 12.625, it was slammed down by funds, then it closed with a long upper wick. In the early stage, a lot of profit-taking positions have been built up.
The key support to watch is the 11.28–11.3 range.
If this area can hold, the uptrend remains intact; if it breaks, there may be further room for a pullback.
Don’t blindly chase at the highs—try to wait for a retest of the support area before making a decision.
After the surge and subsequent pullback, will you choose to keep holding or reduce positions to avoid risk?👇$LINK
After pushing up to 12.625, it was slammed down by funds, then it closed with a long upper wick. In the early stage, a lot of profit-taking positions have been built up.
The key support to watch is the 11.28–11.3 range.
If this area can hold, the uptrend remains intact; if it breaks, there may be further room for a pullback.
Don’t blindly chase at the highs—try to wait for a retest of the support area before making a decision.
After the surge and subsequent pullback, will you choose to keep holding or reduce positions to avoid risk?👇$LINK
Log in to explore more content