
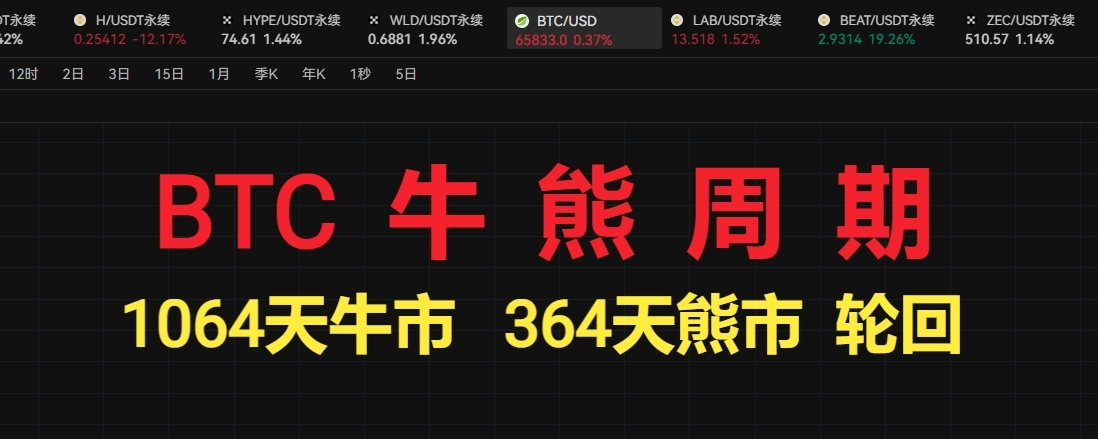


Hey fam: Open up the Bitcoin weekly chart, and you'll see a digital cycle pattern that spans over a decade and has repeated three times, shaking up everyone's understanding of the crypto market's bull and bear phases. Many are chasing news, watching regulations, and guessing halvings, but they overlook the time-space code etched in BTC's price action—a cyclical pattern with minimal variance.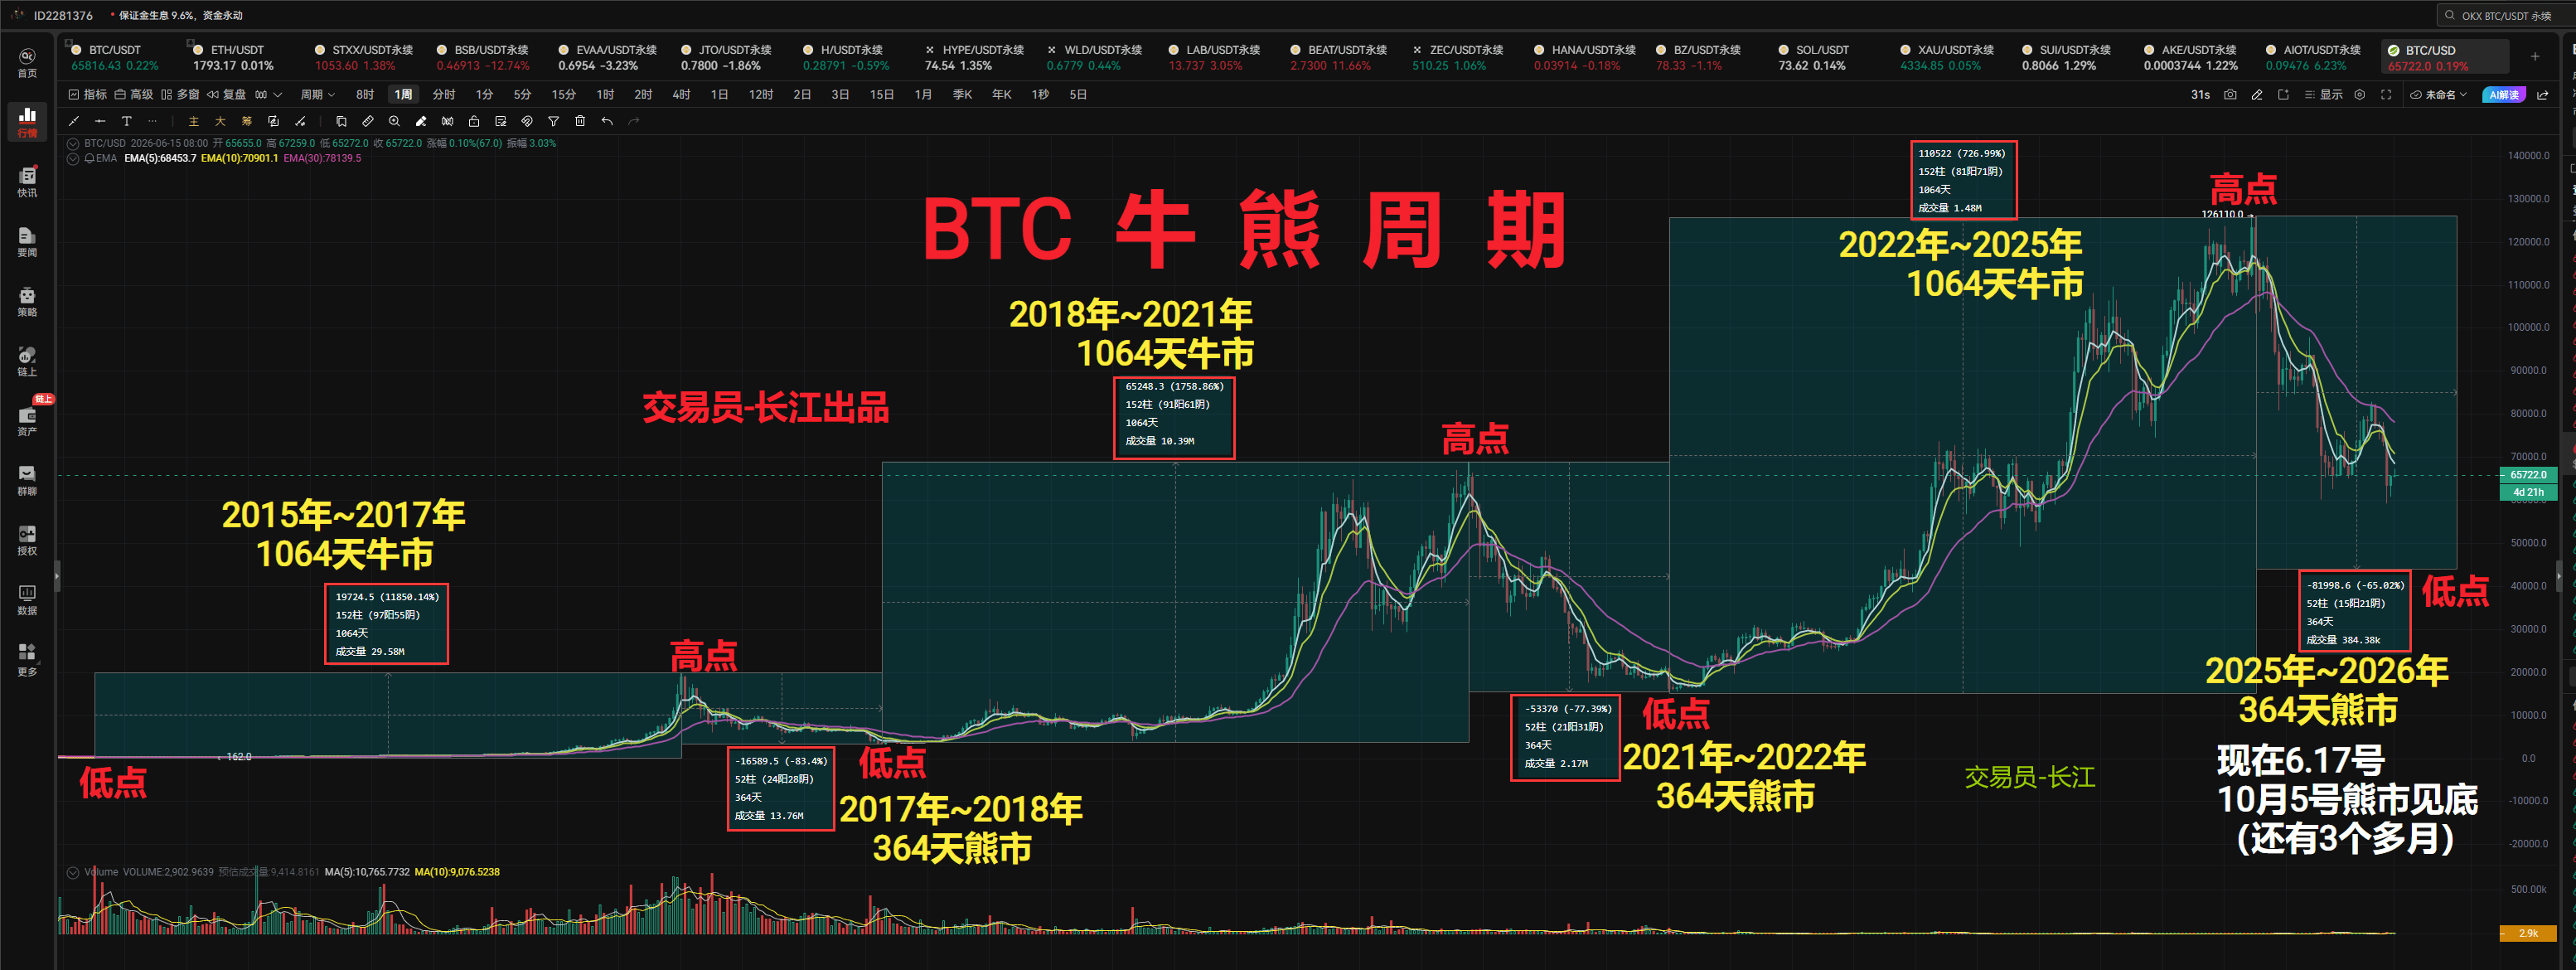
1. Three perfect replicas: The 1064-day super bull market cycle has never failed.
The chart clearly marks three distinct and equivalent bull market uptrends, all locked in for 1064 days, with a highly unified time-space scale:
1. The first bull market from 2015 to 2017.
Starting from the bear market low of $166.4, we’ve run a full 1064 days to hit this cycle's historical peak of $19,891, a whopping gain of 11,859%; this corresponds to 152 weekly candlesticks, where the trading volume and upward momentum resonate like a mirror with the previous two bull markets—this is the first validation of this cyclical principle.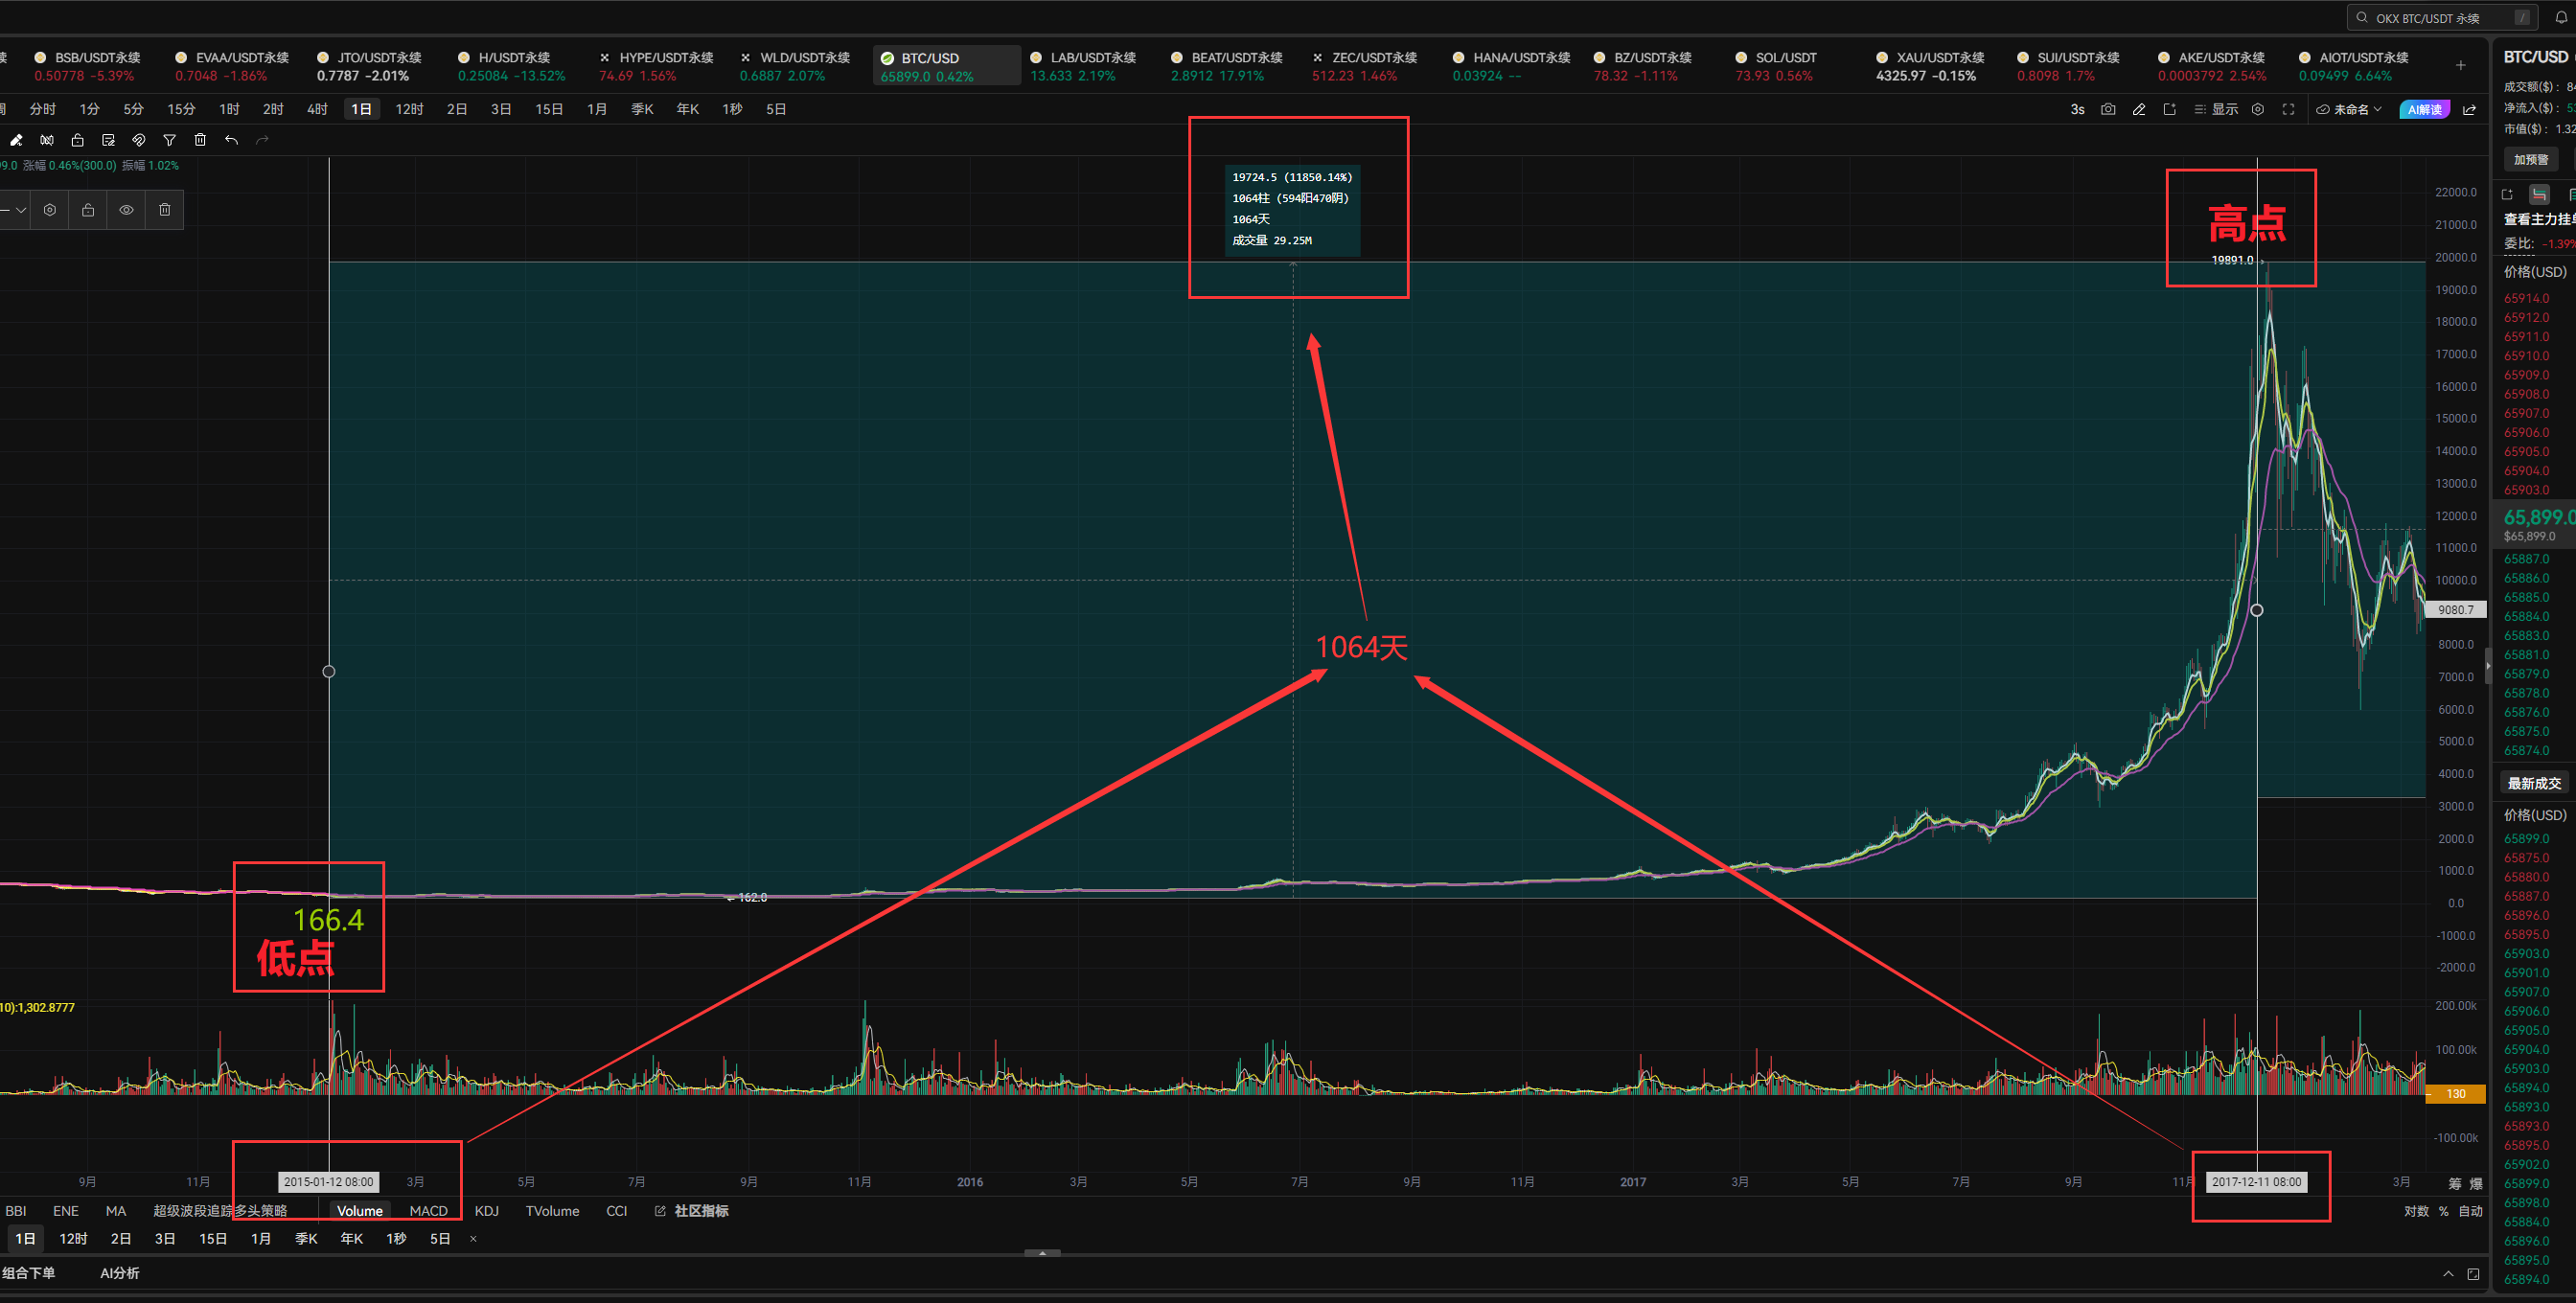
2. Second bull market from 2018 to 2021.
After the last bear market bottomed at $3215, the market replicated the 1064-day upward cycle again, peaking at $68,958, a surge of 1758%. Similarly, 152 weekly candles depicted the rhythm of consolidation, main upward waves, and final topping, mirroring 2015-2017 exactly.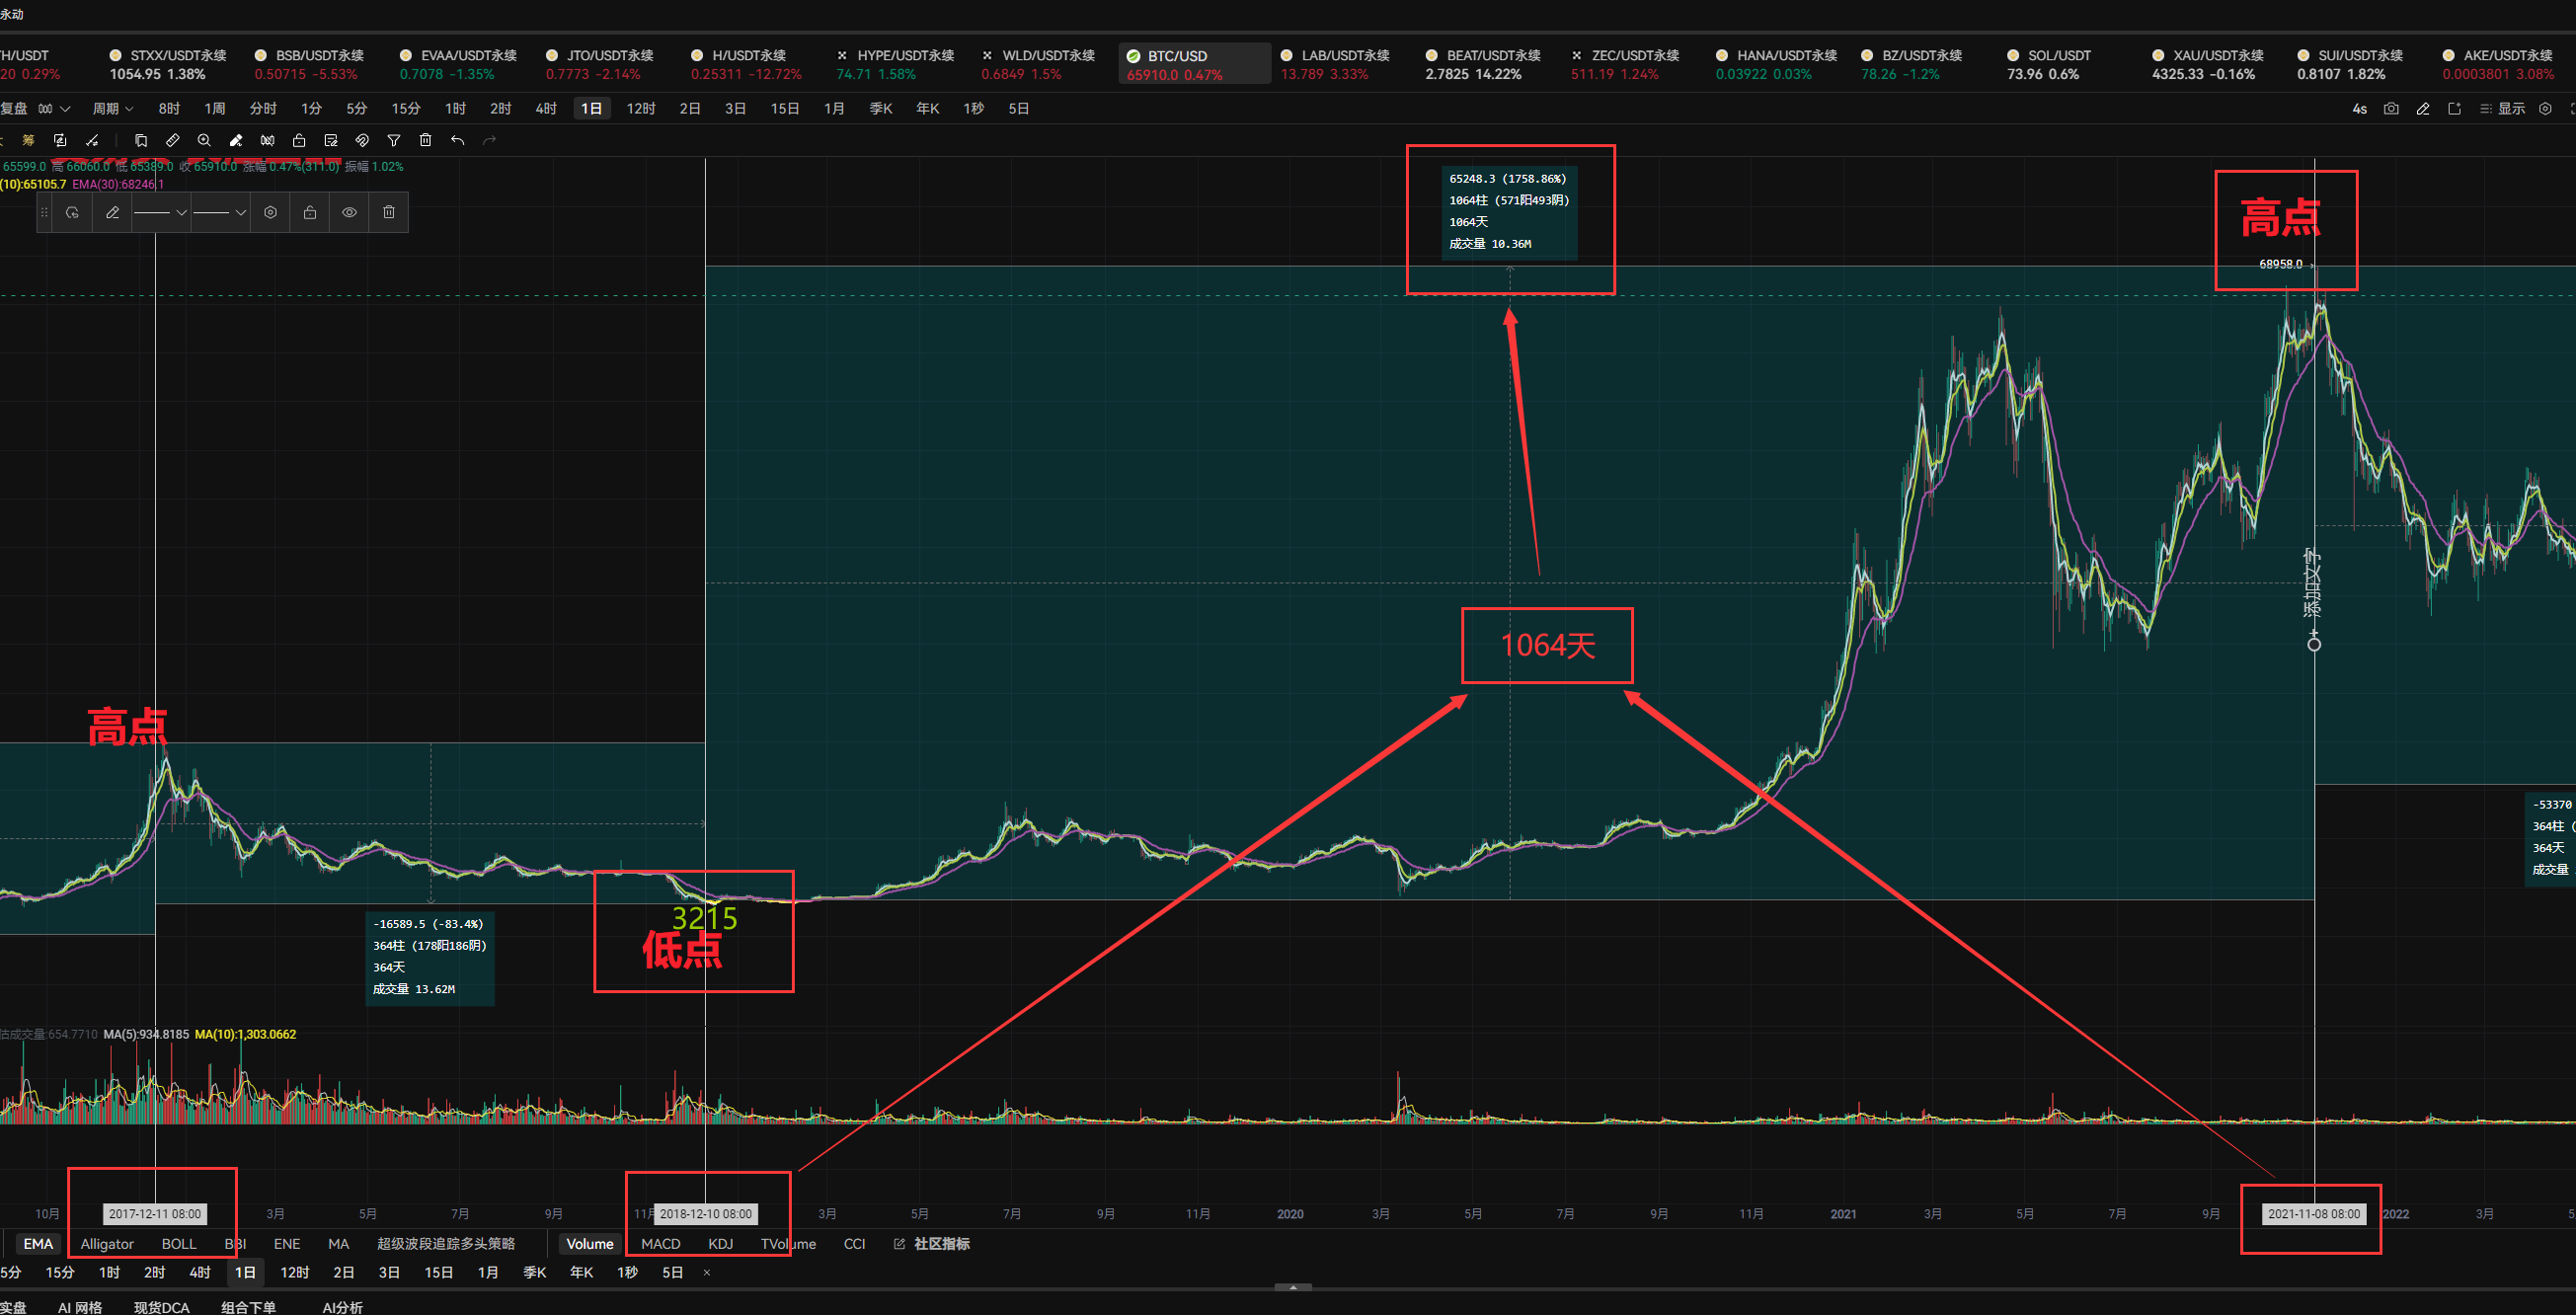
3. Third bull market from 2022 to 2025.
The bear market started at a low of $15,487 in 2021 and still strictly followed the 1064-day bull market cycle, reaching a historical high of $126,110, with a 726% increase. The three bull markets have identical durations and candle counts, with only the percentage gains narrowing as market capitalization expands, but the cycle timing remains flawless.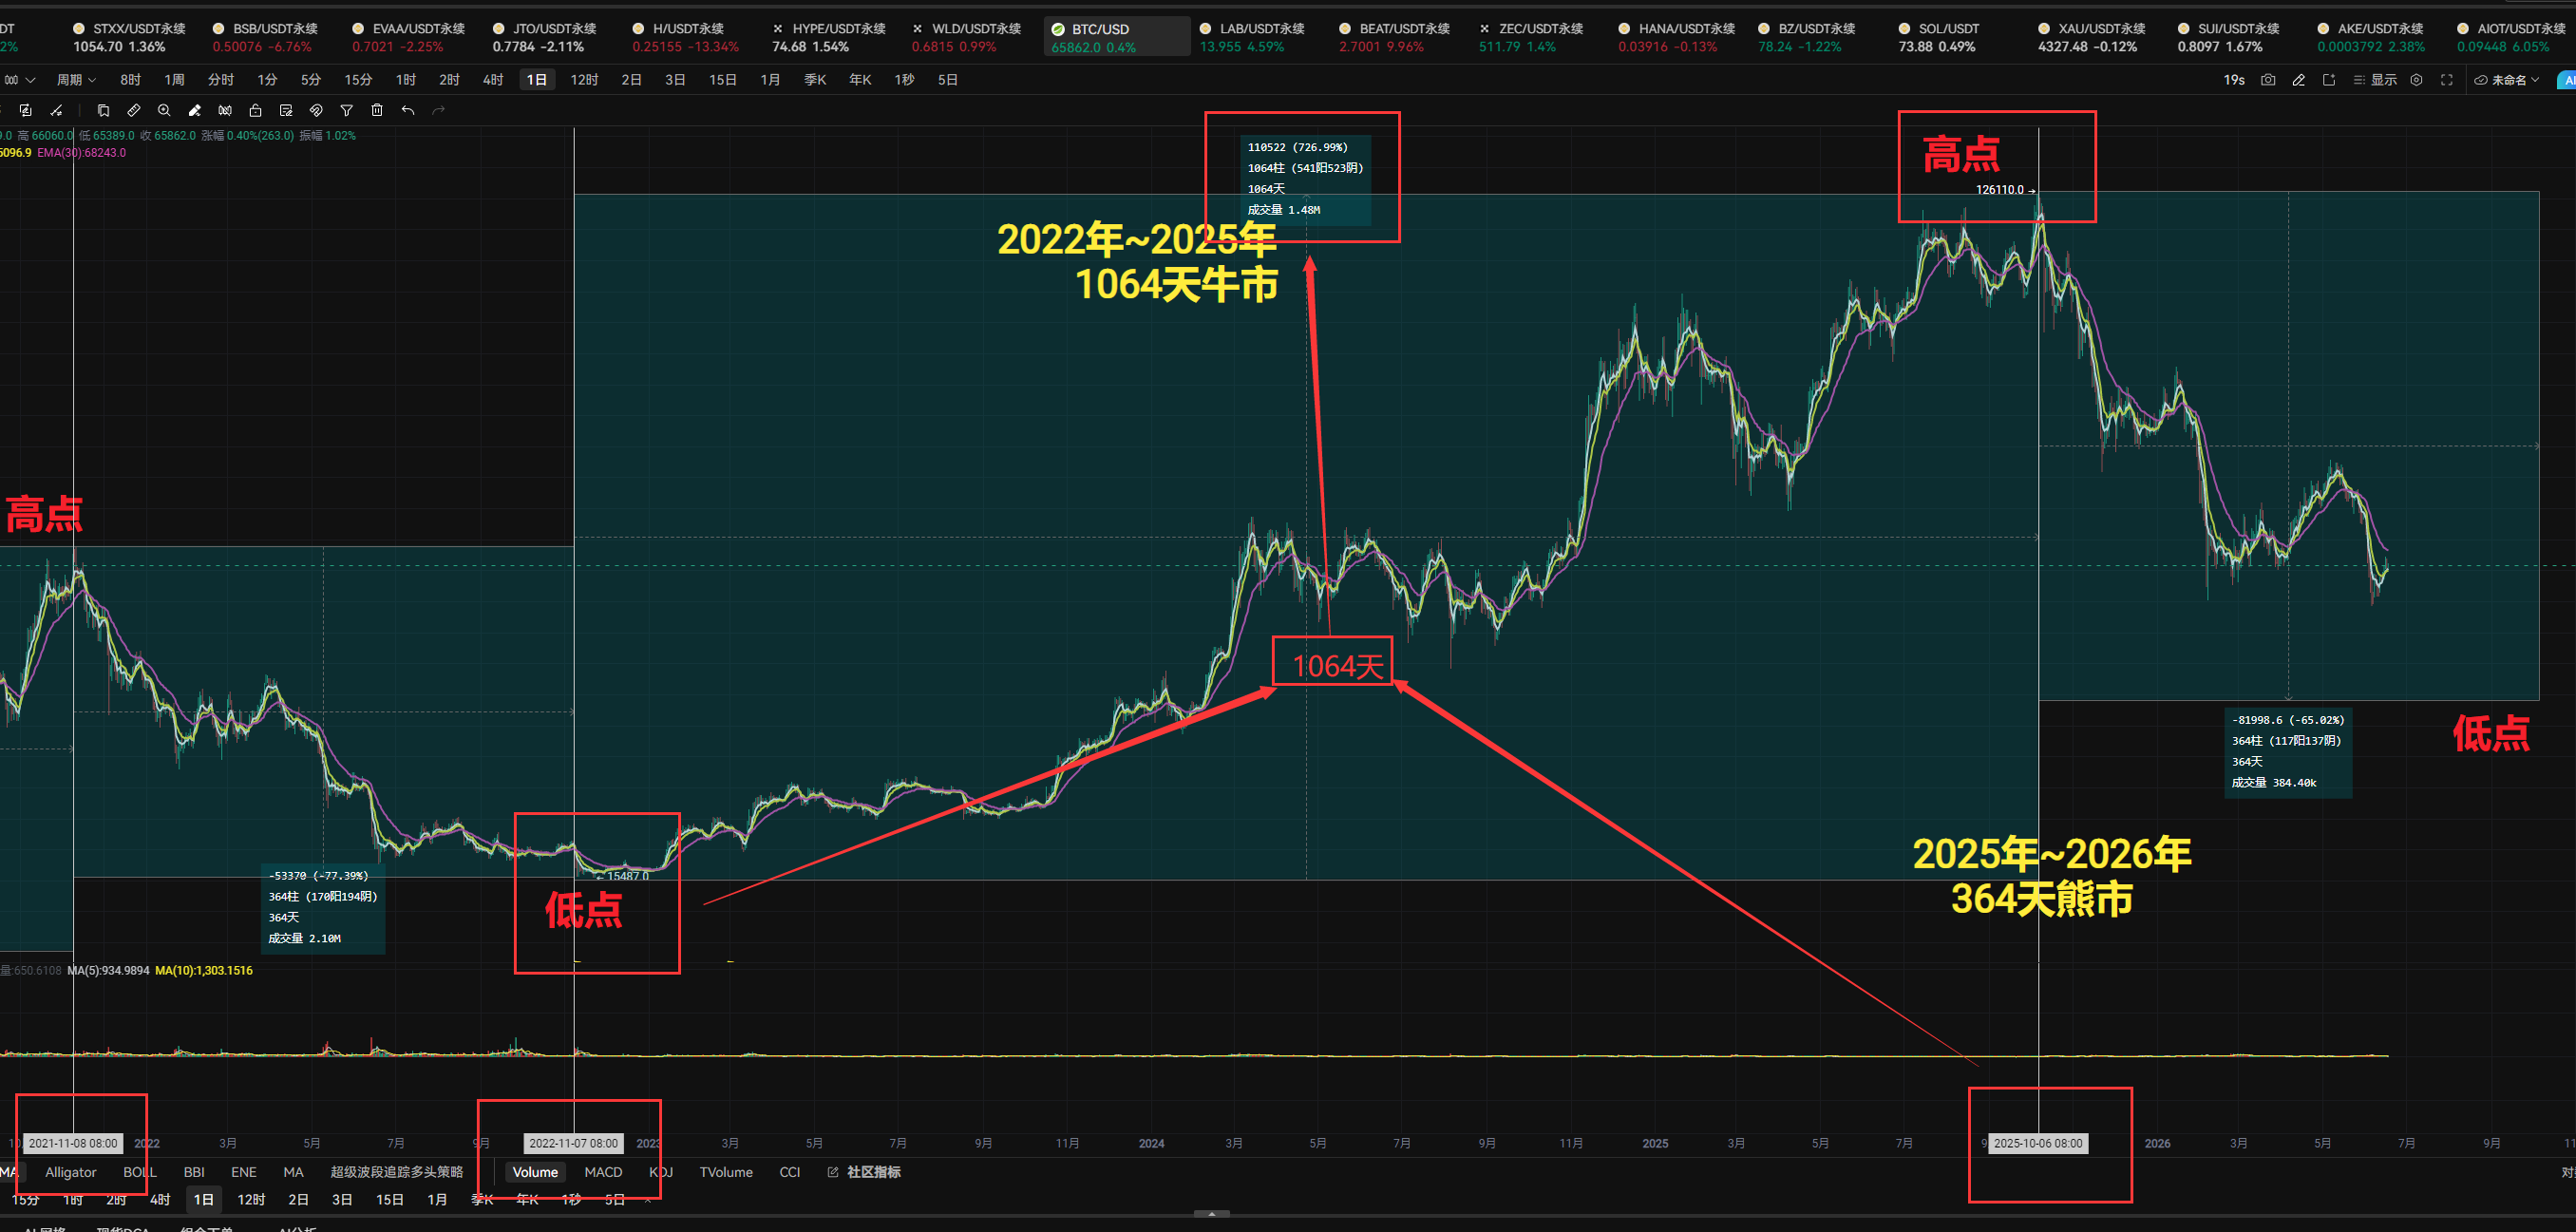
1064 days isn't just a random number; it's Bitcoin's built-in bull market time threshold. After each bottom formation, the market's bullish energy gets precisely released after 1064 days. Once we hit the cycle endpoint, the bull market immediately ends—no exceptions. This precise repetition over a decade is extremely rare among any financial assets globally, making it one of the most mysterious core traits of this cycle.
Two, the unified fate of bear markets: a standard 364-day down cycle, recurring like a clock 🕰️.
Corresponding to the bull market of 1064 days, after each bull market peaks, the bear market downturn is fixed at 364 days, with three bear markets occurring without error:
1. Bear market from 2017 to 2018.
$19,891 peak retraced, continuing a 364-day downtrend to a low of $3,215.2, with a maximum drawdown of 83.44%. The structure of 52 weekly candles showed a standardized drop, rebound, and final decline.
2. Bear market from 2021 to 2022.
$65,248 marked the end of the bull market, leading into a 364-day bear market with a bottom at $15,487, a maximum drawdown of 77.39%. Again, 52 weekly candles strictly adhered to the 364-day time window for the down cycle.
3. Current bear market from 2025 to 2026.
$126,110 marked a historical peak, entering a standard 364-day bear market cycle again. The current timeline is June 17, 2026.
According to cycle calculations, the complete bottoming time for this bear market is locked in for October 5, leaving just over three months. The current market is in the mid-down structure of the bear market, with a maximum retracement already reaching 65.02%, and trading volume is shrinking, perfectly aligning with the mid-down trends of the previous two bear markets.
364 days closely aligns with the natural yearly cycle, while 1064 days is about 2.9 natural years. One bear and one bull overlap, forming a complete cycle of 1428 days, creating Bitcoin's unique fixed rhythm of 'short bear, long bull.' The duration of bull markets is nearly three times that of bear markets, explaining why Bitcoin maintains a long-term bullish trend; declines are merely temporary adjustments.
Three, the uniqueness of this cycle: why it's called the time-space code of the crypto market.
1. Precise repetition over a decade with a strong sense of fate.
From 2015 to now, spanning 11 years, three complete bull-bear cycles have occurred, with the time windows for rises and falls showing no significant deviation. Traditional assets like stocks, gold, and forex exhibit vast fluctuations in bull and bear durations, while Bitcoin has nearly mechanically followed its cyclical rhythm, exhibiting a mysterious numerical time law.
2. The cycle operates independently of external news, unaffected by macro interventions.
Over the past decade, we've experienced regulatory crackdowns, stock market crashes, interest rate hikes and cuts, halving events, and countless major incidents, yet the price always returns to the 1064/364-day time track. All positive and negative news only alters the amplitude of fluctuations along the way but cannot change the cycle endpoint, indicating that this is a fundamental rule formed by market capital, chips, and human nature resonance, not something external policies can sway.
3. Accurately predict future bottoms, providing clear time anchors for trading.
Unlike lagging technical indicators like moving averages and MACD, this cycle acts as a leading time indicator. Currently, we can lock in the bottom window for this bear market: October 5, 2026. After this cycle hits bottom, a new 1064-day bull market will begin, clearly defining the time boundary for mid and long-term layouts.
4. The dual resonance of candlesticks and trading volume confirms that this is not merely a coincidence of numbers.
In each segment of the bull-bear cycle chart, the number of weekly candles and the scale of trading volume match closely: volume continues to expand during bull markets, while it gradually contracts during bear markets. The volume-price structure at the end of each cycle, whether topping or bottoming out, is a complete replica, proving that 1064 and 364 are not just random numbers but traces left by market capital behavior.
Four, the deeper logic behind the cycle: the interplay of human nature and chips in a closed loop.
This mysterious cycle essentially represents a closed loop of sentiment and capital exchange among crypto market participants.
1064 days is sufficient to complete a full wealth transfer: low-priced chips gradually shift from retail investors to institutions, going through accumulation, washing out, main ascent, and bubble topping in four stages, exhausting bullish energy completely.
Subsequently, the 364-day bear market began, clearing the bubble, with high-level trapped positions continuously cutting losses, fear sentiment fully released, and chips returning to lower levels, waiting for the next 1064-day bull market cycle to kick off.
Bitcoin's four-year halving is a well-known surface pattern, while the 1064/364-day bull-bear time cycle is a more precise and mysterious underlying temporal law hidden beneath the halving. The halving influences price peaks, while this cycle dictates the timing of market movements.
Lastly, I want to say to all you traders:
Plan your wealth wisely, strategizing for the next bull market cycle, accumulating your wealth, leveraging resources, and enriching your financial portfolio.
While the vast majority of traders are still fixated on short-term spikes and day-to-day fluctuations, this ten-year panoramic view reveals Bitcoin's most core secret: its price movements are never random but follow a repetitive cyclical pattern. The precise duplication of 3 bull markets over 1064 days and 3 bear markets over 364 days is the unique mysterious code of the crypto market.
As we stand in June 2026, we are in the middle of the third 364-day bear market, with over three months remaining until the cycle bottom. By understanding this cycle, you can step out of the noise of short-term market movements, accurately seize the layout window at the end of the bear market, and await the next super bull market lasting 1064 days.