【Crypto Trader's Menu Unveiled】
A lot of folks ask me, how do I always seem to see the direction ahead of time?
It's not about where the market is heading; what's crucial is whether you've got your own map.
Believe me, there was never a road in this world; when enough people walk it, a path appears. The market has no chart by default, but if you sketch out your own logic, the chart will naturally follow.
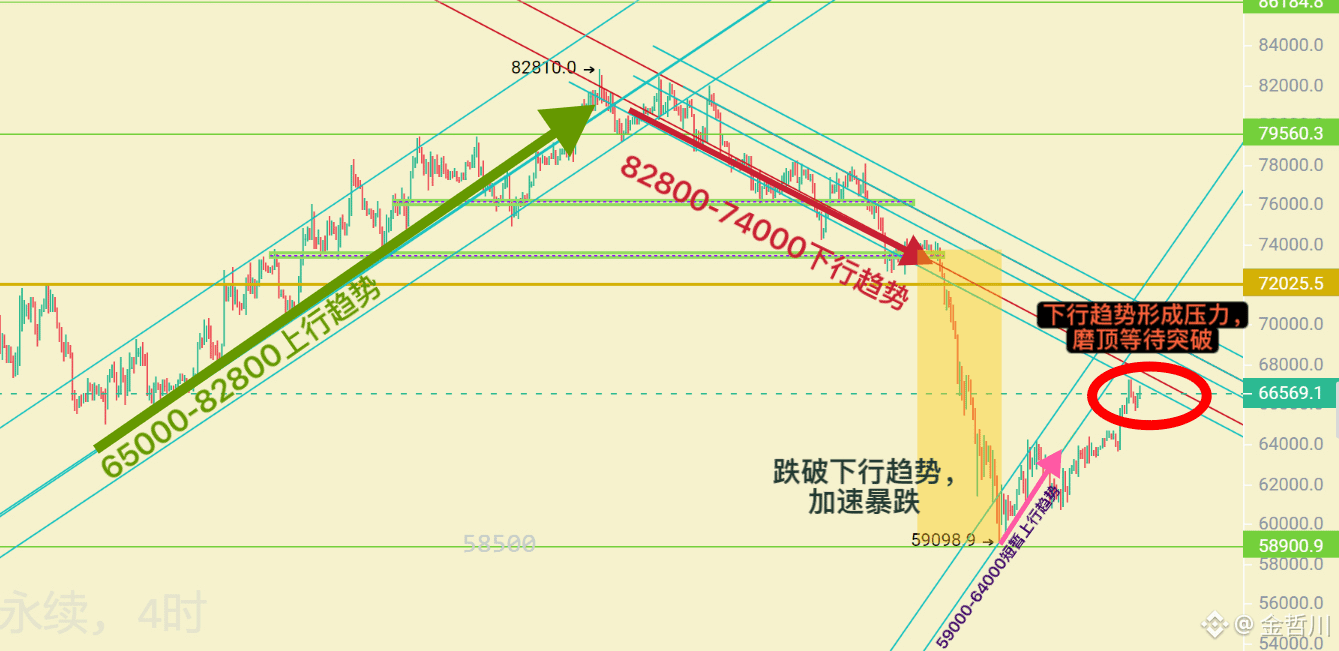
This chart corresponds directly with my live trading setup; every step is backed by logic, not just wild guesses on price movements.
✅ Phase One: 65000—82800
After a long consolidation, we break out and establish a clear upward trend.
✅ Phase Two: 82800—72000
Breaking key support at 76000 and 73500, the trend flips from bullish to bearish.
✅ Phase Three: Losing 72000
The market enters a phase of accelerated decline, hitting a low of 59000.
✅ Phase Four: 59000—67200
A bottom is established and a rebound occurs, creating a new upward trend.
✅ Phase Five: Current Market
The upward trend has reached the previous downward pressure zone, and the market is in a tug-of-war, consolidating and testing resistance.
What's next? A breakout to the upside or a pullback that triggers a correction?
The answer will be revealed soon.
Those who understand the trend make money from the trend, while those who don't make money from volatility.
I’m a professional trader, only engaging in logical trades, not baseless speculation.
Follow me, and let’s clarify the next steps together. #比特币走势分析
A lot of folks ask me, how do I always seem to see the direction ahead of time?
It's not about where the market is heading; what's crucial is whether you've got your own map.
Believe me, there was never a road in this world; when enough people walk it, a path appears. The market has no chart by default, but if you sketch out your own logic, the chart will naturally follow.
This chart corresponds directly with my live trading setup; every step is backed by logic, not just wild guesses on price movements.
✅ Phase One: 65000—82800
After a long consolidation, we break out and establish a clear upward trend.
✅ Phase Two: 82800—72000
Breaking key support at 76000 and 73500, the trend flips from bullish to bearish.
✅ Phase Three: Losing 72000
The market enters a phase of accelerated decline, hitting a low of 59000.
✅ Phase Four: 59000—67200
A bottom is established and a rebound occurs, creating a new upward trend.
✅ Phase Five: Current Market
The upward trend has reached the previous downward pressure zone, and the market is in a tug-of-war, consolidating and testing resistance.
What's next? A breakout to the upside or a pullback that triggers a correction?
The answer will be revealed soon.
Those who understand the trend make money from the trend, while those who don't make money from volatility.
I’m a professional trader, only engaging in logical trades, not baseless speculation.
Follow me, and let’s clarify the next steps together. #比特币走势分析