according to the fire mother r

Post

--

Kỹ Hầu Vương
·
--
🌞 Update market [8/12] [ZEC]. 💵
.
1. Technical Structure & Trends (Technical Structure):
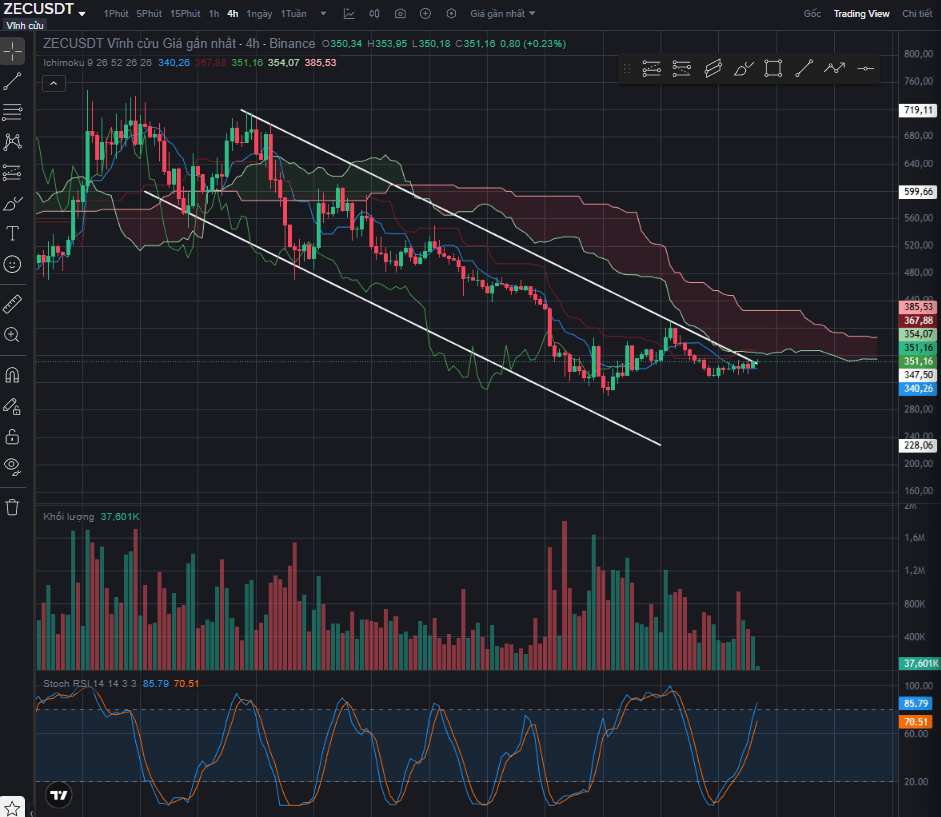
On the H4 time frame, ZEC is moving very consistently in a large Descending Channel model. The current price (around 351.xx) is reacting negatively at the "death" confluence area: the upper edge of the price channel and the lower edge of the red Ichimoku cloud (Kumo). The price being below the thick cloud confirms that the dominant downtrend is still strongly influencing.
.
2. Momentum Indicators:
The Stoch RSI indicator is anchored in the Overbought area with a very high index (85.79) and is showing signs of curving down. This indicates that the buying effort has exhausted (exhaustion) right at resistance. When momentum peaks while the price hits hard resistance, the probability of a continued reversal is very high.
.
3. Optimal Trading Setup:
This is a classic "Short at resistance" setup. Opening a Long position right now is extremely risky as it is "banging your head against the wall". The smartest strategy is to go with the flow of the market, opening a Short position to optimize profits in the upcoming sell-off towards the bottom of the channel.
.
SUGGESTED POSITION
🔻 SHORT LIMIT: 352.00 - 358.00 (Trendline resistance area and Flat Kumo cloud base)
🛑 SL: 375.00 (Set above the nearest Swing High and exit the price channel for safety)
🎯 TP1: 315.00 (Psychological support area and channel midpoint)
🎯 TP2: 275.00 (Bottom of the descending price channel - Expected target)
.
This article only suggests market information, not an investment call! #DYOR #NFA $ZEC
.
1. Technical Structure & Trends (Technical Structure):
On the H4 time frame, ZEC is moving very consistently in a large Descending Channel model. The current price (around 351.xx) is reacting negatively at the "death" confluence area: the upper edge of the price channel and the lower edge of the red Ichimoku cloud (Kumo). The price being below the thick cloud confirms that the dominant downtrend is still strongly influencing.
.
2. Momentum Indicators:
The Stoch RSI indicator is anchored in the Overbought area with a very high index (85.79) and is showing signs of curving down. This indicates that the buying effort has exhausted (exhaustion) right at resistance. When momentum peaks while the price hits hard resistance, the probability of a continued reversal is very high.
.
3. Optimal Trading Setup:
This is a classic "Short at resistance" setup. Opening a Long position right now is extremely risky as it is "banging your head against the wall". The smartest strategy is to go with the flow of the market, opening a Short position to optimize profits in the upcoming sell-off towards the bottom of the channel.
.
SUGGESTED POSITION
🔻 SHORT LIMIT: 352.00 - 358.00 (Trendline resistance area and Flat Kumo cloud base)
🛑 SL: 375.00 (Set above the nearest Swing High and exit the price channel for safety)
🎯 TP1: 315.00 (Psychological support area and channel midpoint)
🎯 TP2: 275.00 (Bottom of the descending price channel - Expected target)
.
This article only suggests market information, not an investment call! #DYOR #NFA $ZEC
Disclaimer: Includes third-party opinions. No advice. Binance AI may be used without guarantee. See T&Cs.