Daily charts for Bitcoin show clear signs that the strong selling phase is beginning to lose momentum.
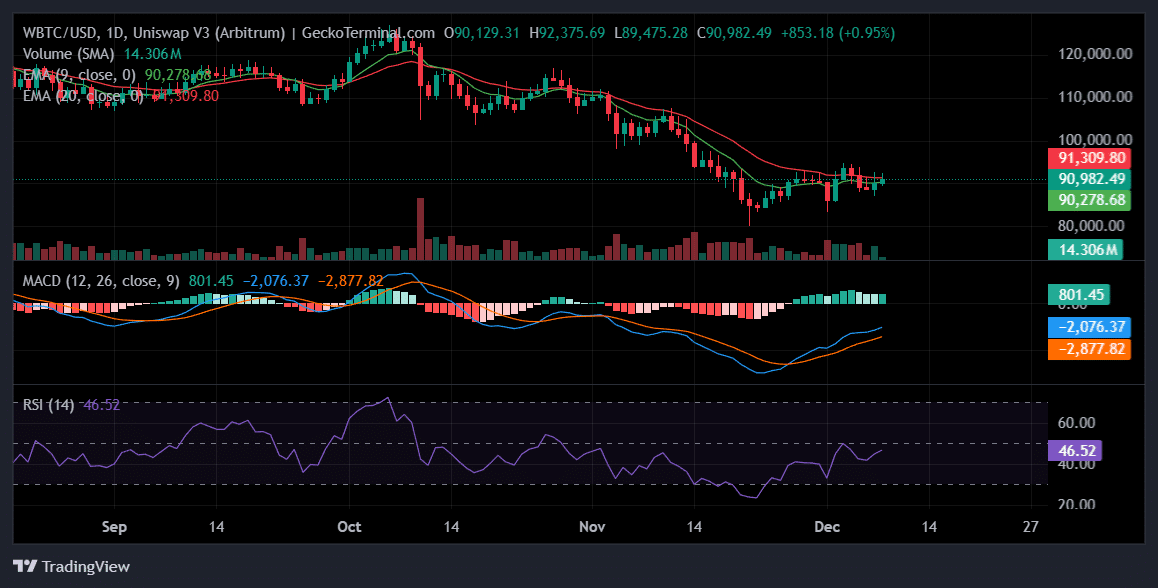
After a sharp drop from recent highs, the price index stabilized just above the psychological $90,000 area. While volatility remains high, the absence of continuity in recent declines suggests that sellers are struggling to maintain control.
This type of stability often represents the early stages of a foundation process rather than a continuation of a sharp downward trend.
The Bitcoin market structure shows weak bear control.
Bitcoin remains centered below short and medium-term trend metrics, keeping the broader structure in a technically bearish zone.
However, the shrinking distance between the price and the faster trendline reveals that the downward pressure is weakening rather than increasing. Instead of accelerating downwards, Bitcoin is compressing within a narrow range, a state that often precedes a sharp directional expansion once liquidity is fully absorbed.
Momentum indicators point to downward exhaustion.
Momentum remains generally negative, confirming that the market is still in a corrective phase and not in a renewed bullish trend.
However, it is clear that the deterioration of momentum is slowing down. The improved structure of the downward momentum indicates that sellers are losing efficiency with each renewed push downward. The behavior of the Relative Strength Index (RSI) supports this narrative, showing that although Bitcoin is not yet in the bullish zone, selling strength is no longer dominant. This combination typically reflects transitional areas where accumulation by 'smart money' can begin covertly.
Order book liquidity reveals strong defense from buyers below.
The order book shows several bid walls tightly stacked beneath the current price, indicating that buyers are actively defending the $91,000 area. These liquidity layers suggest that if the price drops, losses may remain contained instead of accelerating violently. This confirms that major participants are treating the current area as a value zone rather than a level to be abandoned.
On the upside, many sell walls above the price directly explain why Bitcoin has failed to achieve a clear breakout. These upper blocks actively absorb demand, forcing the market into a state of compression.
Key resistance areas define the breakout path.
Bitcoin faces its first major upside barrier near $93,429, which remains the immediate trigger level to renew bullish momentum.
Continuous breakout above this area could open the way for further ascent towards $94,270, with $96,887 emerging as the next key profit-taking area. This upper zone represents the area where previous distribution occurred and where sellers are likely to show up strongly again.
Support levels shape bearish risks.
On the downside, Bitcoin remains technically protected by structural support at $86,286. A breakdown below this area would significantly undermine market confidence and open the door towards $84,739, followed by a deeper defensive layer near $84,250.
These lower levels represent areas where long-term participants are likely to reassess accumulation opportunities if downward pressure resumes.
Long position forecasts remain conditional on breakout.
For bullish positions, confirmation remains essential.
Long positions are more aligned with a confirmed breakout above short-term resistance, indicating that buyers may have regained structural control. In this scenario, bullish targets align with higher resistance areas, while risk determination remains by returning towards regained support.
Entering strongly within the current pressure zone carries high risks of false breakouts.
The bias for short positions remains in effect below resistance.
For bearish traders, Bitcoin remains technically weak as long as the price remains constrained below resistance.
Rejection from upper liquidity combined with fading recovery momentum could present short opportunities targeting lower support areas.
However, the strong bid defense below the price increases the risks of sharp reactions from the buying side, making disciplined exit management essential.
Market outlook: compression before expansion.
Bitcoin is no longer in free fall, but it has not regained bullish control yet.
The current structure reflects a transitional phase where sellers are losing their dominance but buyers have not fully asserted their authority yet.
The next continuous trend is likely to emerge from a decisive breakout either above $93,000 or below $86,000.
Until that happens, Bitcoin remains trapped in a high-risk equilibrium where liquidity positioning and momentum shifts will dictate the next primary direction.
