
Currently, TRX shows a mild upward unilateral trend, with the price stabilizing above the MA200 and average holding cost. However, the market is in a cautiously optimistic environment of 'volume contraction upward,' with a dramatic drop in contract trading volume indicating extremely low activity in the derivatives market. Although there is buying pressure in the spot market, overall liquidity is weak, which does not indicate a healthy strong breakout pattern.
Key Price and Range Structure
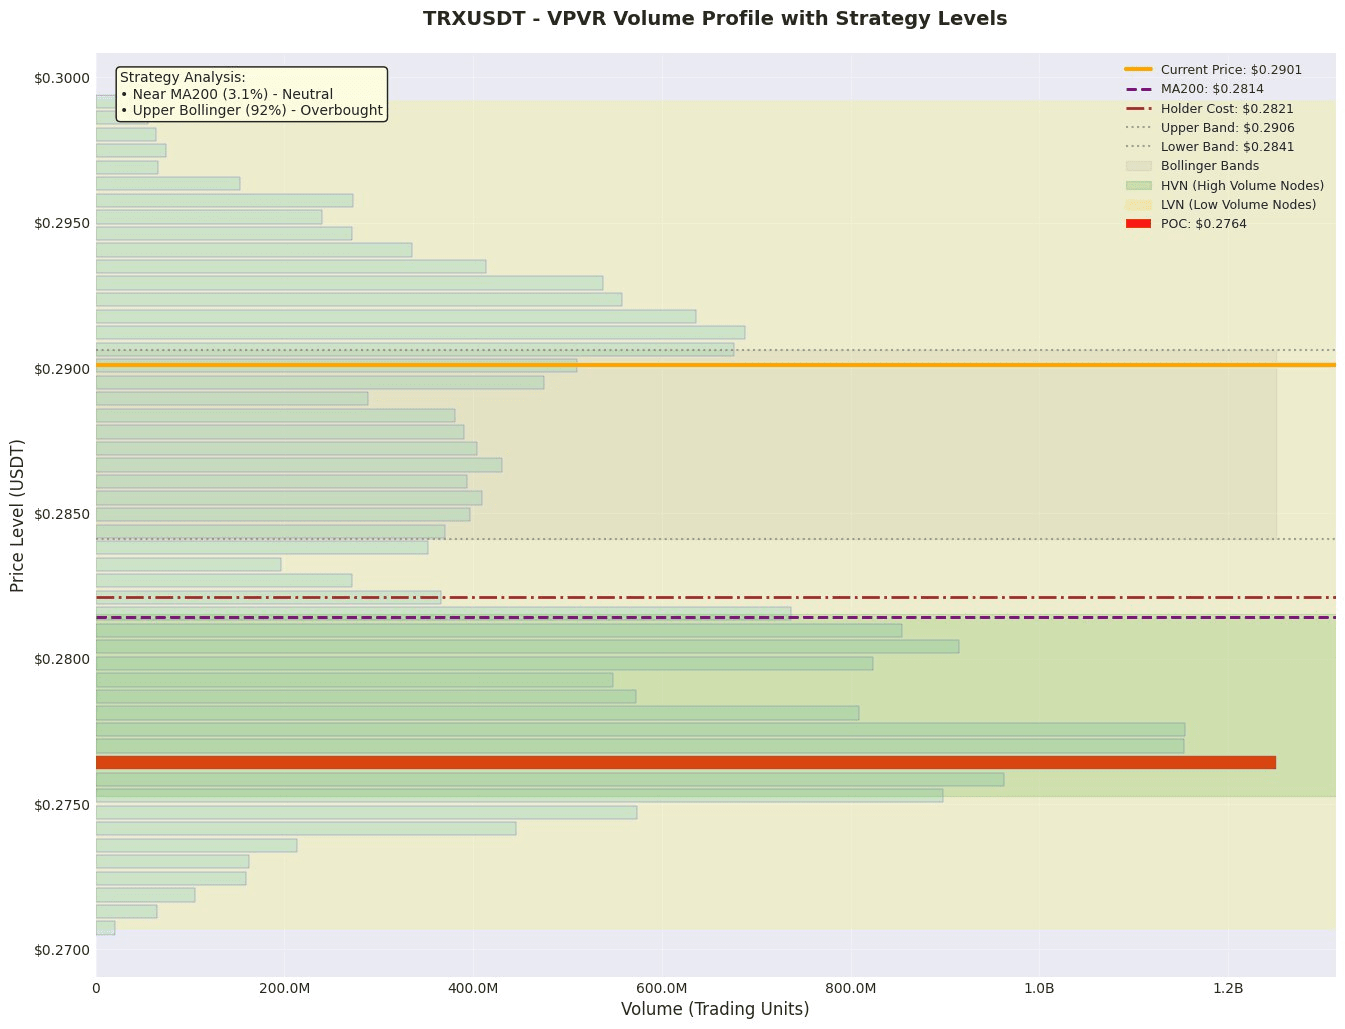
1. Value Anchoring Zone: Based on VPVR data, the POC (Point of Control) is at 0.2764, and the Value Area ranges from 0.2741 to 0.2929. The current price of 0.2901 is near the upper edge of the value area, indicating that the price has entered the resistance zone of the recent concentrated trading area. The POC serves as a strong support reference below, while the VAH (0.2929) is a key resistance level in the recent bullish-bearish battle.
2. Trend and Volatility Range: The price of 0.2901 is about 3.1% higher than MA200 (0.2814), indicating a medium to long-term upward trend. The upper Bollinger Band is at 0.2906, and the current price is at 92.2% of the Bollinger Band, extremely close to the upper band, showing short-term overbought conditions and pullback pressure. The Bollinger Band range (0.2841 - 0.2906) is narrowing, indicating that the price is about to choose a direction.
3. High Volume/High Volume Node (HVN): The area around 0.2764, where the Point of Control (POC) is located, is a clear high volume area and serves as a core support during price pullbacks. Additionally, the Value Area itself (0.2741 - 0.2929) constitutes a wide range of concentrated positions, and price fluctuations within this range are normal.
Derivatives and Liquidity Analysis
• Leverage and Sentiment: The long-short ratio rose from 0.7000 to 0.8358, indicating an increase in bullish sentiment in the contract market. The funding rate is positive (0.00010000), which also confirms that long positions need to pay fees, with the market leaning bullish. The OI/Market Cap ratio reaches 816311.06%, indicating that the scale of contract positions is extraordinarily large relative to the spot market cap, resulting in extremely high market leverage and accumulation of risk.
• Liquidity Signals: The change in contract trading volume is -95.1%, showing a cliff-like drop, which is a typical signal of liquidity exhaustion. Combined with an open interest (OI) of 108.36M, it presents a pattern of 'volume shrinking while price rises, positions remain unchanged', possibly indicating that institutional funds are in control or market participants are highly cautious.
• Operational Insights: In an environment of plummeting trading volume and extremely high leverage, the market is highly fragile, and any reverse fluctuations may trigger a chain liquidation. It is absolutely unsuitable to increase leverage; positions should be significantly reduced or remain on the sidelines, waiting for trading volume to recover and the price structure to clarify.
News and Event Impact
Currently, there are no major news events directly influencing the market. Price fluctuations are primarily driven by technical factors and the structure of the derivatives market.
Trading Strategy
Plan A: Aggressive Pullback Long (Betting on Trend Continuation)
• Direction: Long
• Logic: The price is above MA200 and the cost of positions, with a bullish trend. Wait for the price to pull back from the overbought upper Bollinger Band to key support levels to seek buying opportunities.
• Entry Range: 0.2840 - 0.2860 (Bollinger Band mid-line and below, close to the recent price range lower edge)
• Stop Loss Level: 0.2810 (below MA200; if it breaks, the trend may weaken)
• Target Level: 0.2925 (Value Area upper edge VAH resistance level)
• Expected Profit-Loss Ratio Calculation:
• Potential Profit = Target Level - Entry Average Price ≈ 0.2925 - 0.2850 = 0.0075
• Potential Loss = Entry Average Price - Stop Loss Level ≈ 0.2850 - 0.2810 = 0.0040
• Profit-Loss Ratio = 0.0075 / 0.0040 ≈ 1.88
Plan B: Conservative Short on Breakout Failure (Betting on Overbought Pullback)
• Direction: Short
• Logic: The price is closely sticking to the upper Bollinger Band, with strong overbought signals. If it fails to break above VAH (0.2929) with volume, it may quickly pull back to the value range.
• Entry Range: 0.2915 - 0.2925 (when testing VAH fails, and a bearish candlestick pattern appears)
• Stop Loss Level: 0.2945 (confirming the breakout is effective with sufficient space above VAH)
• Target Level: 0.2840 (Bollinger Band mid-line support) or 0.2770 (strong support at POC)
• Expected Profit-Loss Ratio Calculation (taking the first target as an example):
• Potential Profit = Entry Average Price - Target Level ≈ 0.2920 - 0.2840 = 0.0080
• Potential Loss = Stop Loss Level - Entry Average Price ≈ 0.2945 - 0.2920 = 0.0025
• Profit-Loss Ratio = 0.0080 / 0.0025 = 3.20
Risk Warning and Position Management
1. Extreme Leverage Risk: The OI/Market Cap ratio reaches 816311.06%, and the overall market leverage is extremely high. Any reverse price fluctuations may easily trigger large-scale long and short explosions, exacerbating price volatility.
2. Liquidity Exhaustion Risk: Contract trading volume plummeting by 95.1% indicates insufficient market depth. Large orders may easily cause price 'spikes', leading to unexpected stop-loss triggers.
3. Long Position Crowding Risk: The long-short ratio continues to rise to 0.8358, with a positive funding rate. The market long positions may be overly crowded, creating potential conditions for a 'long squeeze'.
Position and Risk Control Recommendations:
• Absolutely prohibit the use of high leverage; it is recommended that the leverage ratio does not exceed 3-5 times.
• Adopt a staggered light position strategy, with any single trade's risk exposure not exceeding 1%-2% of total funds.
• Before the contract trading volume has significantly recovered (e.g., rising above 50% of the pre-decline average), prioritize observation, or conduct short-term operations with very small positions.
• When setting stop losses, consider the main order positions (e.g., although sell orders cluster at 0.3898 and 0.45, the buy orders concentrated near 0.2898 may form instantaneous support/resistance), and appropriately widen the stop-loss space to avoid accidental triggers due to insufficient liquidity.
Like and follow for real-time updates!
$TRX

