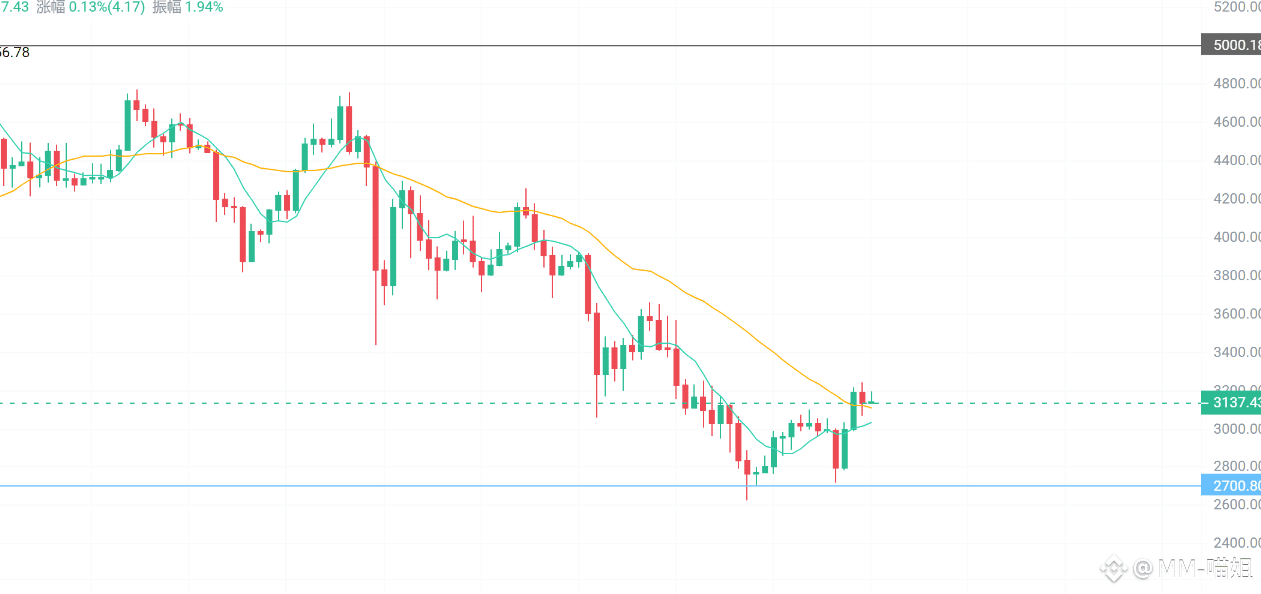
The daily structure of Ethereum is quite interesting:
It has only broken through the first descending trend line, which means the downtrend is basically over, but it hasn't passed the second one yet, so it can't be called a reversal for now; we can only say "the wind is changing." Yesterday's large bullish candle broke the 3100 neckline, and today there's a small bearish candle, which just happens to form a pregnant line pattern, indicating that the short-term is still more volatile.
Next, we will see how the lines close over the next two days, whether it's a true breakthrough or a false one, and we'll know soon enough. The bulls at the bottom are showing increased volume, and the MACD has also formed a golden cross after a bottom divergence, which is a good signal. In the short term, I see a range of oscillations, moving back and forth between 3066—3240 USD.
It has only broken through the first descending trend line, which means the downtrend is basically over, but it hasn't passed the second one yet, so it can't be called a reversal for now; we can only say "the wind is changing." Yesterday's large bullish candle broke the 3100 neckline, and today there's a small bearish candle, which just happens to form a pregnant line pattern, indicating that the short-term is still more volatile.
Next, we will see how the lines close over the next two days, whether it's a true breakthrough or a false one, and we'll know soon enough. The bulls at the bottom are showing increased volume, and the MACD has also formed a golden cross after a bottom divergence, which is a good signal. In the short term, I see a range of oscillations, moving back and forth between 3066—3240 USD.