🚨 MACD Crossover Alert! Is DOT Ready for a Bounce?
The daily chart analysis of DOT/USDT shows a key price struggle. Although the long-term trend is bearish, momentum indicators suggest that a short-term bounce is imminent.
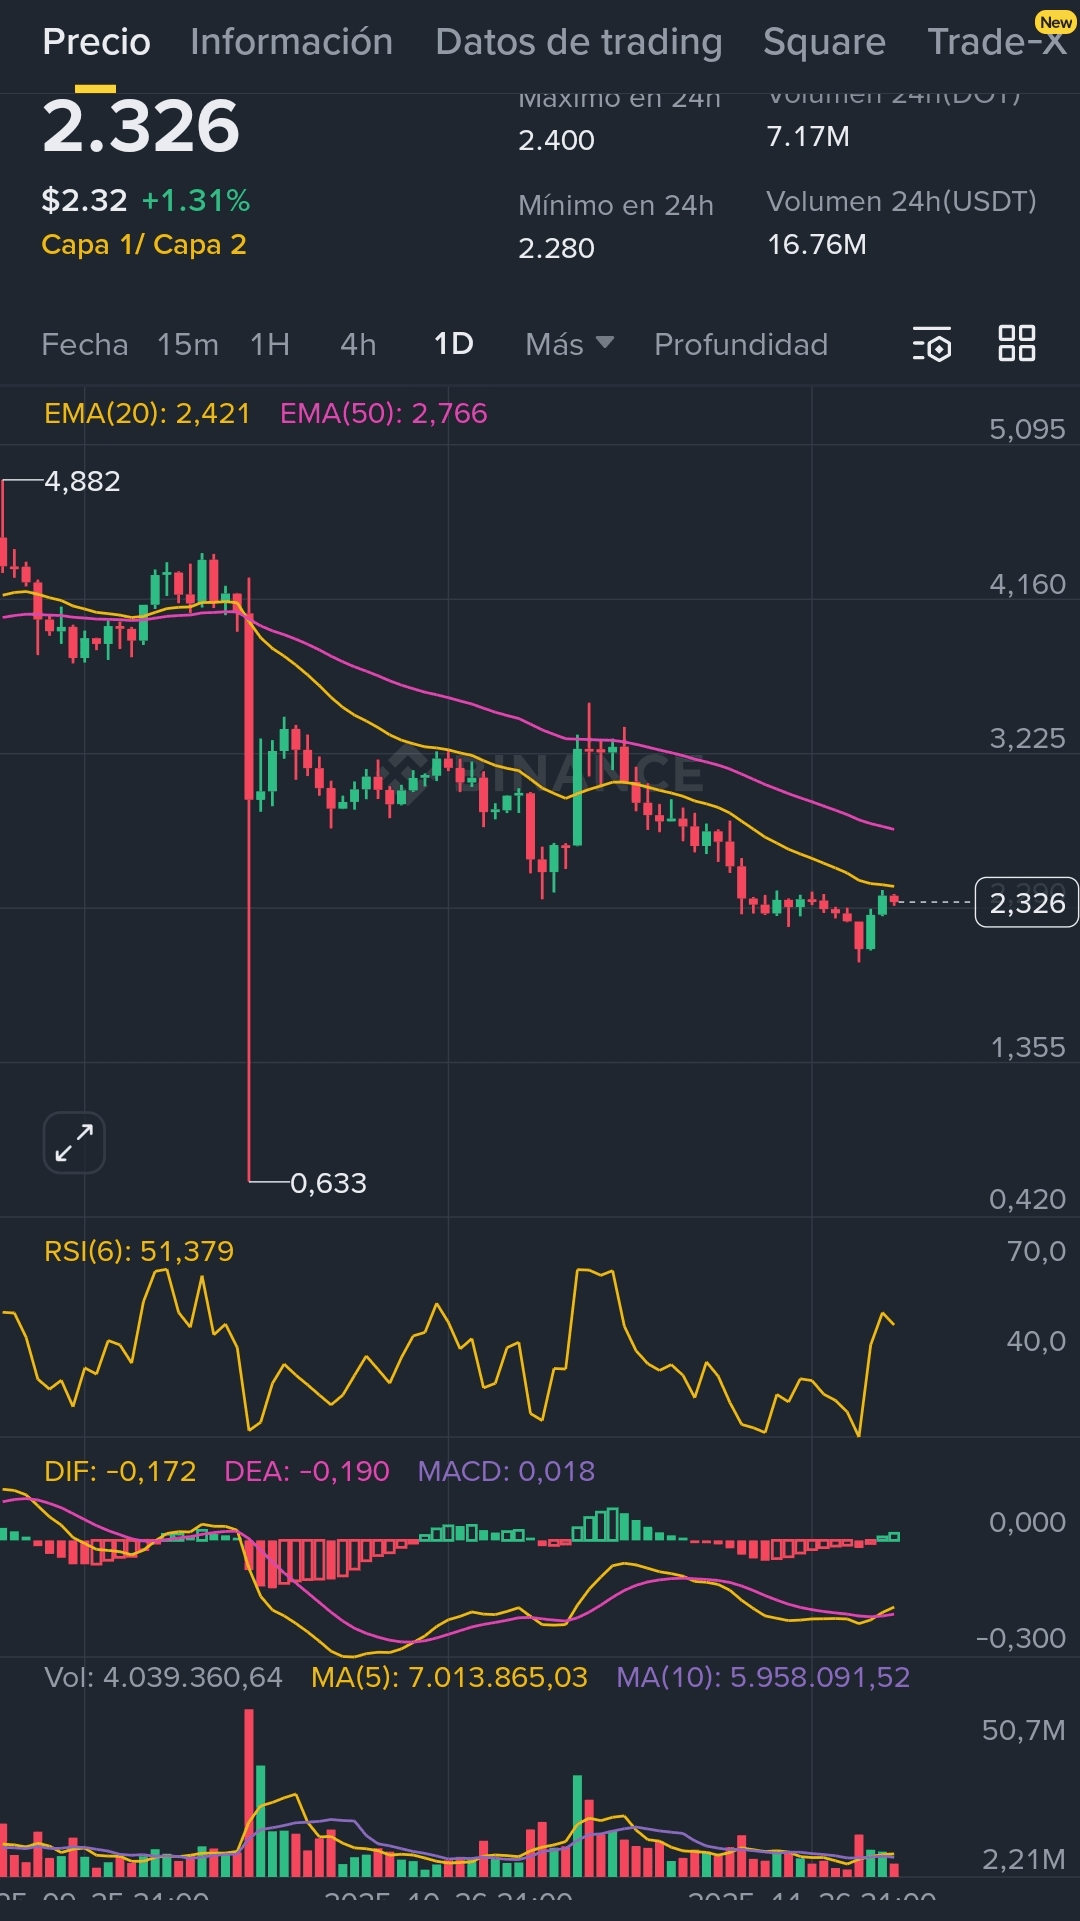
Current Price: 2.326 USDT
1. 📉 Key Trend and Resistance
DOT is in a low consolidation zone after a significant drop.
Major Resistance (Bearish): The price is trapped below moving averages. It needs to break strongly above the EMA(20) at $2.421 and, crucially, the EMA(50) at $2.766 to negate the current bearish trend.
Battle Zone: As long as DOT remains below $2.421, sellers maintain control. The RSI is at 51.379, completely neutral.
2. 💡 The Bullish Momentum Signal
The most important technical signal is the MACD (Moving Average Convergence Divergence):
The histogram has crossed to positive (0.018), indicating a recent bullish crossover of the MACD line over the signal line.
Meaning: This crossover implies that selling momentum is waning and buying pressure is beginning to manifest. It is the first sign that a relief rally or bounce may be forming.
3. 🔮 Operational Levels to Follow
⚡️ Bounce Target (Exceeding $2.421): $2.766 (EMA 50 level, which is the main resistance).
🛑 Critical Support (If the MACD fails): $2.280 (The 24-hour low, which must be maintained to avoid further declines).
#dot #Polkadot #CriptoAnálisis #BinanceSquare #BinanceBlockchainWeek