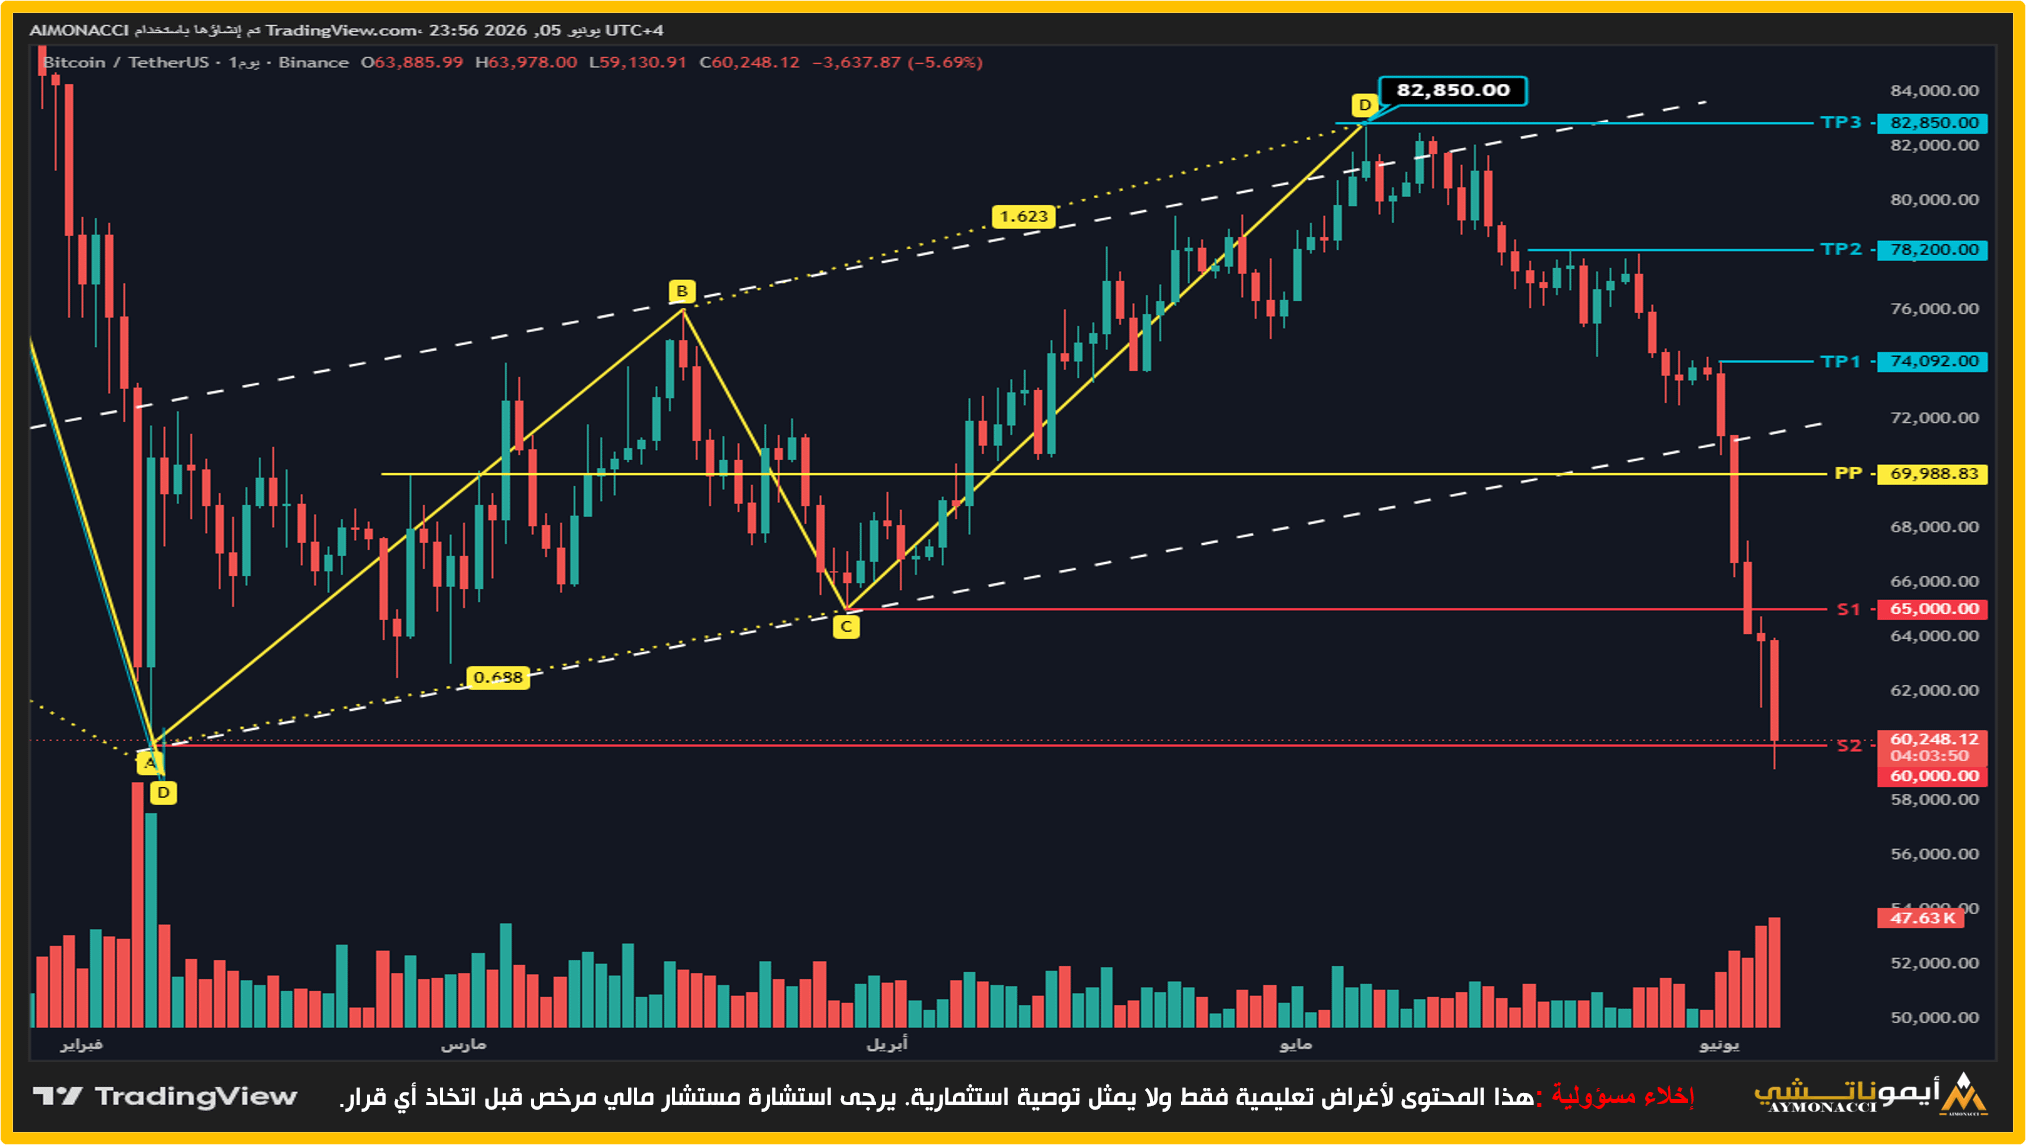
🔍 Analysis $BTC | Daily Chart AYMONACCI Technical Analysis
The price has completed the classic ABCD pattern accurately at the 1.623 Fibonacci extension — the target was previously set at $82,850 and was hit exactly.
After completing the pattern, the reaction was sharp — the price broke the ascending channel with massive sell volume and dropped from $82,850 to $60,248 in a relentless move.
📊 Critical levels now:
🔵 Pivot Point PP ← $69,988 🟡 First Support S1 ← $65,000 🔴 Second Support S2 ← $60,000 ⚠️ Current Price ← $60,248
The price is trading just above S2. This zone between $60,000 and $60,248 is the real test now.
There are two scenarios only: ✅ A technical bounce from S2 targeting $65,000 first ❌ A break of S2 opens the door for deeper levels
💬 What do you expect? Bounce or break? Drop your thoughts in the comments 👇
#بيتكوين #كريبتو #BTCUSDT #Bitcoin #Binance
The price has completed the classic ABCD pattern accurately at the 1.623 Fibonacci extension — the target was previously set at $82,850 and was hit exactly.
After completing the pattern, the reaction was sharp — the price broke the ascending channel with massive sell volume and dropped from $82,850 to $60,248 in a relentless move.
📊 Critical levels now:
🔵 Pivot Point PP ← $69,988 🟡 First Support S1 ← $65,000 🔴 Second Support S2 ← $60,000 ⚠️ Current Price ← $60,248
The price is trading just above S2. This zone between $60,000 and $60,248 is the real test now.
There are two scenarios only: ✅ A technical bounce from S2 targeting $65,000 first ❌ A break of S2 opens the door for deeper levels
💬 What do you expect? Bounce or break? Drop your thoughts in the comments 👇
#بيتكوين #كريبتو #BTCUSDT #Bitcoin #Binance