

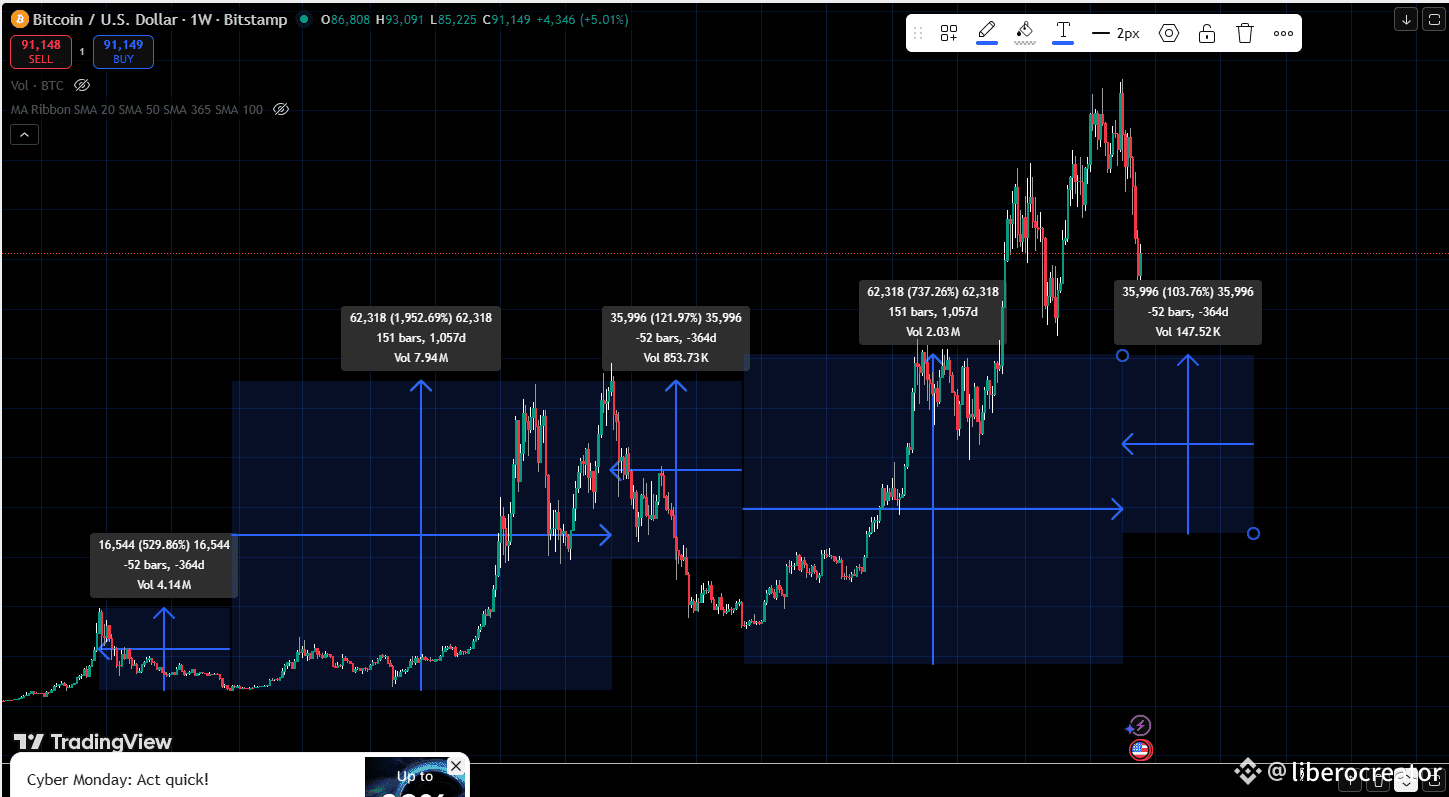
It’s often said that history doesn't repeat itself, but it certainly rhymes. Today, using analysis dating back to 2015, we can see Bitcoin’s price following the same structural blueprint on the Weekly timeframe.
This Fractal Cycle Analysis shows that the market moves in two distinct, repeatable phases:
1. 🟦 The Accumulation Phase (Horizontal Blue Box)
This is the quiet, passive phase where retail traders get bored, and institutions silently accumulate assets after a bear market. We saw this in 2015-2016 and again in 2019-2020. This period tests patience.
2. 🟢 The Expansion Phase (Post-Breakout)
This is The Money Printing Phase, where the price explodes vertically after the Halving event and the preceding accumulation period. This defined the massive rallies of 2017 and 2021.
🎯 Where Are We Right Now?
If this historical halving cycle pattern holds true (and my chart shows a remarkable match since 2015):
We have just completed the Accumulation Phase following the 2022 bear market and are now entering the explosive Expansion Phase—just like the years leading into 2017 and 2021.
Key Takeaway: Massive, long-term bullish pressure is being built by smart money. While we may have missed the absolute bottom, the opportunity for a multi-year significant move is opening right now.
CALL TO ACTION:
If you are currently on the sidelines, this structure provides strong conviction to position for the long term. If you are already long, hold tight!
What are your thoughts? Will the cycle prove accurate for the third time?
#Bitcoin #BTC #CryptoCycle #FractalAnalysis $BTC #BTCRebound90kNext? #BinanceHODLerAT #ETHBreaksATH #BTCHashratePeak #BitcoinSPACDeal