Ethereum price declined from the $1,840 resistance against the US Dollar. ETH is now likely to move towards the $1,620 support area.
Ethereum is struggling and moving lower from the $1,840 area.
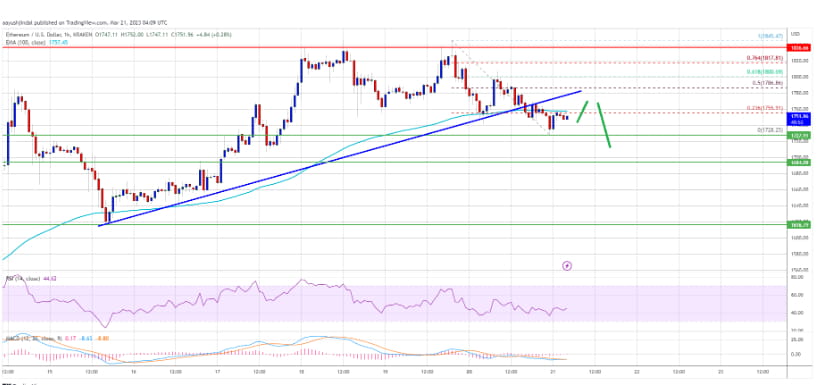
The price is trading below $1,750 and the 100 hourly simple moving average.
There was a break above a major bullish trend line with support near $1,765 on the hourly chart of ETH/USD (data source from Kraken).
The pair could decline further if there is a clear break below the $1,720 support.
Ethereum price drops further
Ethereum price has failed to accelerate above the $1,850 resistance. ETH formed a double top pattern near $1,850 and recently started a downside correction, similar to bitcoin.
There was a break below the $1,780 and $1,760 support levels. Moreover, the price declined below a major bullish trend line with support near $1,765 on the hourly chart of ETH/USD. The pair even settled below the $1,740 support area.
Ether price is now trading below the $1,750 level and the 100 hourly simple moving average. A low was formed near $1,728 and the price is now consolidating losses.
On the upside, the price is facing resistance near the $1,755 area and the 100 hourly simple moving average. It is close to the 23.6% Fib retracement level of the recent decline from the $1,845 swing high to $1,728 low. The next major resistance is near the $1,780 area.
The first major resistance is near the $1,800 level or the 61.8% Fib retracement level of the recent decline from the $1,845 swing high to $1,728 low. A close above the $1,800 resistance could start another major increase. In this case, the price could move higher towards the $1,880 resistance. Any more gains could push the price towards $1,920.
ETH Loses More?
If Ethereum fails to clear the $1,780 resistance, it is likely to continue to decline. An initial support on the downside is near the $1,730 level.
The next major support is near the $1,695 area. If it falls below $1,695, the price could drop towards $1,620. Any more losses might entail a test of the $1,550 level.
Technical indicators
Hourly MACD – The MACD for ETH/USD is now gaining momentum in the bearish zone.
Hourly RSI – The RSI for ETH/USD is now below the 50 level.
Major Support Level – $1,730
Major Resistance Level – $1,780