BTC Exhaustion vs. NEAR Resilience
The market is giving us a masterclass on price behavior today. We have a clear technical divergence between Bitcoin and NEAR, and what we see on the charts tells very different stories:
📉 Bitcoin (BTC): The shock of volatility
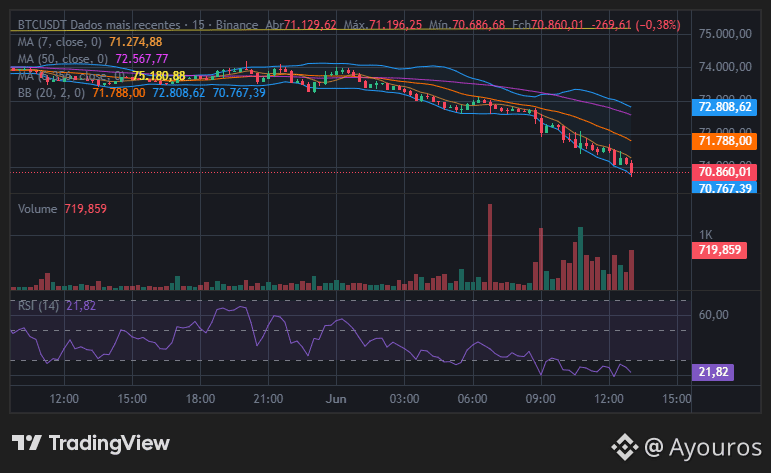
The 15m candlestick chart in screenshot (43).png shows a sharp downward movement, driving the price down to around 70,860. The standout data point here is the RSI at 21.82, indicating that the asset is deeply in the oversold zone. It’s a classic sign of selling exhaustion in the short term.
⚖️ NEAR Protocol (NEAR): Holding the base
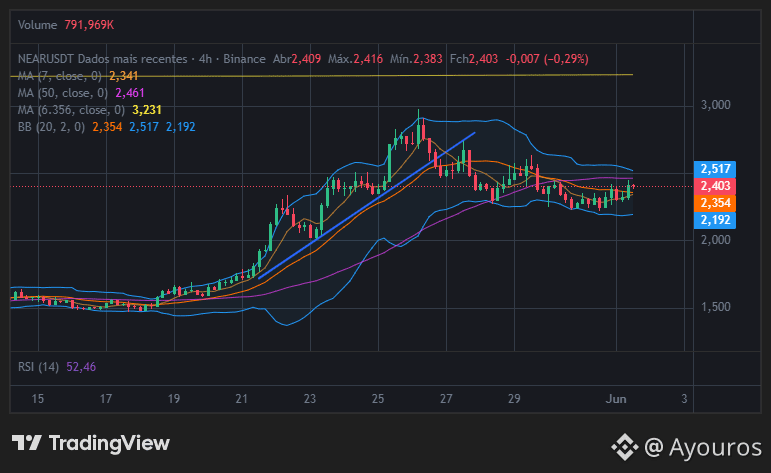
While the "king" corrects, NEAR shows remarkable resilience on the 4h chart. As seen in screenshot (44).png, the asset remains consolidated around 2.40, with a neutral RSI at 52.46. No panic here; the price shows it has found a technical equilibrium even with external pressure.
My analysis:
We’re witnessing a tug of war. BTC, being the market thermometer, feels the immediate impact of liquidations, creating accumulation opportunities ("the discount"). Meanwhile, NEAR demonstrates relative strength, holding its support and not following the steep decline.
The market is testing the patience of those positioned. For long-term visionaries, moments like this (BTC with RSI around 20) often serve as the "filters" that separate speculators from investors.
What about you? Are you taking advantage of BTC's oversold conditions to accumulate or are you watching NEAR's relative strength? Share your thoughts in the comments. 👇
#Bitcoin #NEAR #TechnicalAnalysis #Crypto #Trading #SniperTrading
The market is giving us a masterclass on price behavior today. We have a clear technical divergence between Bitcoin and NEAR, and what we see on the charts tells very different stories:
📉 Bitcoin (BTC): The shock of volatility
The 15m candlestick chart in screenshot (43).png shows a sharp downward movement, driving the price down to around 70,860. The standout data point here is the RSI at 21.82, indicating that the asset is deeply in the oversold zone. It’s a classic sign of selling exhaustion in the short term.
⚖️ NEAR Protocol (NEAR): Holding the base
While the "king" corrects, NEAR shows remarkable resilience on the 4h chart. As seen in screenshot (44).png, the asset remains consolidated around 2.40, with a neutral RSI at 52.46. No panic here; the price shows it has found a technical equilibrium even with external pressure.
My analysis:
We’re witnessing a tug of war. BTC, being the market thermometer, feels the immediate impact of liquidations, creating accumulation opportunities ("the discount"). Meanwhile, NEAR demonstrates relative strength, holding its support and not following the steep decline.
The market is testing the patience of those positioned. For long-term visionaries, moments like this (BTC with RSI around 20) often serve as the "filters" that separate speculators from investors.
What about you? Are you taking advantage of BTC's oversold conditions to accumulate or are you watching NEAR's relative strength? Share your thoughts in the comments. 👇
#Bitcoin #NEAR #TechnicalAnalysis #Crypto #Trading #SniperTrading