

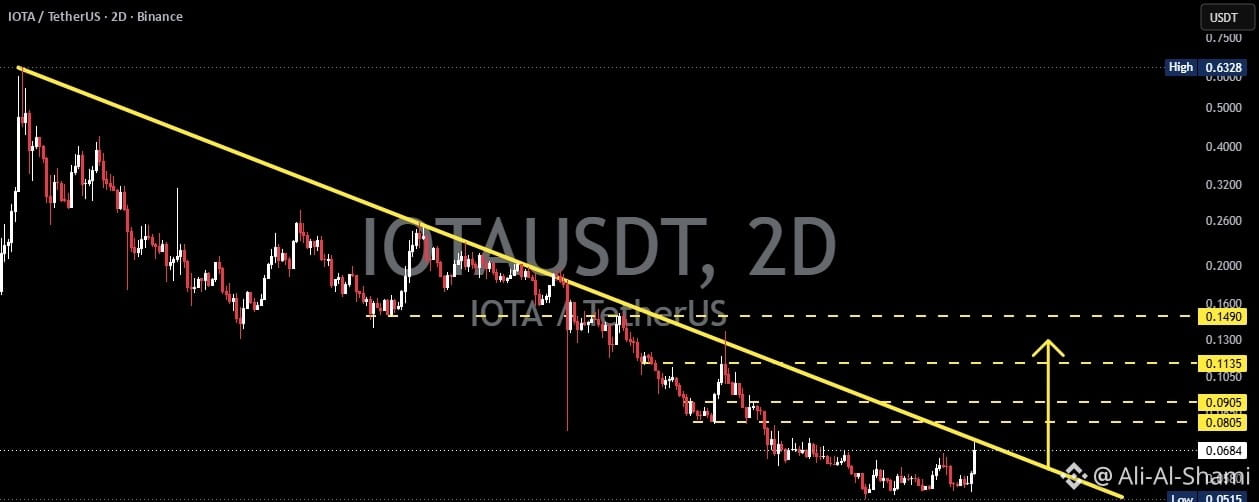

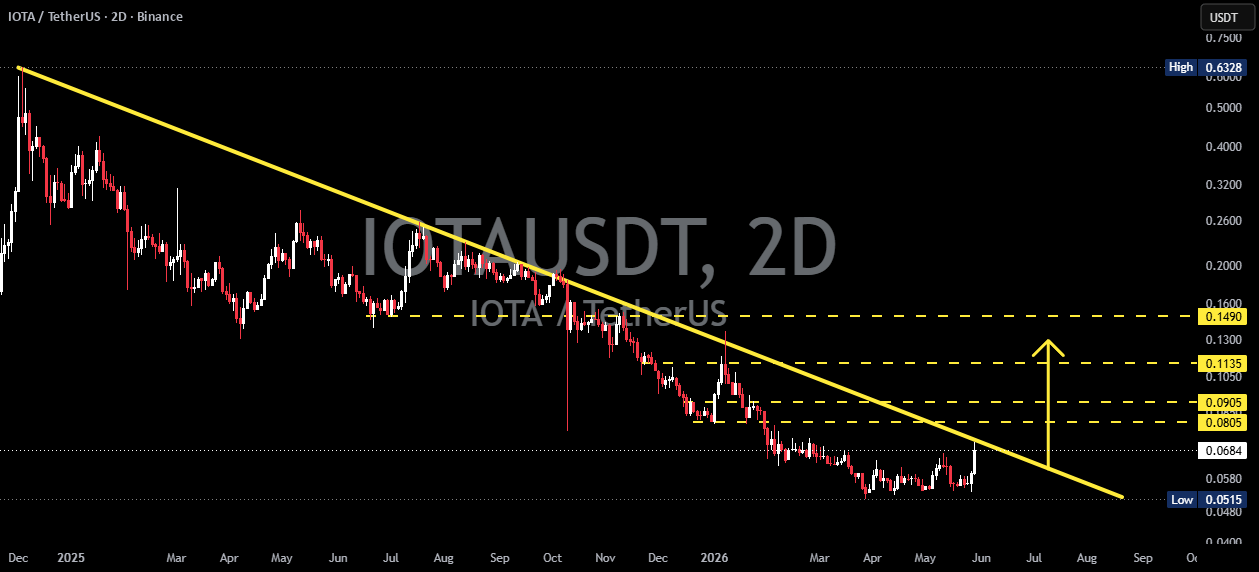
On the 2D timeframe, IOTA/USDT remains entrenched in a long-term bearish structure, illustrated by the main descending trendline (the yellow line) that has been constraining price action since late 2024.
However, after months of decline, the price is now approaching this line again and is showing signs of accumulation near the lower range around $0.05–$0.07. This creates a potential opportunity for a trend reversal if the main resistance is successfully broken.
📈 From a technical standpoint, the current area represents a critical decision zone that may determine whether IOTA begins a recovery phase or continues the downtrend.
---
🔍 Pattern formations: Descending trend line
📉 Pattern characteristics
🔸 The descending trend line has acted as dynamic resistance for several months.
🔸 Previous bullish attempts have consistently been rejected by this line.
🔸 The price is now retesting the same resistance area after forming a series of higher lows near the bottom.
💡 This type of structure often becomes the foundation for a trend reversal if a breakout occurs with strong volume confirmation.
---
🟢 Bullish scenario
The bullish trend becomes more valid if the price can:
✅ The breakout and decisive close above the descending trend line.
✅ Successfully retesting the line and flipping it to support.
✅ Break through the next horizontal resistance levels:
🎯 Target 1: $0.0805
🎯 Target 2: $0.0905
🎯 Target 3: $0.1135
🎯 Target 4: $0.1490
🚀 If the buying momentum continues to strengthen, the $0.1490 level may become a very attractive target in the medium term, as it represents a major historical resistance area.
🔥 Breakouts from long-term trend lines often generate stronger moves than regular breakouts as short positions start to get squeezed while investors regain confidence and re-enter the market.
---
🔴 Bearish scenario
The bearish structure remains intact as long as the price stays below the descending trend line.
⚠️ Another rejection from this line could trigger renewed selling pressure.
⚠️ A failed breakout could create a new lower high structure.
⚠️ If the lower support zones fail to hold, the price may revert to:
📍 Key support: $0.0515
📉 A breakdown below this level will confirm that the long-term downtrend is still in play, potentially opening the door for new lows.
---
📌 Key levels to watch
🚧 Resistance Levels
🔹 $0.0805
🔹 $0.0905
🔹 $0.1135
🔹 $0.1490
🛡️ Support levels
🔸 $0.0685
🔸 $0.0580
🔸 $0.0515
---
💡 Conclusion
📍 IOTA is currently trading at one of the most significant technical zones in recent months. After a long downtrend, the price is now approaching the descending trend line that has acted as a major barrier for upward movement.
🚀 A confirmed breakout could pave the way towards $0.0805, $0.0905, $0.1135, and possibly $0.1490, indicating the start of a larger trend reversal.
⚠️ However, until the resistance trend line is decisively broken, the long-term bearish structure must be respected.
🎯 Traders should wait for a clear breakout or rejection confirmation before making trading decisions, as this area is likely to define the next major directional move for IOTA.

#SolsticeInstitutionsCryptoInfra #SuiMainnetResumes #CustodiaBankFedAppealExtension #IranStrikesKuwaitBase