$ETH
It's been a long time since I last opened the app. Are you all still alive? 😰
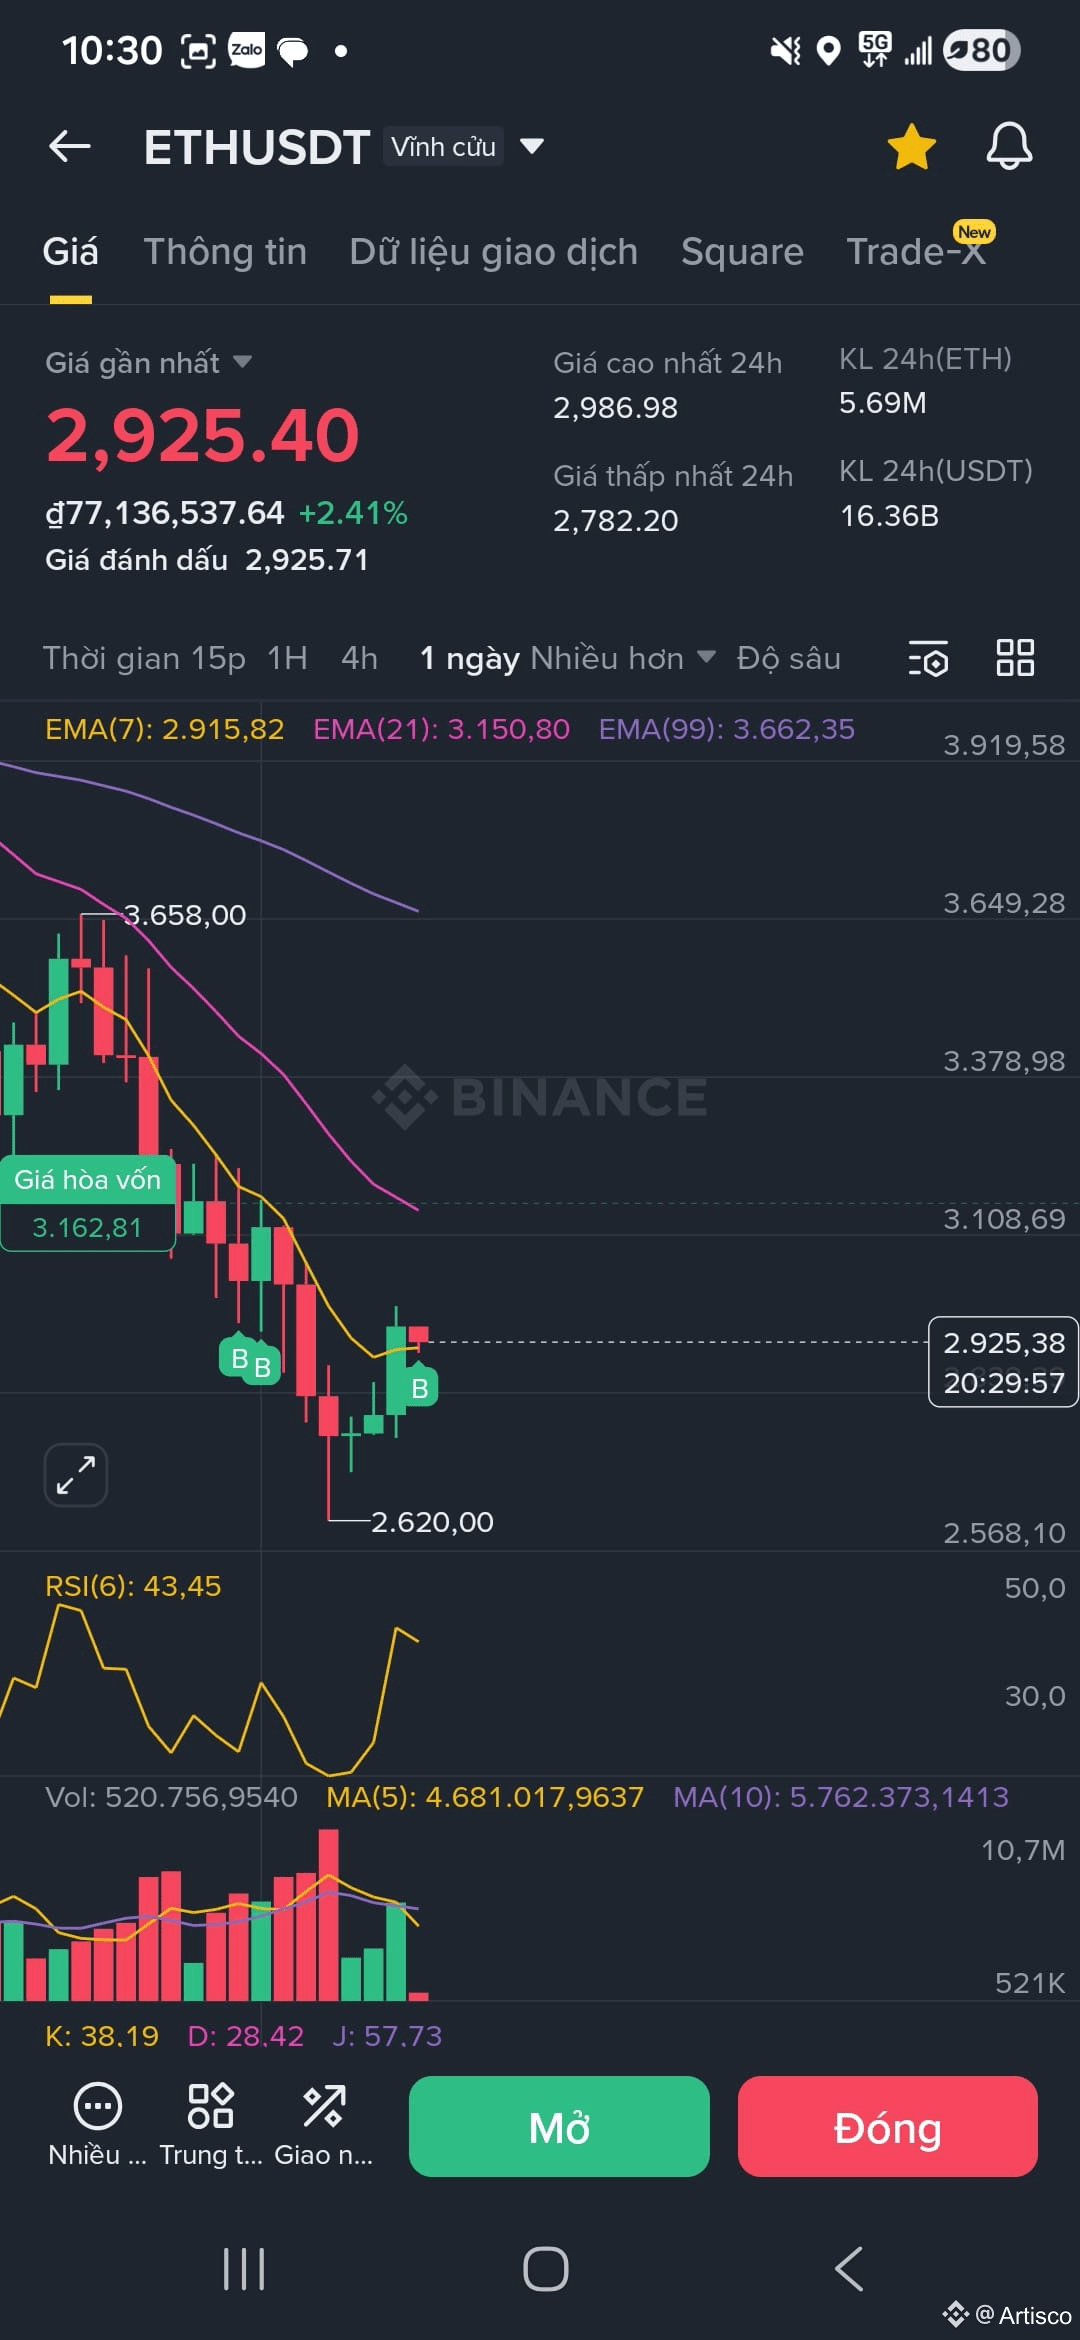
After being tricked by the H4 chart twice. Today I'm opening the DCA app again, enough to meet the D1 standard: new bottom -> retracement -> closing price above ema7, OBV RSI rising together.
If the bottom of 2620 is broken, the next phase will follow the standard of the larger chart than D3, a long-term view on spot or future margin 1 2x.
There are 5 days left until the ETH monthly candle closes, it's quite important, let's watch together.
1. Scenario 1 – ETH retraces to 3,000 – 3,050 then sideways for 2–4 weeks
Probability: 50% (highest)
Reason:
RSI low -> needs to retrace to reset the index
Current ETH funding is not too bad
BTC is also slightly bouncing from the bottom
This is a "rebound to accumulate" model after the drop of 5 consecutive D3 candles
D3 ETH is very suitable to create a base at 3k then move sideways.
2. Scenario 2 – ETH only retraces to 2,950 then continues to drop to 2,500 – 2,550
Probability: 40%
Currently, there are no immediate signs of a further drop, but it cannot be overlooked. Because the dump is very strong, BTC although the red volume is not large does not need to be actively sold, but the monthly chart's upward movement has not paused from 16k, and the volume gradually decreasing to this point is critical. If it continues to not improve, long-term holders will have to gradually give up.
3. Scenario 3 – ETH breaks out above 3,150 early
Probability: 10%
This only happens if:
BTC bounces very strongly
ETH funding is deeply negative
D1 starts to have a Gold Cross EMA accompanied by gradually increasing Volume
Currently, there are no conditions.
It's been a long time since I last opened the app. Are you all still alive? 😰
After being tricked by the H4 chart twice. Today I'm opening the DCA app again, enough to meet the D1 standard: new bottom -> retracement -> closing price above ema7, OBV RSI rising together.
If the bottom of 2620 is broken, the next phase will follow the standard of the larger chart than D3, a long-term view on spot or future margin 1 2x.
There are 5 days left until the ETH monthly candle closes, it's quite important, let's watch together.
1. Scenario 1 – ETH retraces to 3,000 – 3,050 then sideways for 2–4 weeks
Probability: 50% (highest)
Reason:
RSI low -> needs to retrace to reset the index
Current ETH funding is not too bad
BTC is also slightly bouncing from the bottom
This is a "rebound to accumulate" model after the drop of 5 consecutive D3 candles
D3 ETH is very suitable to create a base at 3k then move sideways.
2. Scenario 2 – ETH only retraces to 2,950 then continues to drop to 2,500 – 2,550
Probability: 40%
Currently, there are no immediate signs of a further drop, but it cannot be overlooked. Because the dump is very strong, BTC although the red volume is not large does not need to be actively sold, but the monthly chart's upward movement has not paused from 16k, and the volume gradually decreasing to this point is critical. If it continues to not improve, long-term holders will have to gradually give up.
3. Scenario 3 – ETH breaks out above 3,150 early
Probability: 10%
This only happens if:
BTC bounces very strongly
ETH funding is deeply negative
D1 starts to have a Gold Cross EMA accompanied by gradually increasing Volume
Currently, there are no conditions.