



 Weekly recap
This week, from May 18 to May 25, the Ice Sugar Orange peaked around $78,200 and dipped close to $74,289, with a volatility range of about 5%.
Observing the chip distribution chart, there is a significant amount of chips traded around 80,000, which will provide certain support or resistance.
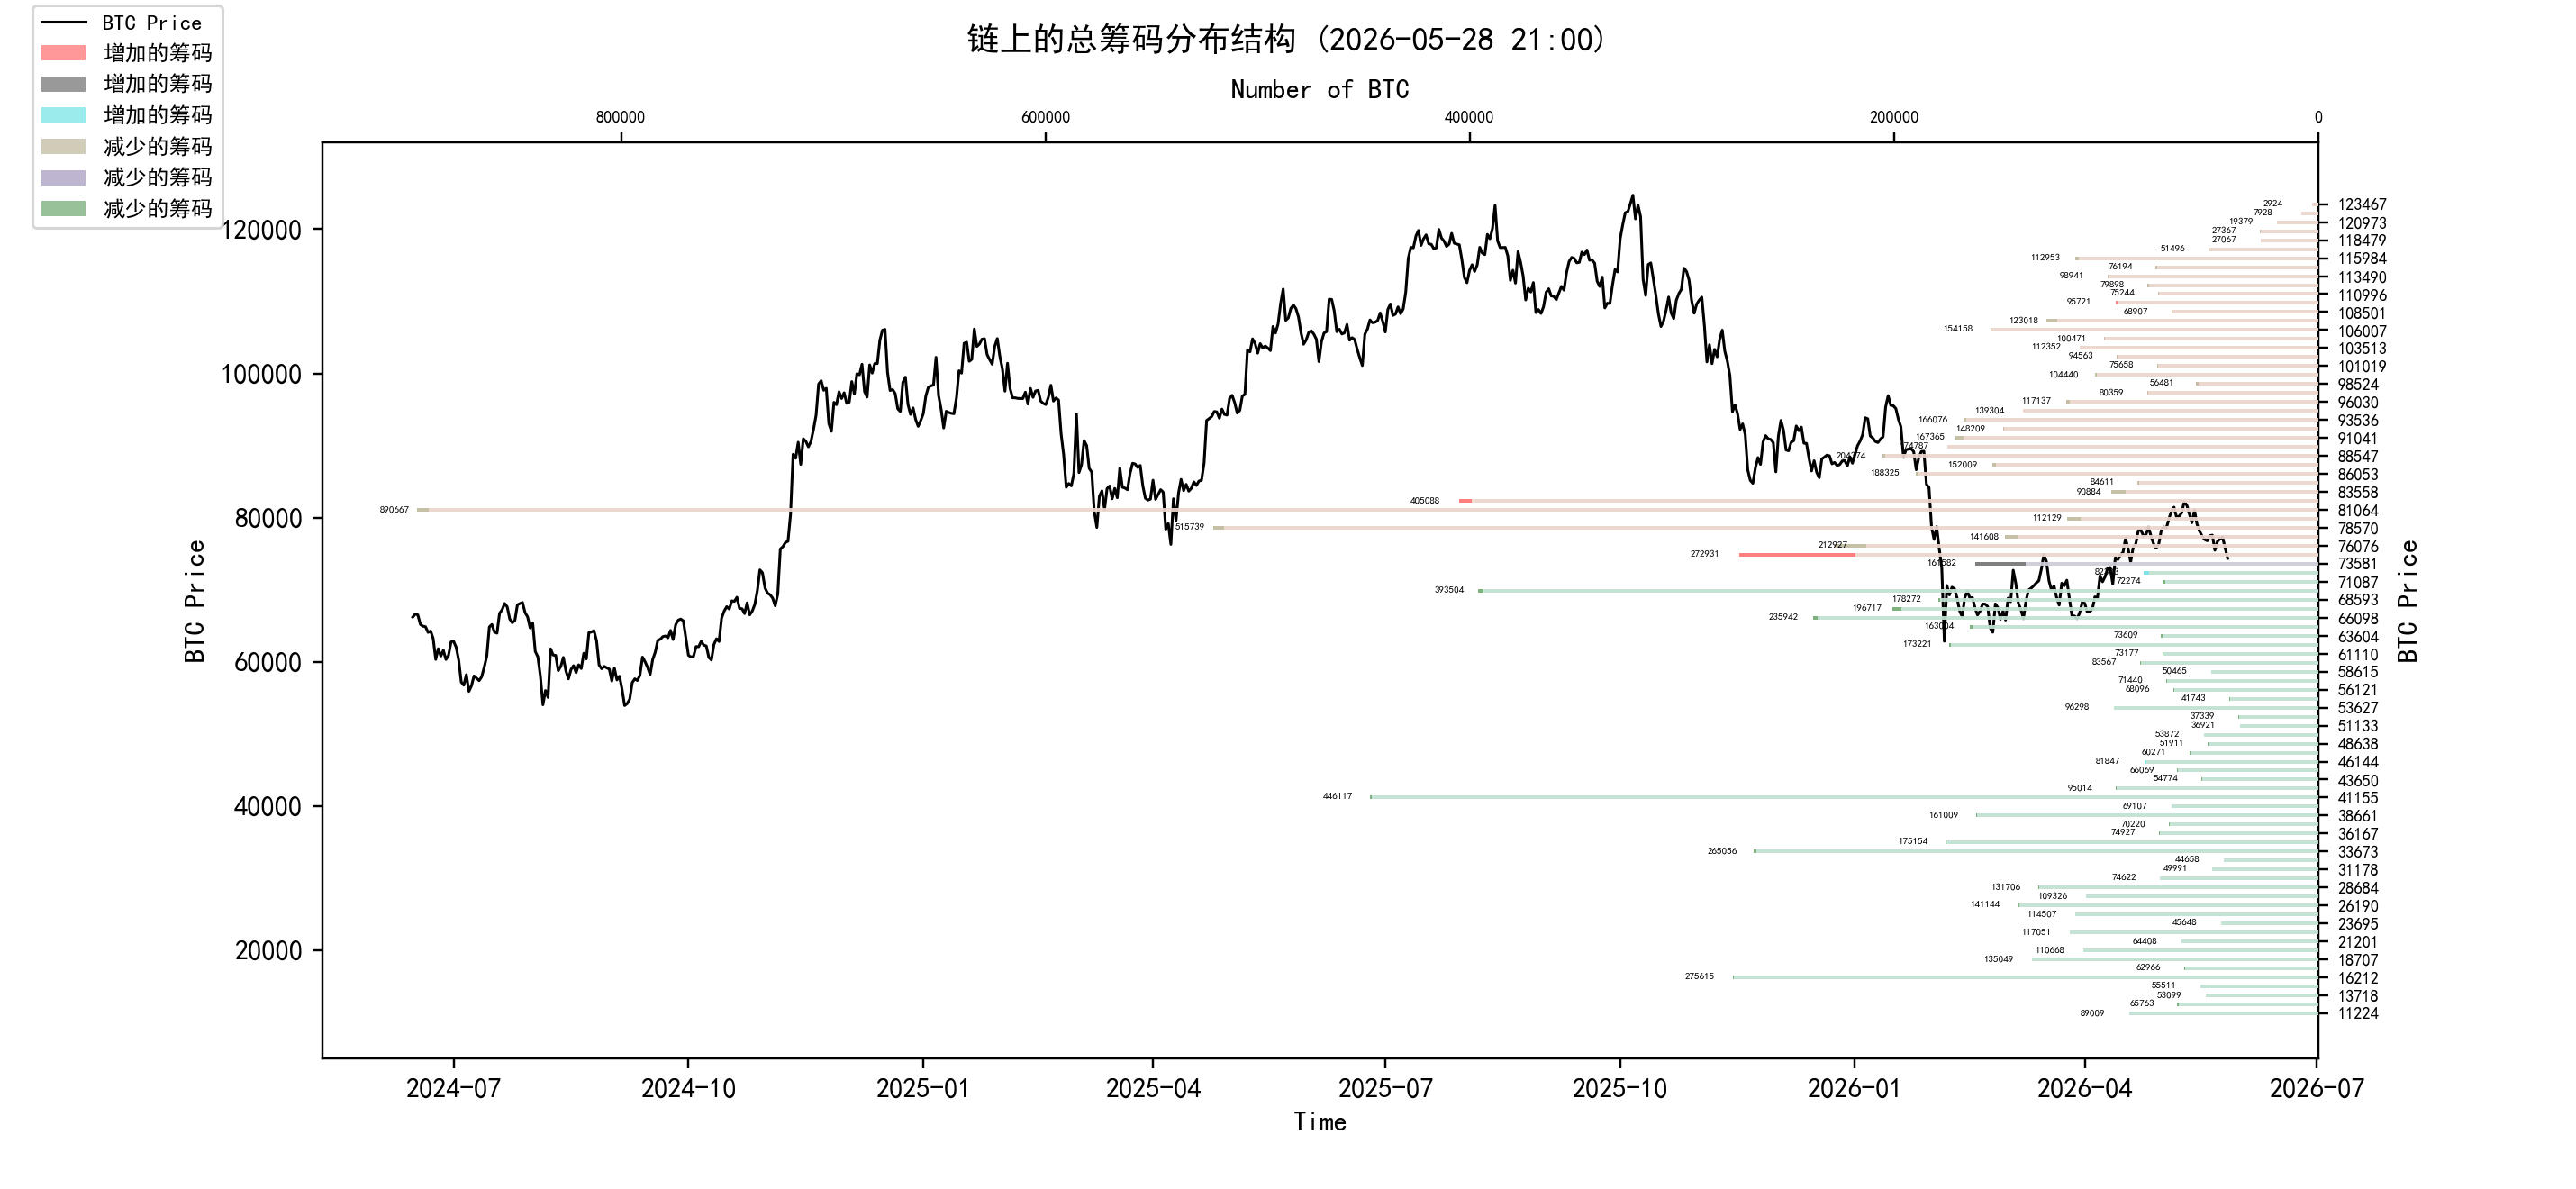
Analysis:
60,000-68,000 approximately 1.09 million coins;
76,000-89,000 approximately 2.98 million coins;
90,000-100,000 approximately 1.15 million coins;
Above 100,000 approximately 1.39 million coins;
On the important news front
On the economic news front
Oil prices fell sharply, but the Strait of Hormuz remains a core variable in the global market. This week saw a key change as oil prices notably retreated from their highs. On May 27, Iranian media reported seeing a preliminary framework draft for ending the US-Iran conflict and reopening the Strait of Hormuz, causing Brent crude to drop to around $95 and WTI to about $89. Reuters noted that Iran's effective closure of the Strait previously took over 14 million barrels per day of Middle Eastern oil offline; therefore, whether this channel reopens directly affects global inflation expectations. Institutional/market views: Dennis Kissler, trading head at BOK Financial, believes the market's previously priced-in 'extremely tight supply' is easing; however, Wealthspire Advisors argues that the so-called reopening in a month isn’t enough to fully reassure the market, as there may still be fluctuations.
US Treasury yields have become a major source of pressure on the stock and crypto markets. While US Treasury yields retreated somewhat this week due to falling oil prices, they remain significantly higher than pre-war levels. Reuters reports that since the start of the Iran-Iraq War in late February, the 10-year US Treasury yield has risen by approximately 50 basis points, and the 2-year yield by approximately 70 basis points. Institutional/market view: Societe Generale's model suggests that the 10-year US Treasury yield is around 4.5%, a key level. If it continues to rise, the correlation between stocks and bonds may turn significantly negative, meaning that "further increases in yields are generally negative for stocks."
The US dollar faces renewed strength, and global funds may continue to favor US assets. The dollar has regained attention this week. Reuters reports that higher US Treasury yields and the resilience of the US economy have widened the dollar's yield advantage relative to other currencies. Macquarie believes that if oil prices remain high and the Federal Reserve signals tightening, the dollar could strengthen further; UBS also believes that as long as interest rate differentials continue to widen in favor of the dollar, its natural path remains upward.
With a change in leadership at the Federal Reserve and persistent inflation, the market continues to trade on "higher interest rates for longer." Kevin Warsh was sworn in as Federal Reserve Chairman on May 22, taking office amid a complex situation of rising gasoline prices, increasing inflation, and declining consumer confidence. Reuters reports that Warsh pledged to lead a "reform-oriented" Fed, while some Fed officials are discussing whether to unwind their accommodative stance. Institutional/market view: The market is no longer simply trading on rate cuts, but has begun trading on the risk of a potential rate hike before the end of the year. Reuters' report on the US mortgage market also points out that the April CPI rose to 3.8% year-on-year, higher than 2.9% in August last year, and more and more Fed officials are worried that this is not a temporary energy shock, but could evolve into more persistent inflation.
U.S. consumer pressure is rising as the housing market continues to be impacted by high interest rates. The University of Michigan Consumer Sentiment Index fell to a record low of 44.8 in May, down from 49.8 in April. Joanne Hsu, the survey's director, said 57% of consumers spontaneously mentioned that high prices are eroding their personal finances, up from 50% last month.
US stocks are still supported by AI and earnings, but the market is highly concentrated. This week, US stocks are still trading near record highs. A Reuters survey shows that the median forecast of 47 strategists and fund managers is that the S&P 500 will reach 7620 points by the end of 2026, only about 1.3% higher than the current level; they also expect the S&P 500 to reach 8050 points by 2027.
The European Central Bank and the Bank of Japan remain hawkish, delaying the global easing cycle. In Europe, ECB Executive Board member Isabel Schnabel stated that Eurozone inflation has risen to 3%, and the market expects it to approach 4% by the end of the year; she believes the current energy shock is very significant and its persistence has exceeded previous adverse scenario assumptions.
China's industrial profits improved, but the recovery remains uneven. Profits of China's major industrial enterprises rose 24.7% year-on-year in April, the fastest pace since November 2023; cumulative growth from January to April was 18.2%. However, Reuters pointed out that the recovery was mainly driven by rising upstream prices, AI-related demand, and export support, while weak domestic demand and intense downstream competition remain pressures.
US-China trade relations have entered a phase of "limited easing, but with retained pressure." US Trade Representative Jamieson Greer stated that the US will solicit public opinion to determine which Chinese goods can be included in tariff reductions; the US and China have agreed to establish a joint "trade committee" to initially discuss tariff reductions or elimination on approximately $30 billion worth of non-strategic goods. However, he also emphasized that the US will continue to maintain tariffs on China, and US tariff levels on China are likely to remain higher than those on other countries for a long time.
The AI supply chain continues to expand, with Taiwan remaining a core node in the global AI hardware landscape. Nvidia CEO Jensen Huang stated that the company plans to invest approximately $150 billion annually in Taiwan, calling it a central region for the AI revolution. Nvidia's Taiwan headquarters is expected to break ground this year and be operational by 2030, further aligning with AI server and advanced manufacturing partners such as TSMC, Foxconn, Wistron, and Quanta. Market Impact: AI capital expenditure remains one of the strongest structural supports for global stock markets, benefiting semiconductors, advanced packaging, servers, power, data centers, and related supply chains. However, if US Treasury yields continue to rise, overvalued AI assets may still experience a period of correction.
Crypto ecosystem messaging
BTC, ETH, and SOL continued to weaken, and the crypto market is still following macro pricing. As of May 27, the current crypto market does not have a clear independent trend and is mainly affected by the combined influence of US Treasury yields, the US dollar, ETF fund flows, and overall risk appetite.
Market Impact: 1. If oil prices continue to fall and ETF outflows stop, the crypto market has a chance to stabilize; if the US dollar and US Treasury yields rise again, BTC and highly volatile altcoins will remain under pressure. 2. Solana-related ETFs are relatively stable, but still small in size. Farside data shows that Solana-related ETFs saw net inflows of approximately $5.8 million on May 22, but virtually no inflows on May 26. Compared to outflows from BTC and ETH ETFs, SOL funds have been relatively resilient, but the overall size remains limited. 3. SoFi pushes stablecoins to retail users, traditional finance continues to enter on-chain payments. SoFi announced that its nearly 15 million users can buy, sell, and hold SoFiUSD within the SoFi App. SoFiUSD runs on Ethereum and Solana, is pegged 1:1 to the US dollar, and can be redeemed through SoFi Bank.
The total market capitalization of stablecoins has remained relatively stable, with USD stablecoins still dominating. According to DefiLlama data, the total market capitalization of stablecoins is approximately $322.57 billion, with a 7-day change of approximately -0.02%. USDT's market share is approximately 58.67%; USDT's size is approximately $189.2 billion, while USDC's is approximately $76.6 billion.
The European Central Bank (ECB) opposes easing rules on euro stablecoins, highlighting a divergence in stablecoin strategies between the US and Europe. The ECB warned EU finance ministers that relaxing rules on euro stablecoin issuance could weaken banks' lending capacity and increase the difficulty of central bank interest rate management. ECB President Lagarde and other central bankers worry that stablecoins will make bank deposits more volatile and exacerbate the risk of disintermediation in the banking system.
Tokenized stocks and RWA continue to advance, but regulatory hurdles remain. Reuters, citing Bloomberg, previously reported that the SEC was preparing an "innovation exemption" to allow trading of assets such as tokenized stocks, potentially opening a new regulatory path for traditional stocks to be on-chain. However, subsequent reports this week indicate that the plan has encountered opposition from exchanges and market participants, and the SEC has postponed the proposal. Points of contention include whether tokenized stocks should enjoy dividend rights, voting rights, company endorsement, and whether third parties should be allowed to issue related tokens without the listed company's consent.
The Clarity Act remains the mainstay of US crypto regulation. The US Senate Banking Committee has previously advanced the Clarity Act, which aims to clarify the regulatory boundaries of the SEC and CFTC for different digital assets and address issues such as exchanges, brokers, stablecoin rewards, and DeFi compliance. The most critical point of contention remains stablecoin rewards: the bill tends to prohibit idle stablecoin balance rewards similar to bank deposit interest rates, but allows some rewards based on trading activity.
Long-term insights: used to observe our long-term situation; bull market/bear market/structural change/neutral state.
Mid-term exploration: Used to analyze what stage we are currently in, how long this stage will last, and what situations we will face.
Short-term observation: used to analyze short-term market conditions; and the probability of certain directions emerging and certain events occurring under certain conditions.
Long-term insight
Non-flowing long-term giant whale
Total selling pressure in on-chain spot market
BTC spot ETF net inflow
Long-term holders of more than six months
Exchange whale transfers
Long-term holders (over one year) vs. short-term holders
Cost threshold for long-term investors
BTC On-Chain and Macroeconomic Resonance Analysis: The supply structure is improving, but funding remains weak. The core state of BTC is clear: the on-chain supply structure is improving, but funding remains sluggish. This is not simply an on-chain issue. Macroeconomic factors such as high interest rates, dollar pressure, ETF outflows, and large inflows from exchanges are collectively suppressing prices; on the other hand, the rising proportion of long-term holders, the retreat of short-term speculators, and the reduction in floating tokens are creating conditions for a medium-term bottom. The most realistic picture of the market right now is: a bottom structure is forming, but a reversal has not yet been confirmed.
Non-liquid long-term whales: The strongest funds have not yet made a firm move.
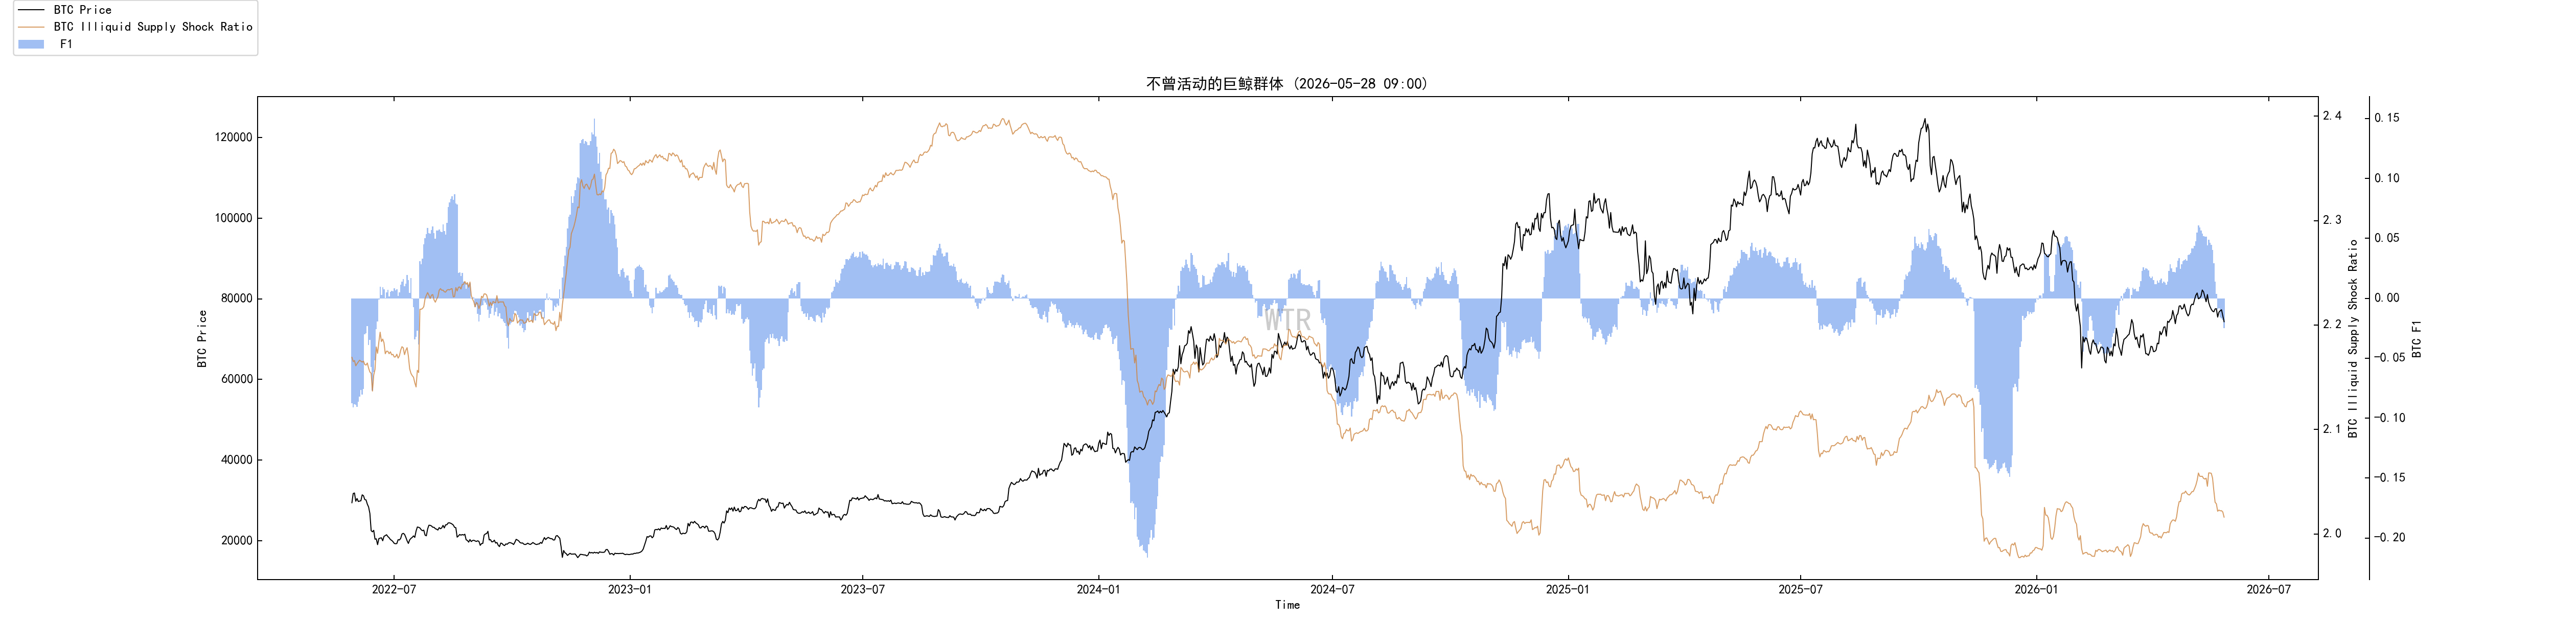 The illiquid long-term whales did indeed show some growth previously, indicating that some long-term funds were willing to accumulate shares. However, this growth weakened significantly above $81,000, and only began to show signs of growth again after the price fell back below $80,000.
More importantly, as prices continued to weaken, the proportion of this group began to decline rapidly. Around $72,900, the number of long-term illiquid whales continued to decrease.
This indicates that large funds are not unconditionally supporting the market. They will buy cheap shares, but they won't blindly take over in a weak market. This group's behavior is more like price-sensitive accumulation than strong defensive accumulation.
Therefore, the signal provided by this data is not strong. It proves that someone is watching at low prices, but it does not prove that someone is willing to continue buying at low prices.
Total selling pressure in on-chain spot trading: The real problem isn't that selling pressure is too strong, but rather that buying pressure is too weak.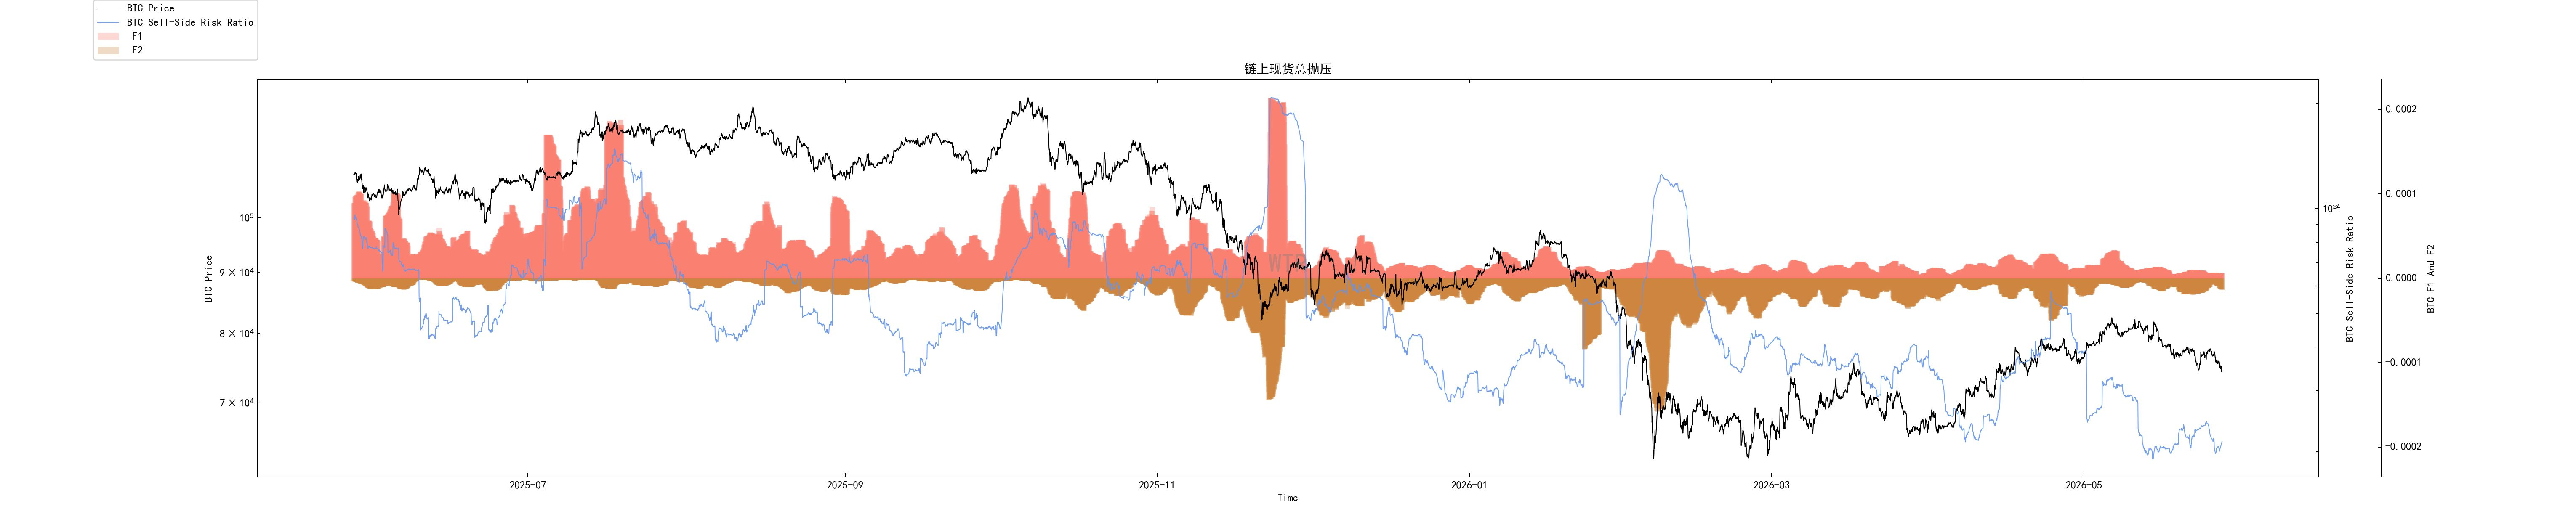 The total selling pressure in the spot market on the blockchain decreased significantly after the second surge above $82,000, but the price subsequently weakened further. This phenomenon is significant.
If selling pressure decreases but prices still don't move, the problem isn't with selling pressure, but with demand. The market isn't lacking "fewer sellers," but rather "someone willing to continuously buy."
Now that prices have fallen to around $78,000, overall selling pressure in the spot market has begun to rise again, especially during the rebound. This indicates that some funds are using the rebound as an exit window.
This will make any rebound very sluggish. The selling pressure at lower levels isn't extreme, but as long as prices move upwards, selling pressure will reappear. The market isn't lacking in room for a rebound, but each rebound needs to digest the selling pressure from those above.
BTC ETF Fund Flows: Institutional investors are still withdrawing, and short-term buying has not returned.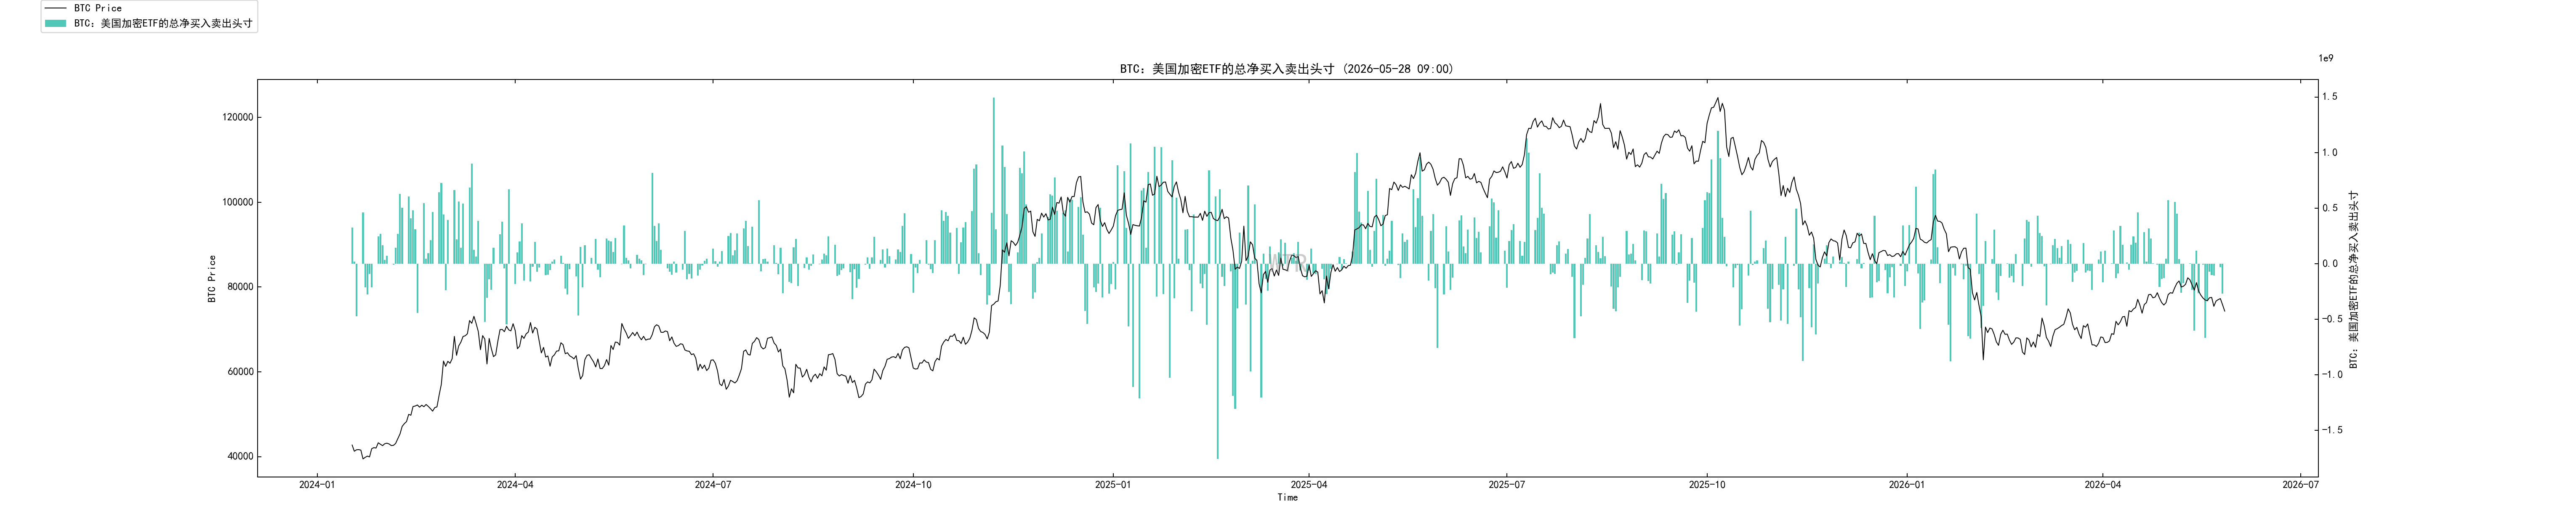 The most direct signal from the BTC ETF right now is that it is falling while simultaneously experiencing outflows.
Worse still, there was a significant outflow during the previous rebound.
This indicates that traditional financial funds did not see the decline as an opportunity to stabilize and increase their positions, but rather as a way to channel liquidity during rebounds. ETFs, which were originally the core channel for institutional pricing in this round of BTC, have now temporarily shifted from support to resistance.
This has a significant impact on short-term price movements. No matter how much long-term holdings accumulate on the blockchain, if ETF funds continue to flow out, it will be difficult for the price to recover smoothly.
What BTC lacks right now isn't a compelling narrative, but rather marginal buying interest. Without ETFs bringing back capital, the market is merely experiencing on-chain structural improvements; the price trend won't easily strengthen.
Long-term participants' holdings structure: Conditions for a medium-term bottom are accumulating.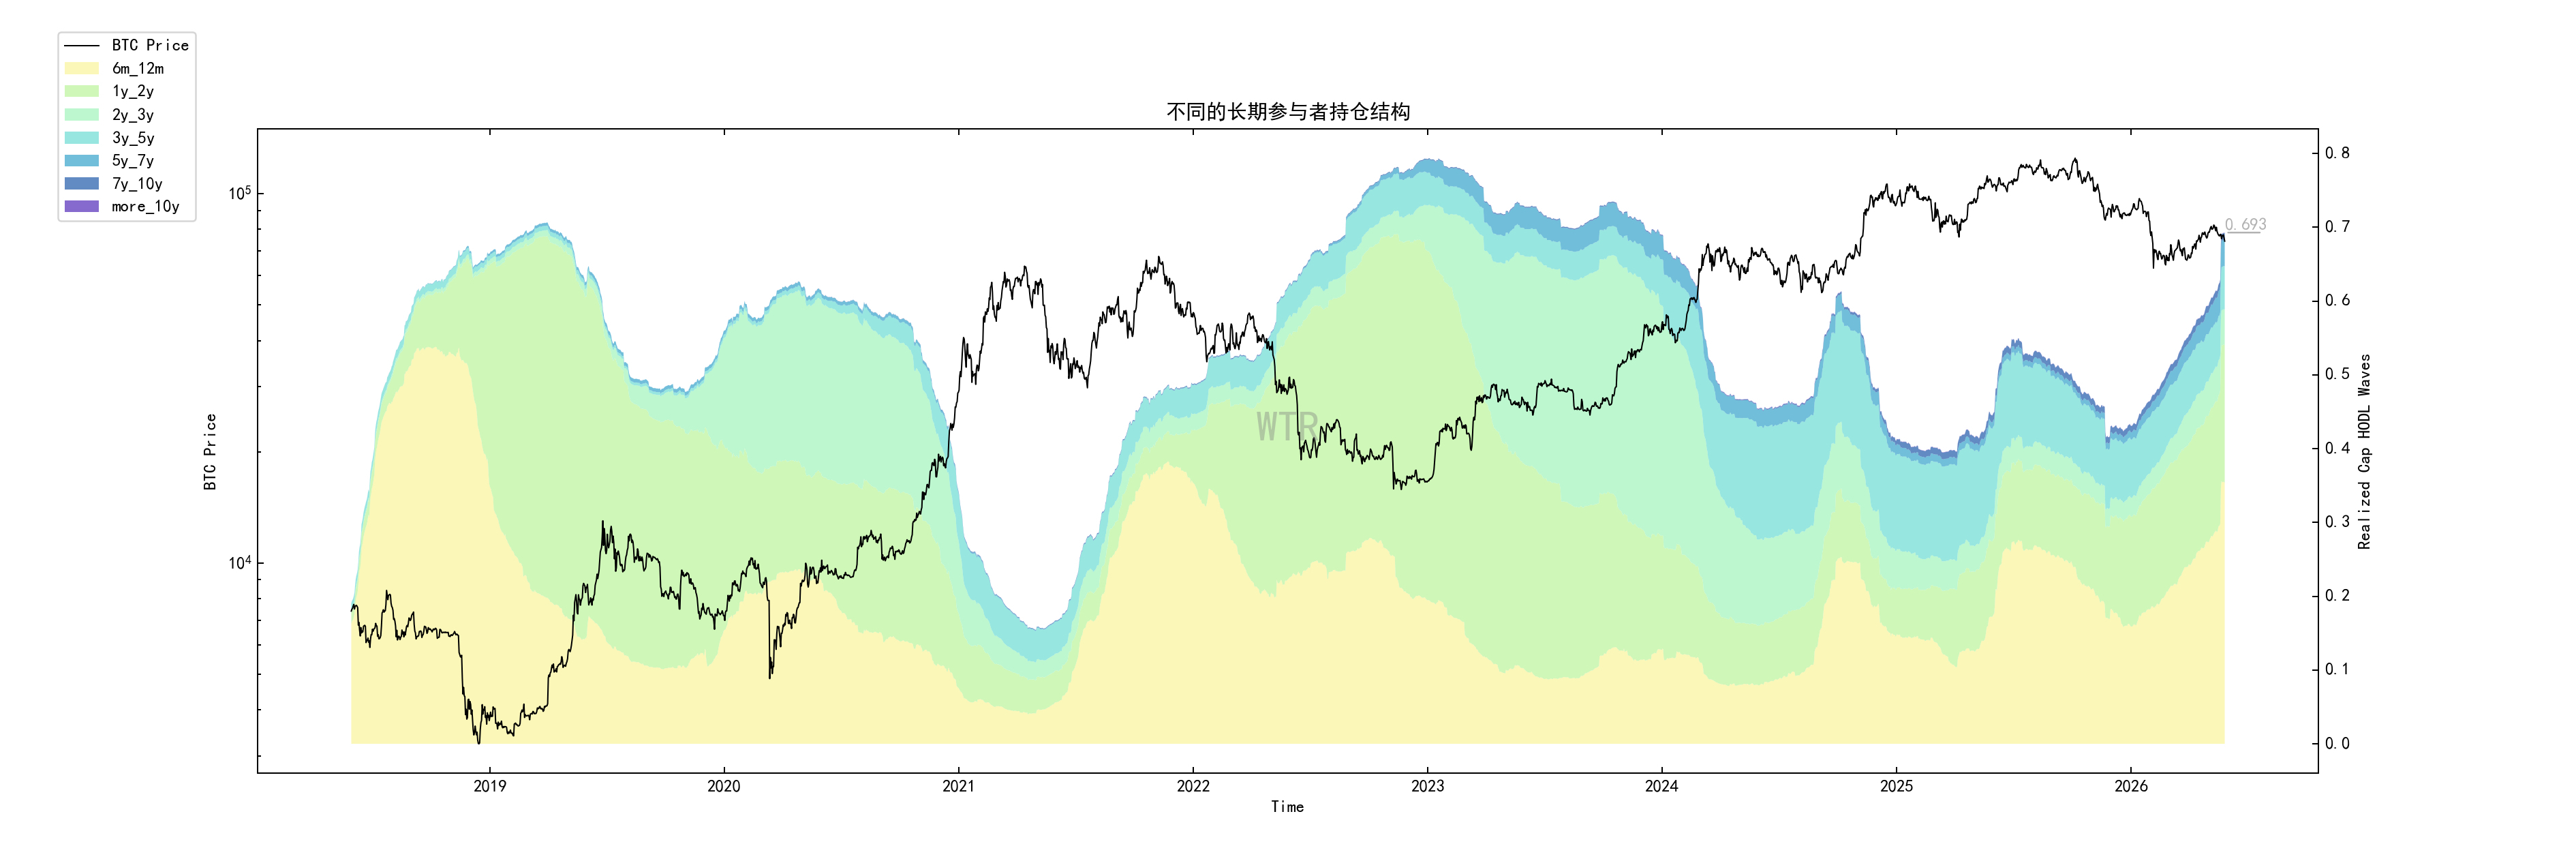 The proportion of participants with a participation period of six months or more has rebounded from approximately 0.527% to approximately 0.693%, with a particularly rapid increase in the past week. This is the most valuable medium-term signal among this set of on-chain data.
Historically, a rapid increase in the proportion of long-term holdings, approaching a high level, often corresponds to the vicinity of a market bottom. The logic is simple: short-term speculative holdings are cleared out, and the shares gradually settle in the hands of those who don't trade easily, reducing the floating supply in the market. Subsequently, as long as there are new buy orders, price elasticity will significantly increase.
However, this cannot be mechanically extrapolated. The increase in the proportion of long-term holdings is partly due to genuine accumulation of shares, and partly due to the natural aging of shares and the exit of short-term funds. It indicates that the market is becoming lighter, but it does not mean that it will rise immediately.
This indicator is more like the "skeleton" of the bottom structure than the "accelerator" for the start of a trend.
Large net transfers on exchanges: Whales are still pushing their holdings towards liquidation positions.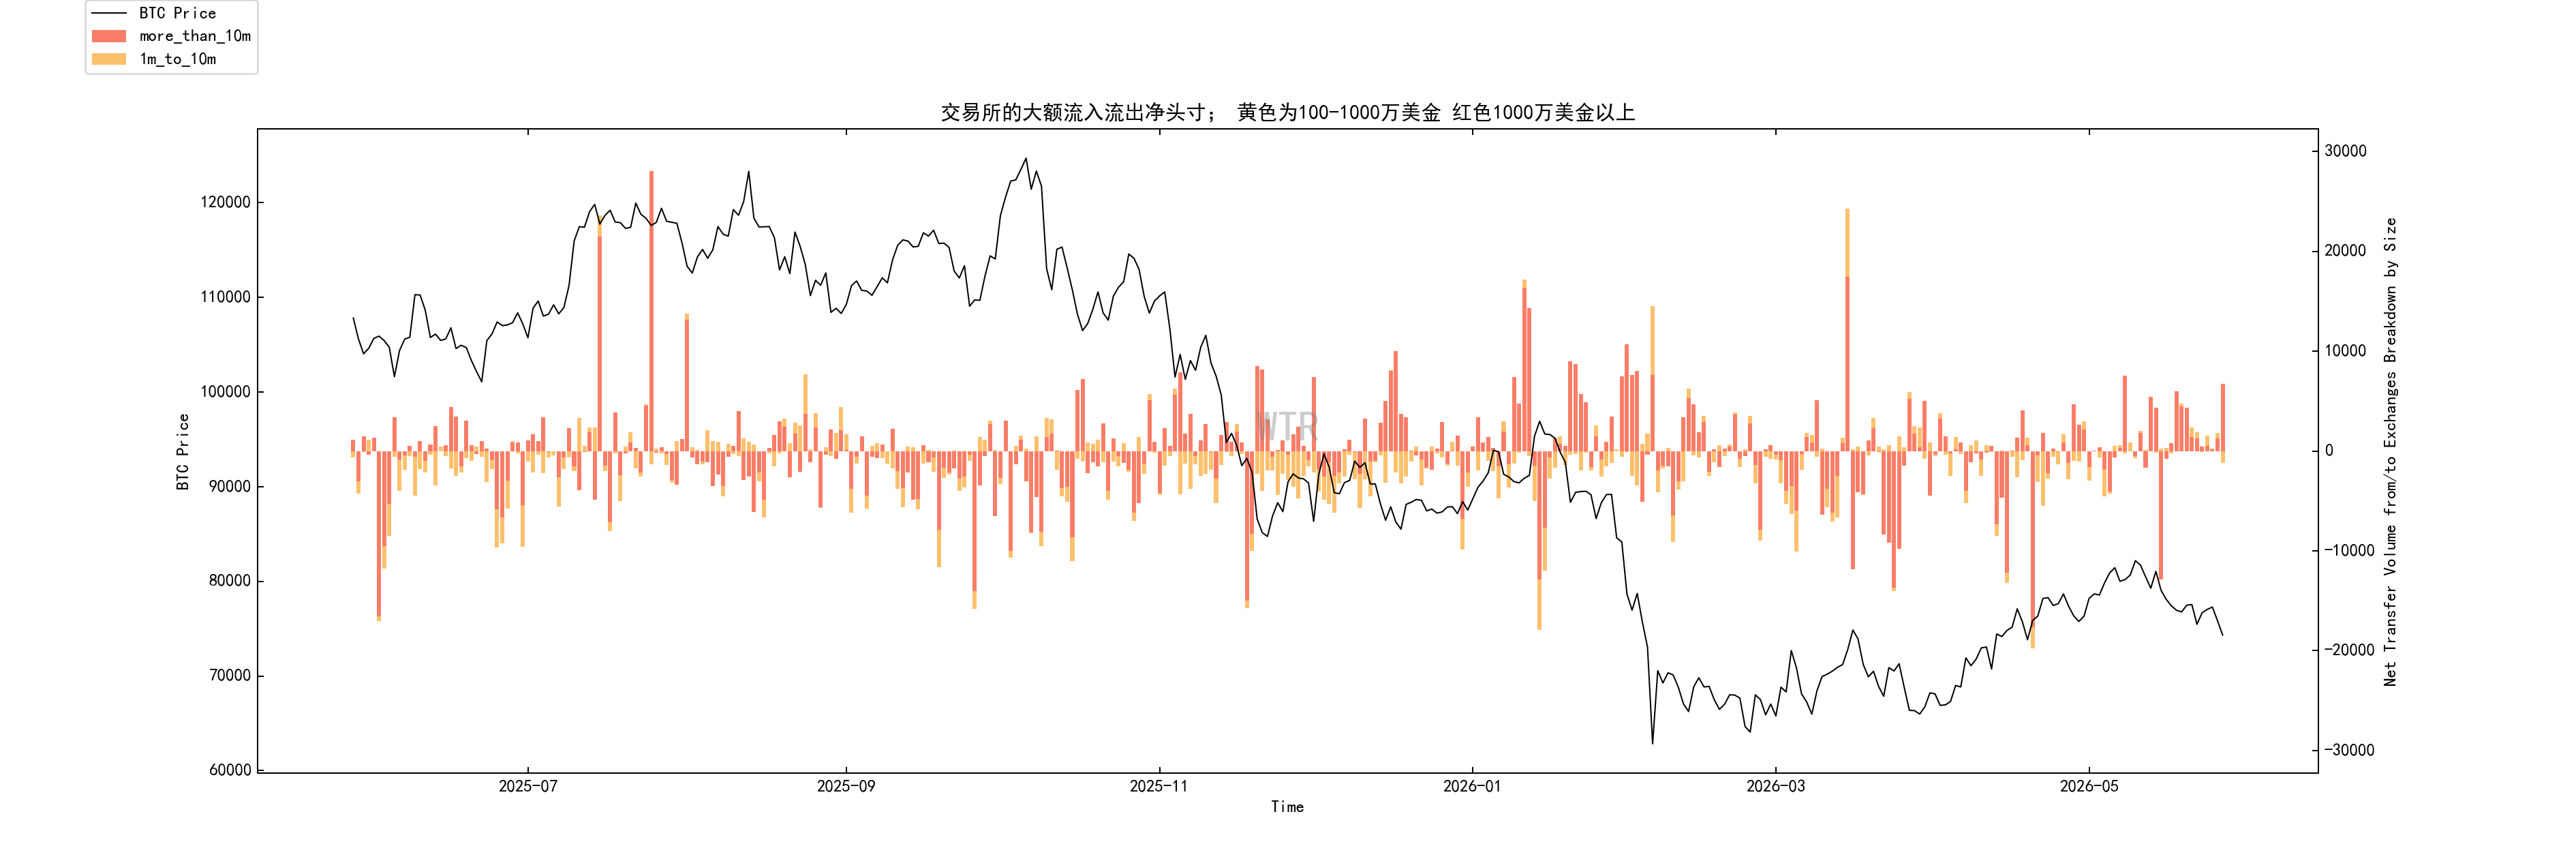 The overall net inflow of large transfers into exchanges indicates that large funds are still transferring coins into exchanges.
This doesn't necessarily mean selling immediately, but it represents at least three actions: cashing out, hedging, or reducing risk exposure. None of these are strong buying signals.
What's more troublesome is that this data appeared simultaneously with ETF outflows. One represents the withdrawal of funds from traditional financial institutions, while the other represents large on-chain funds placing their holdings on exchanges. With both sides exhibiting caution, it becomes difficult for the market to form a strong rebound.
This is why rebounds are prone to failure. As soon as prices rise slightly, they encounter liquidity demands from large funds.
Long-term holders (over one year) and short-term speculators: Long-term holdings are stabilizing, while short-term funds are withdrawing.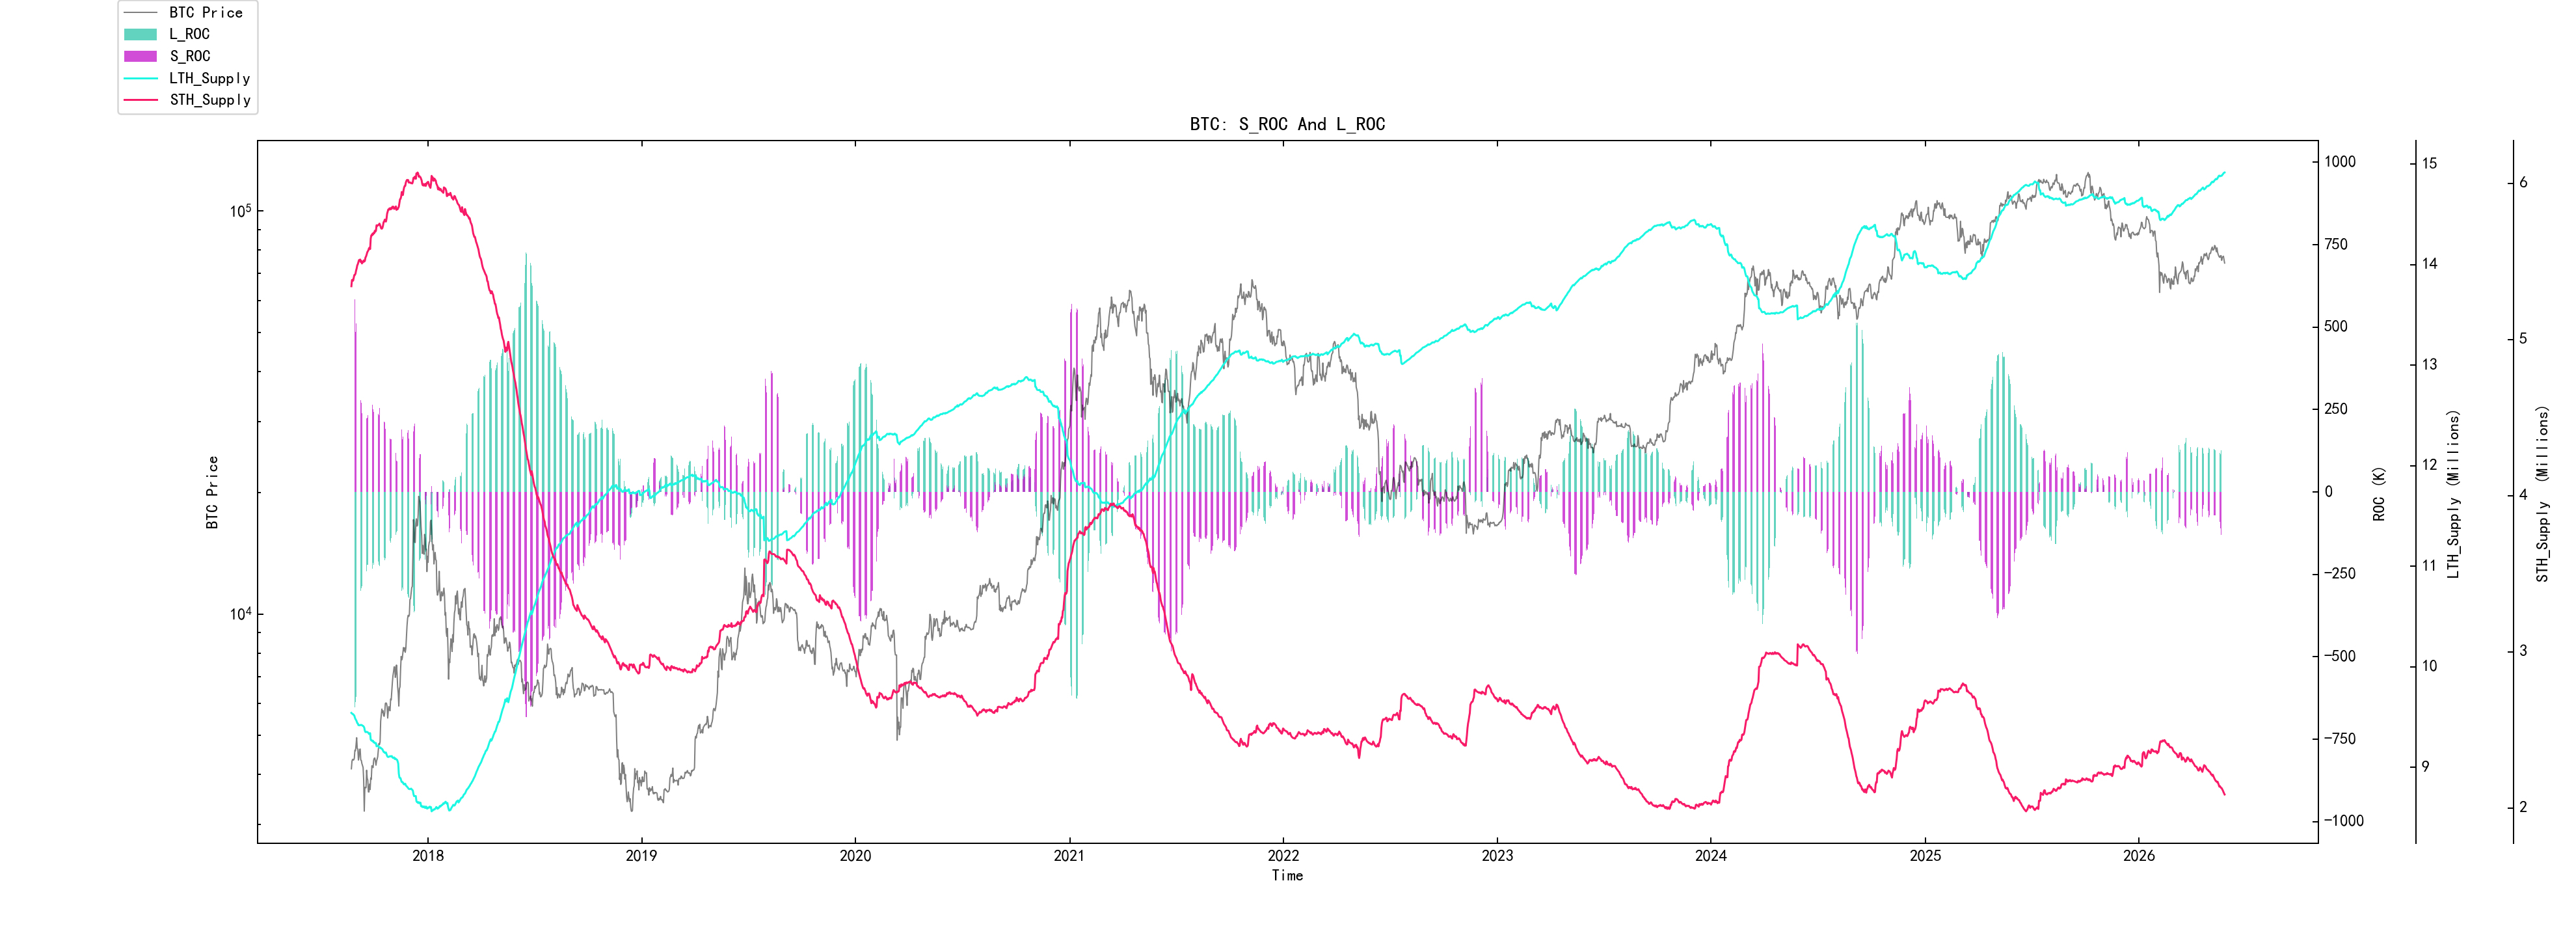 The number of long-term holders (holding shares for more than a year) continued to increase slightly, while the number of short-term speculators began to decline slightly.
Historically, several significant upward trends have been built on a foundation of continuously increasing long-term holders, reduced short-term holdings, and tighter circulating shares. This structure is now emerging.
However, the decline in short-term speculators also has another side: less active capital in the market and weaker short-term driving forces. Long-term holders are responsible for reducing supply, while short-term funds are responsible for driving prices. Now, the former is improving, while the latter is receding.
Therefore, this data indicates that the market is shifting from a period of volatility to one of consolidation. This is good for the medium term, but may not be immediately beneficial in the short term.
Short-term holders' cost line: $77,800 is the most direct dividing line at present.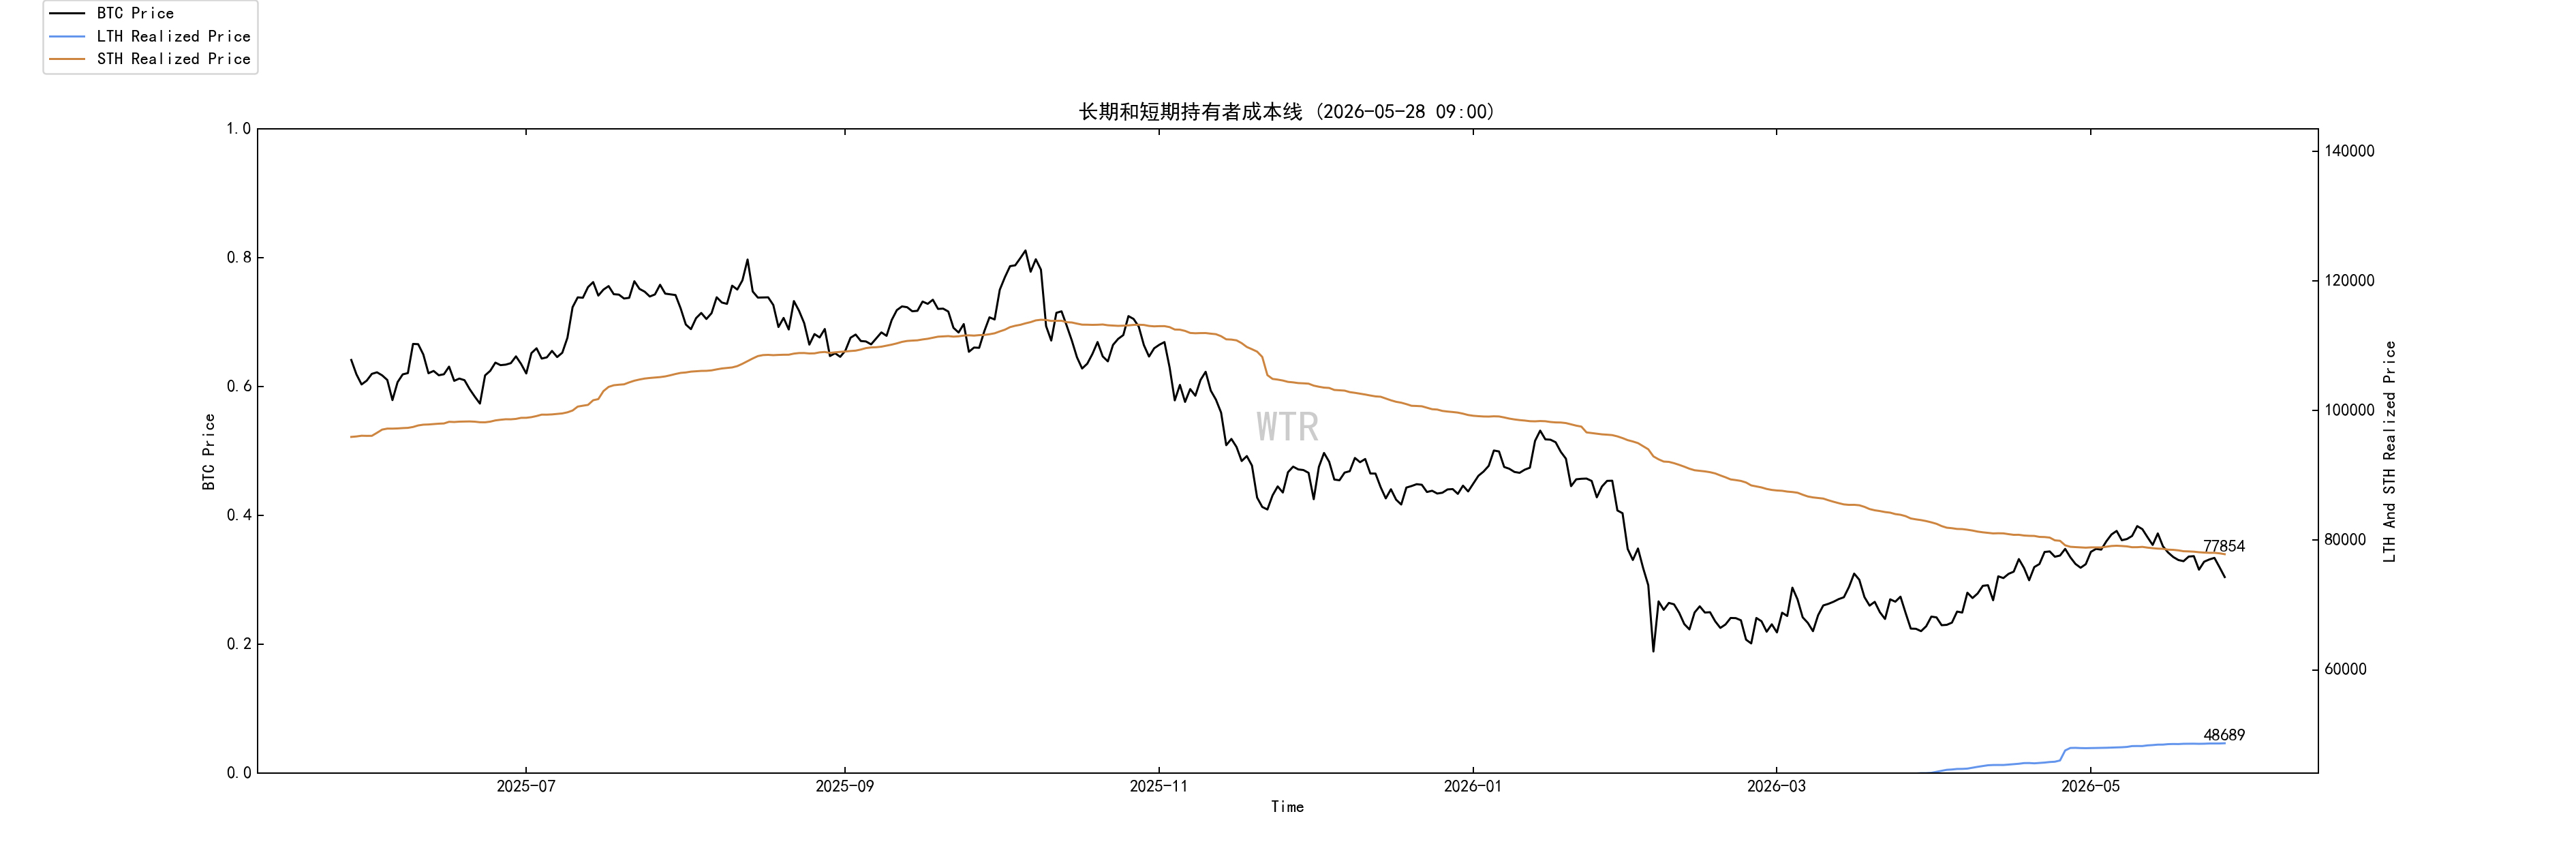
The cost line for short-term holders is around $77,800. This level is crucial. Below it, short-term participants are generally in a loss-making or stressed state, and rebounds to this level are likely to trigger selling pressure from those looking to break even, reduce positions, or manage risk. If the price can regain and stabilize above this level, the psychological pressure on short-term holders will decrease, allowing the market to shift from "selling on rallies" to "buying on pullbacks." Therefore, $77,800 is not an ordinary price level. It's a dividing line for short-term capital positions. If it fails to break above this level, the market remains in a weak rebound structure. Only by breaking above and stabilizing above this level can we discuss a correction to higher levels.
II. Overall Analysis: The blockchain is bottoming out, while macroeconomic factors and capital flows are still exerting downward pressure.
Looking at on-chain data and macroeconomic news together, the current market trend is very clear. On the macro front, the decline in oil prices has mitigated the most extreme inflation risks, but hasn't truly brought back the interest rate cut trade. US Treasury yields remain high, the US dollar still faces a risk of further strengthening, and the Federal Reserve and other major central banks have not entered an easing phase. Risk assets are now facing not liquidity expansion, but valuation constraints in a high-interest-rate environment. On the ETF front, BTC and ETH fund flows remain weak. Especially for BTC ETFs, outflows are occurring while prices are falling, indicating that traditional funds haven't formed a stable support. ETFs, which used to be an entry point for incremental funds, have now become a window for fund withdrawal in the short term. On the on-chain front, the long-term holding structure has improved significantly. The proportion of holders with more than six months or one year of holdings has increased, while short-term speculators have decreased, indicating that tokens are accumulating. The market's floating supply has decreased, which is crucial for the medium term. However, large net inflows into exchanges and the decline in illiquid whales suggest that the strongest funds haven't yet unanimously turned bullish. Large funds are observing and partially absorbing at lower levels, but haven't formed a firm defensive stance. Therefore, the current essence of BTC is: the supply side is improving, but the demand side hasn't recovered. This statement explains all the contradictions. Why is the price still weak despite improving long-term accumulation? Because there's insufficient buying pressure. Why is the market still weak despite decreasing selling pressure? Because ETFs and macro funds haven't flowed back in. Why can't a reversal be confirmed despite signs of a bottom at lower levels? Because whales and institutions are still cautiously retreating. Why does a short-term rebound seem likely to fail? Because there's short-term cost pressure around $77,800, and there's still selling pressure above. This is the current state of the market: conditions for a medium-term bottom are increasing, but the short-term trend hasn't switched yet.
Short-term outlook: First watch $77,800, then ETF flows. The most crucial short-term level is around $77,800. If BTC cannot regain this area, short-term holders will remain under pressure, and any rebound will likely be met with further selling. In that case, the market will retest lower support levels, making the $72,900 area a key observation zone. If the price regains $77,800, and ETF outflows slow, while large inflows into exchanges decrease, the quality of the rebound will improve significantly. Only then will the market have a chance to retest the $80,000-$82,000 area. However, we cannot focus solely on price. The real key is the underlying fund flows. A healthy short-term correction should simultaneously meet several conditions: ETF outflows cease, large whale inflows into exchanges decrease, short-term cost lines are effectively recovered, and US Treasury yields and the US dollar no longer continue to suppress risk assets. If there is only a price rebound while funds continue to flow out, it is merely a rebound, not a correction.
Medium- to Long-Term Outlook: A Bottom Structure is Forming, but External Funds Need to Return for a Launch. From a medium- to long-term perspective, the on-chain structure has begun to show bottoming characteristics. The proportion of long-term participants is rising rapidly, the number of holders holding for more than a year continues to increase, and short-term speculators are declining. These are all signals that the market is moving from chaos to consolidation. As long as this process continues, the number of floating Bitcoin tokens will decrease. In the future, once macroeconomic interest rate pressures ease and ETF funds flow back in, price elasticity will be amplified. This is why the market should not be overly pessimistic at present. Tokens are shifting to patient funds. This structure often does not immediately reflect in the price, but it will change the elasticity of the next stage of the market. The problem is that medium- to long-term structural improvements cannot replace short-term fund inflows. Bitcoin is no longer a purely on-chain asset; it is priced by ETFs, the US dollar, US Treasury yields, and global risk appetite. Without the cooperation of external funds, the on-chain bottom can only be built slowly and cannot be launched quickly. Therefore, the real key in the medium to long term is not the internal crypto ecosystem, nor various project narratives, but whether the capital market is willing to give Bitcoin a risk premium again. If US Treasury yields subsequently decline, the US dollar weakens, ETFs see renewed net inflows, and long-term holdings continue to accumulate, then the probability of this decline forming a medium-term bottom will significantly increase. Conversely, if the high-interest-rate environment persists, ETFs continue to see outflows, and exchange-traded whales continue to flow in, then even if the proportion of long-term holdings continues to rise, the market may still need a longer period or lower prices to complete its cleansing process.
Mid-term exploration
USDC Purchasing Power Overall Score
Incremental model
BTC Exchange Trend Net Positions
Realized net profit/loss position
Profit/loss ratio achieved within the year
(See the chart below for USDC purchasing power score)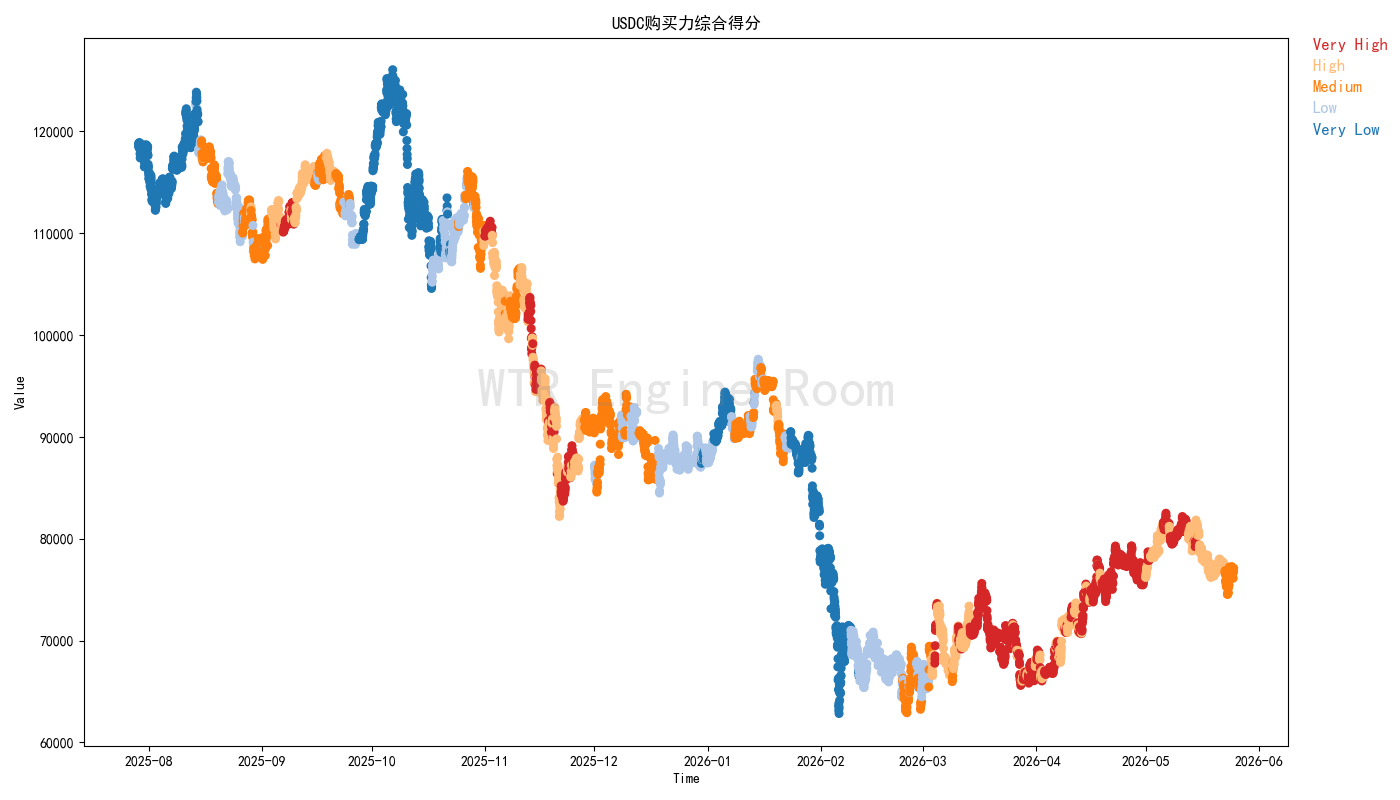 The recent contraction in the USDC purchasing power score reflects an overall pullback in funds from major US-based trading platforms.
Based on current data, these funds have not shown an aggressive willingness to allocate assets and are more likely to remain on the sidelines rather than act rashly in the short term.
This cautious stance will further weaken buying power in the market.
(See the diagram below for the incremental model)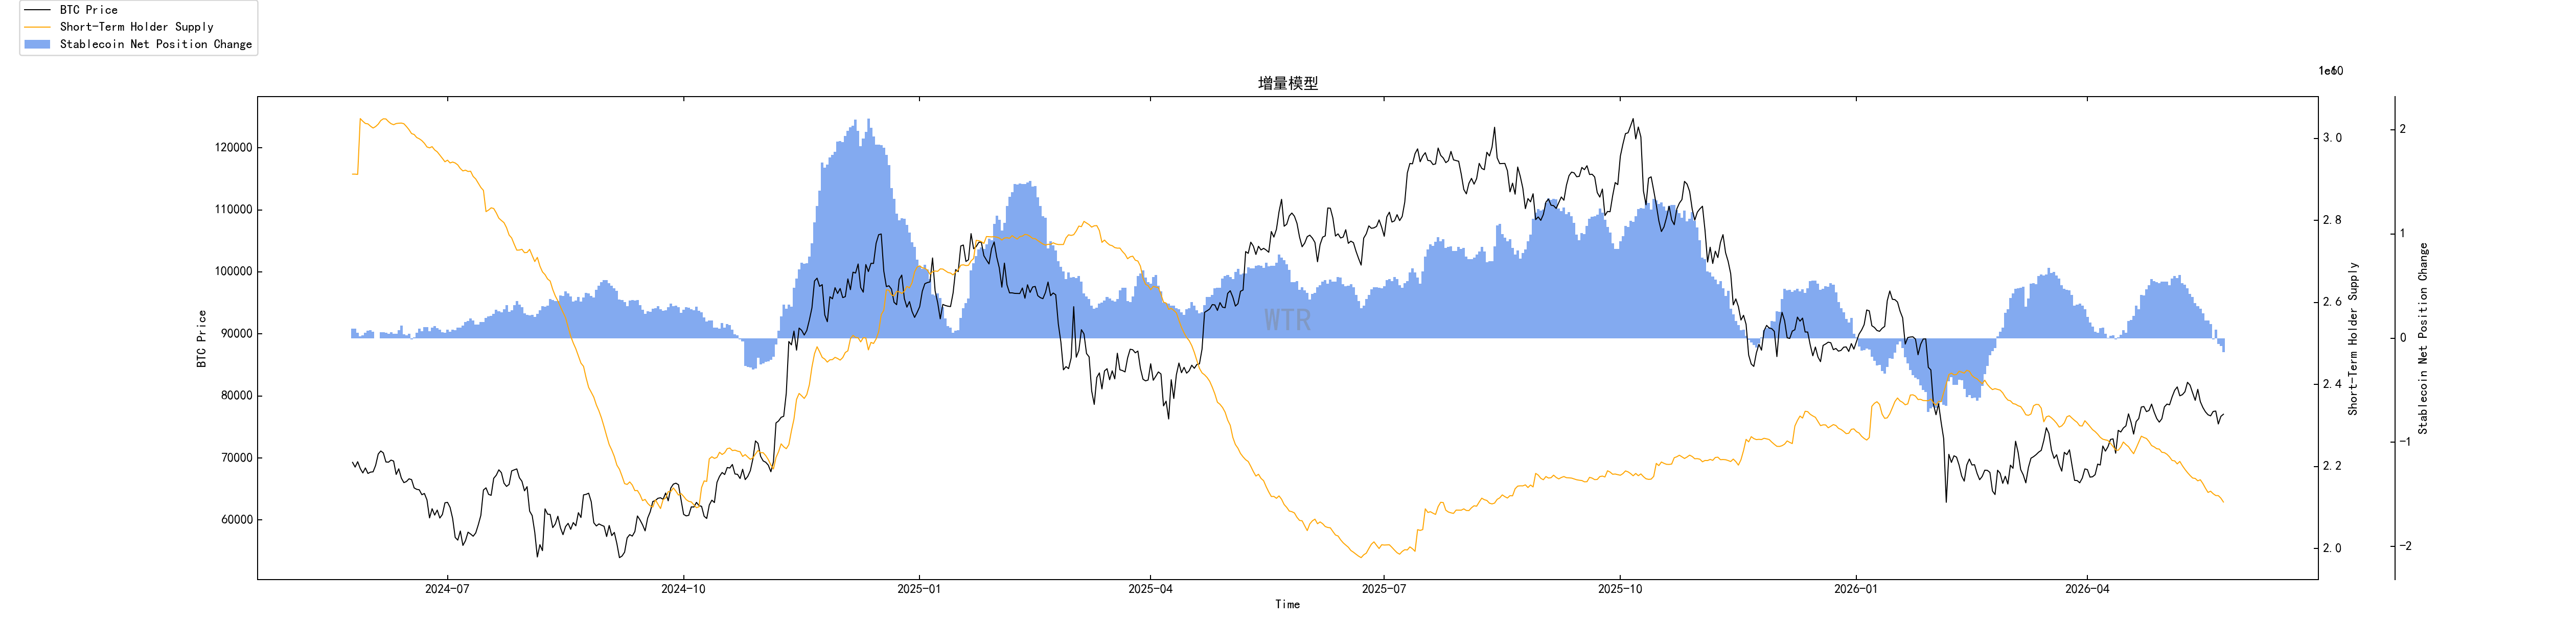 Recently, incremental funds have shown a collective withdrawal trend, and the buying power in the market is gradually shrinking.
The supply of stablecoins is decreasing in tandem with the supply of short-term liquidity.
This indicates that the current situation is not simply a slowdown in sentiment, but rather a lingering atmosphere of withdrawal within the venue.
(See chart below for BTC exchange trend net positions)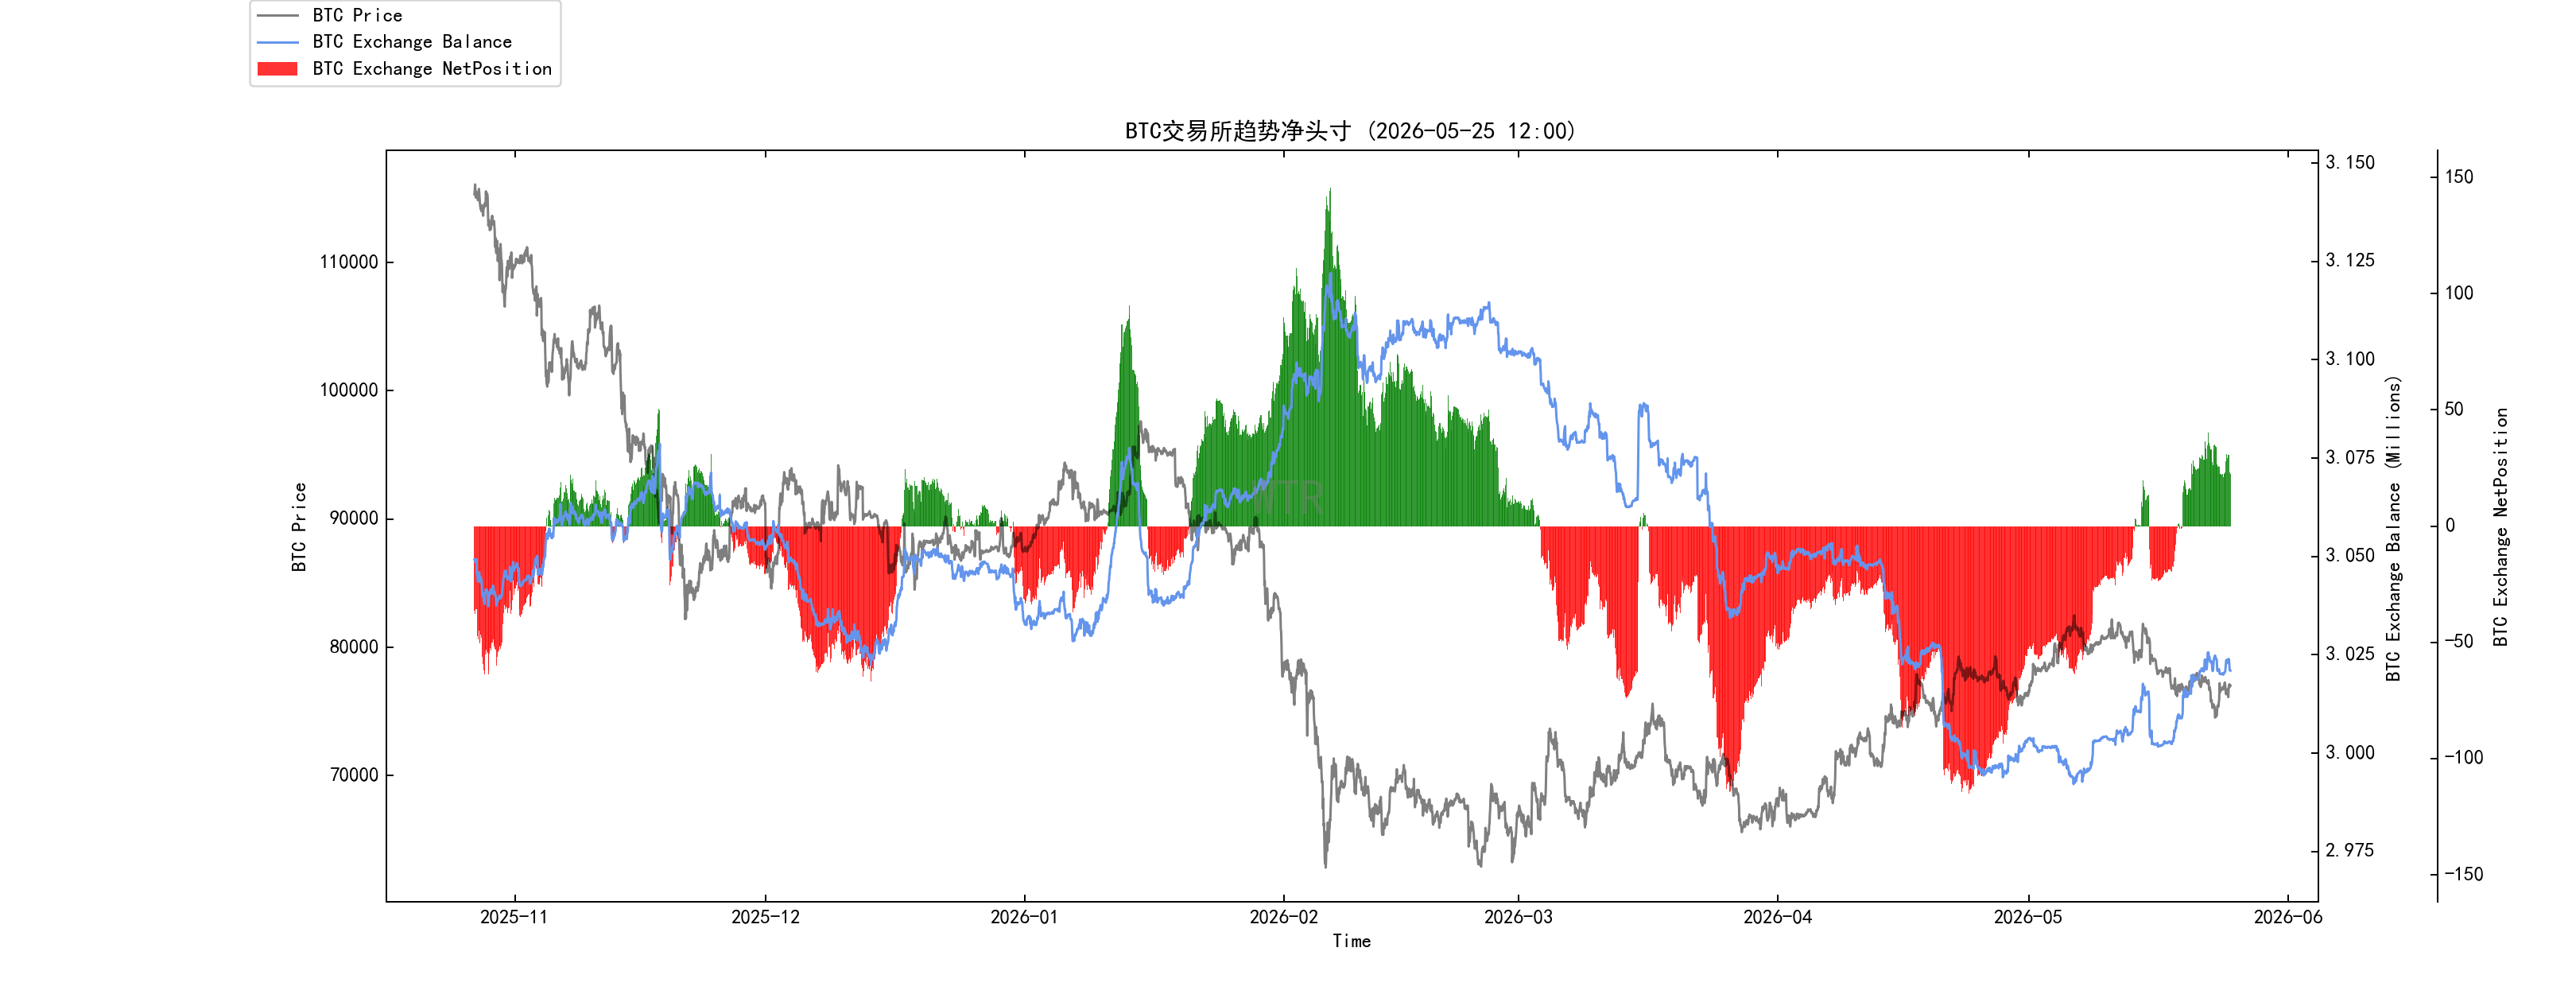 Recently, the amount of BTC deposited into exchanges has continued to increase. The current situation in the market is not a simple withdrawal of funds, but rather a structural evolution of "repair - slowdown - pressure".
The current pricing is under pressure from multiple sources, and this pressure is formed by the collective action of various participants in the market (whales, ETFs, short-term traders, etc.).
The market is shifting from a phase of proactive recovery to one of passive pressure.
(The chart below shows the realized net profit/loss position)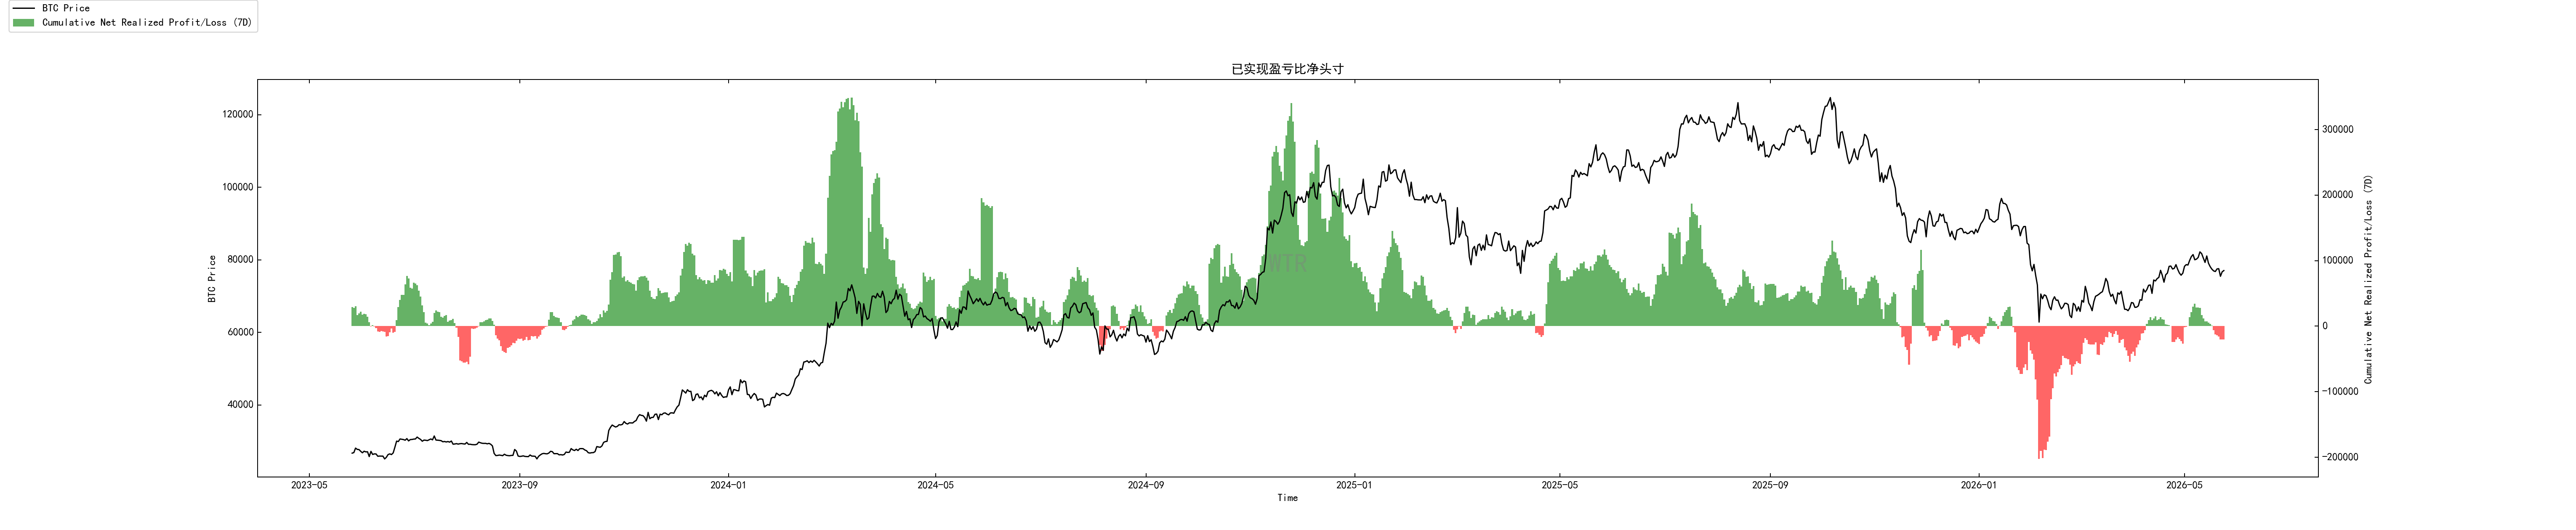 Recent net profit and loss positions show that the proportion of losing positions has increased again, indicating that the pressure to cut losses and leave the market is rising.
This structural change suggests that we should be cautious in assessing the current extent of the market correction and not prematurely conclude that the bottom has been reached.
If the loss ratio continues to rise, the downward pressure may intensify further.
(See chart below for the profit/loss ratio achieved this year)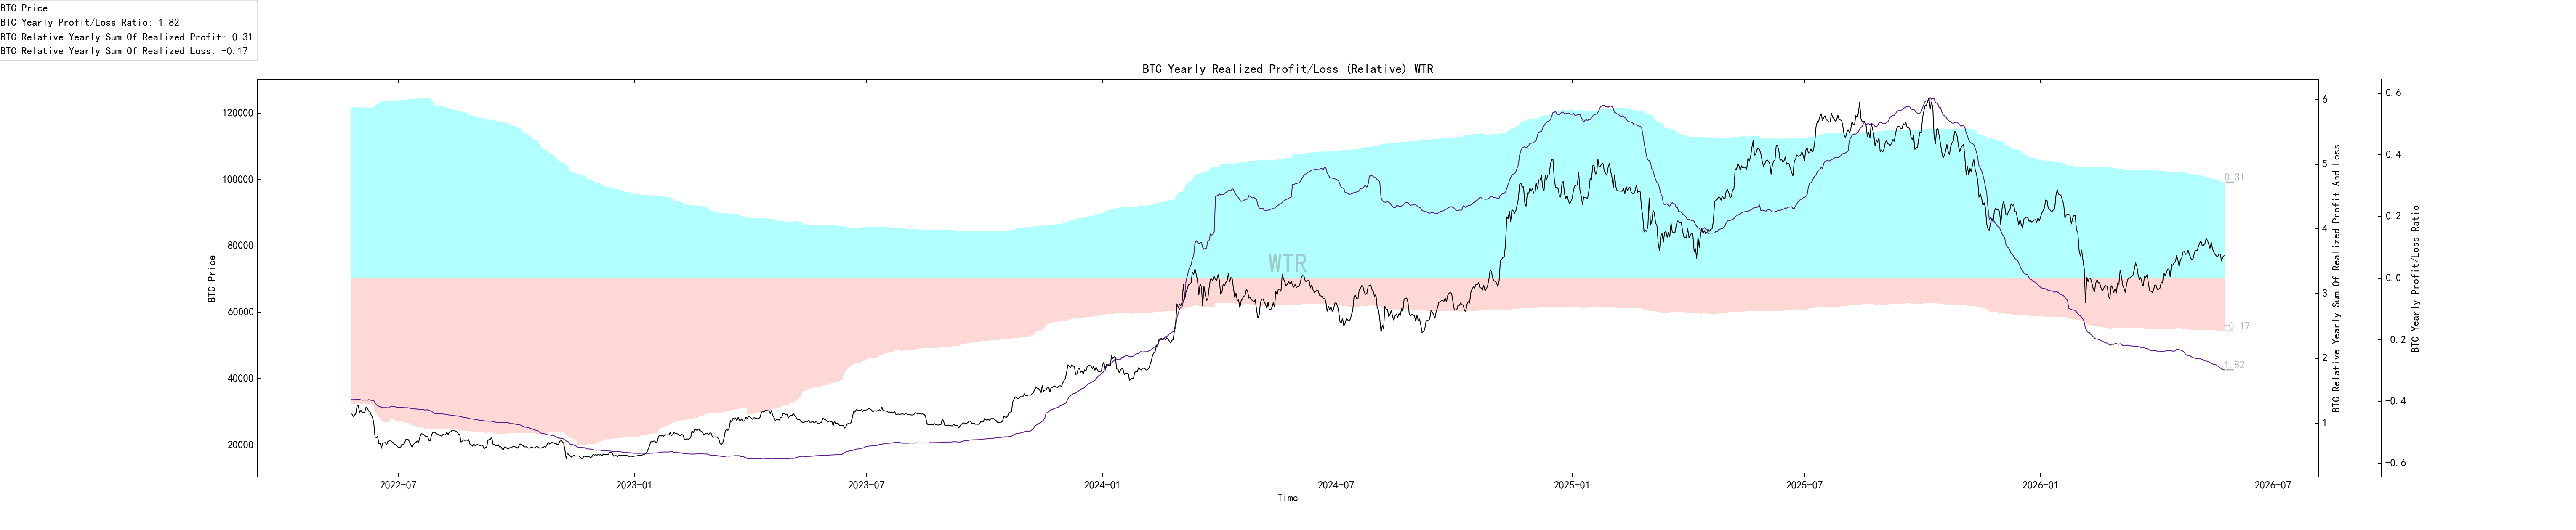
Looking at the profit/loss ratio realized this year, the market has re-entered a historically significant phase of concentrated loss-making. The market is undergoing a deep shakeout and sentiment clearing process. In other words, at this stage, the focus should be on observing the market from the perspective of anticipated structural corrections, rather than hastily concluding a reversal. It is advisable to patiently wait for the pace of loss-making to slow down.
Short-term observation
Derivatives risk coefficient
Option Intention to Transaction Ratio
Derivatives trading volume
Implied volatility of options
Profit and loss transfer
New addresses and active addresses
Rock Sugar Orange Exchange Net Position
Net Positions on Ethernet Exchange
High-weight selling pressure
Global Purchasing Power Status
Net Positions on Stablecoin Exchanges
Derivatives Rating: The risk coefficient is in the green zone, indicating low risk. (See chart below for derivatives risk coefficients)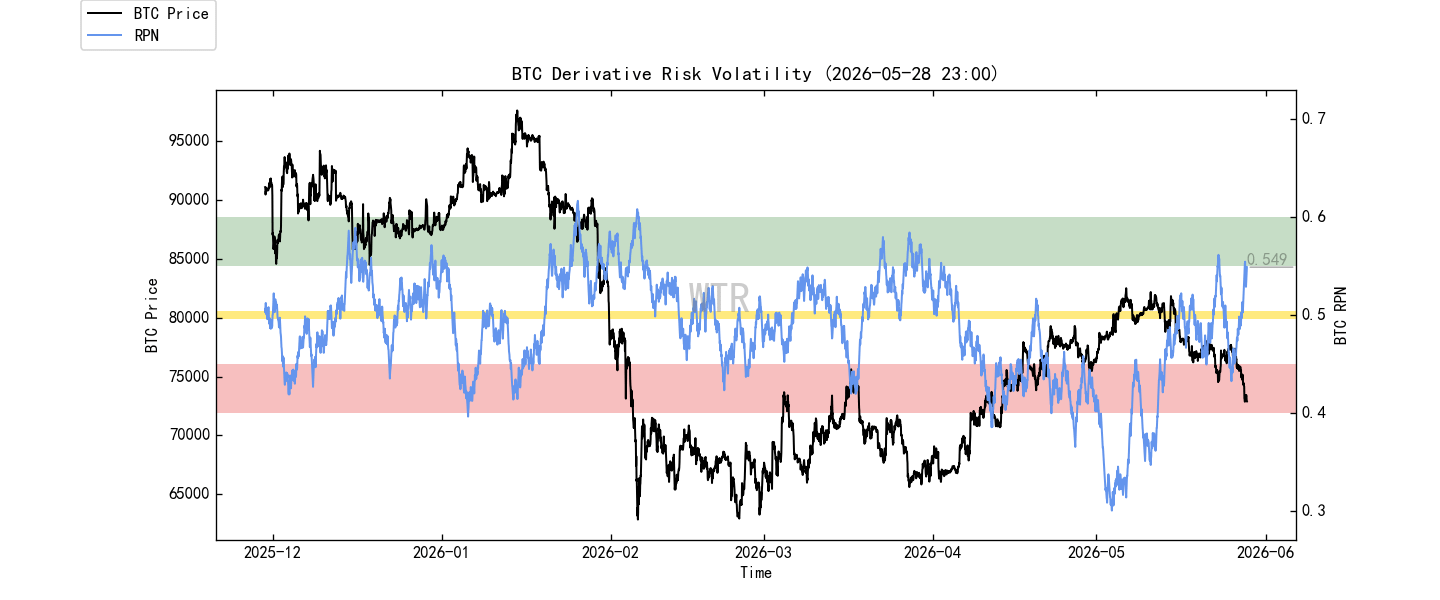 The price of BTC has fallen slightly from last week's level, but the current price has fallen below an important market sentiment line and support line - the short-term holder cost line around 78K.
For derivatives, things are temporarily calming down, with no particular expectations for this week.
(See chart below for option intention-to-execution ratio)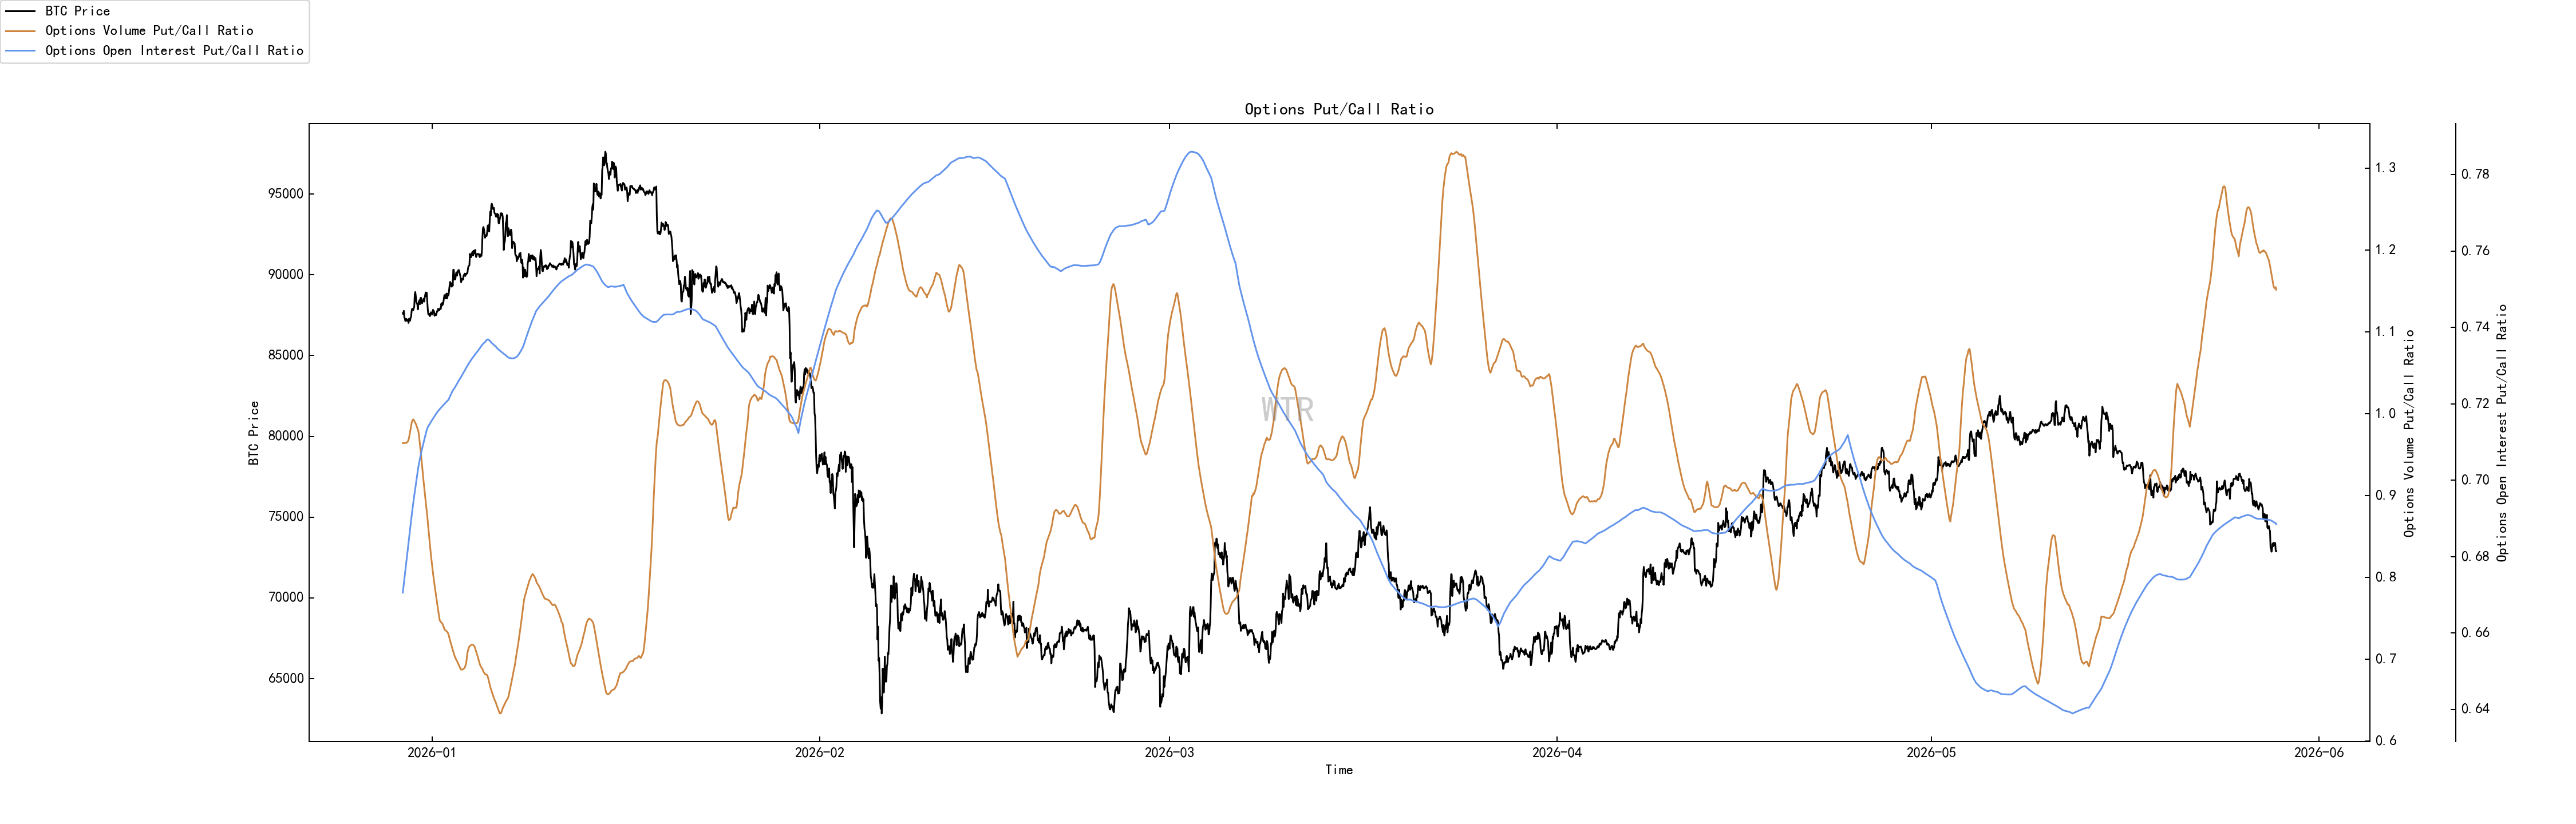 Options trading volume surged, with the options put/call ratio near 1, indicating neutral sentiment in the options market.
(See chart below for derivatives trading volume)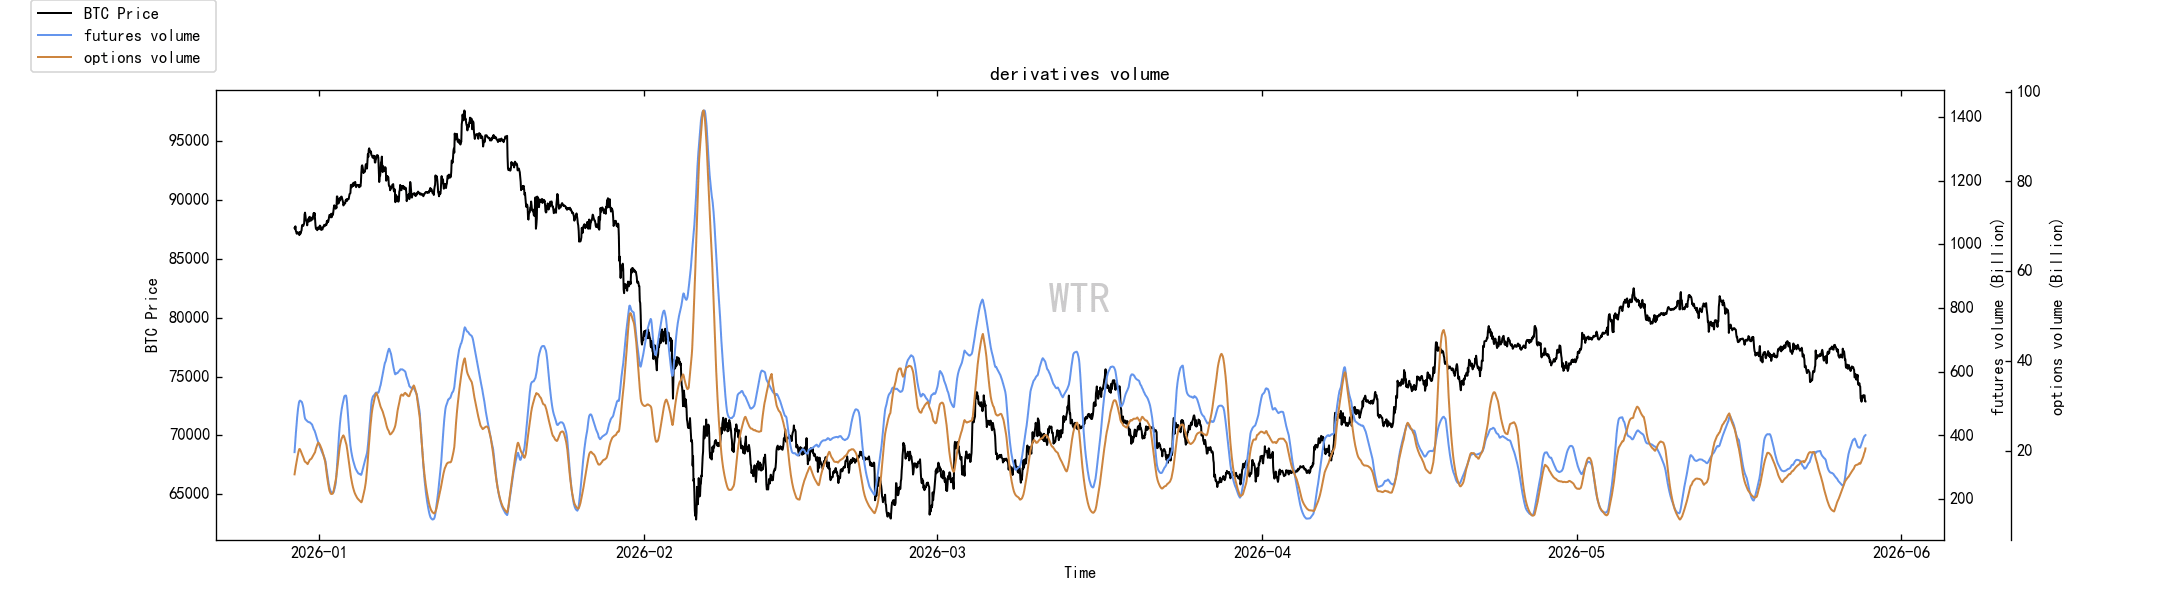 Derivatives trading volume is currently at a low to medium level.
(See chart below for implied volatility of options)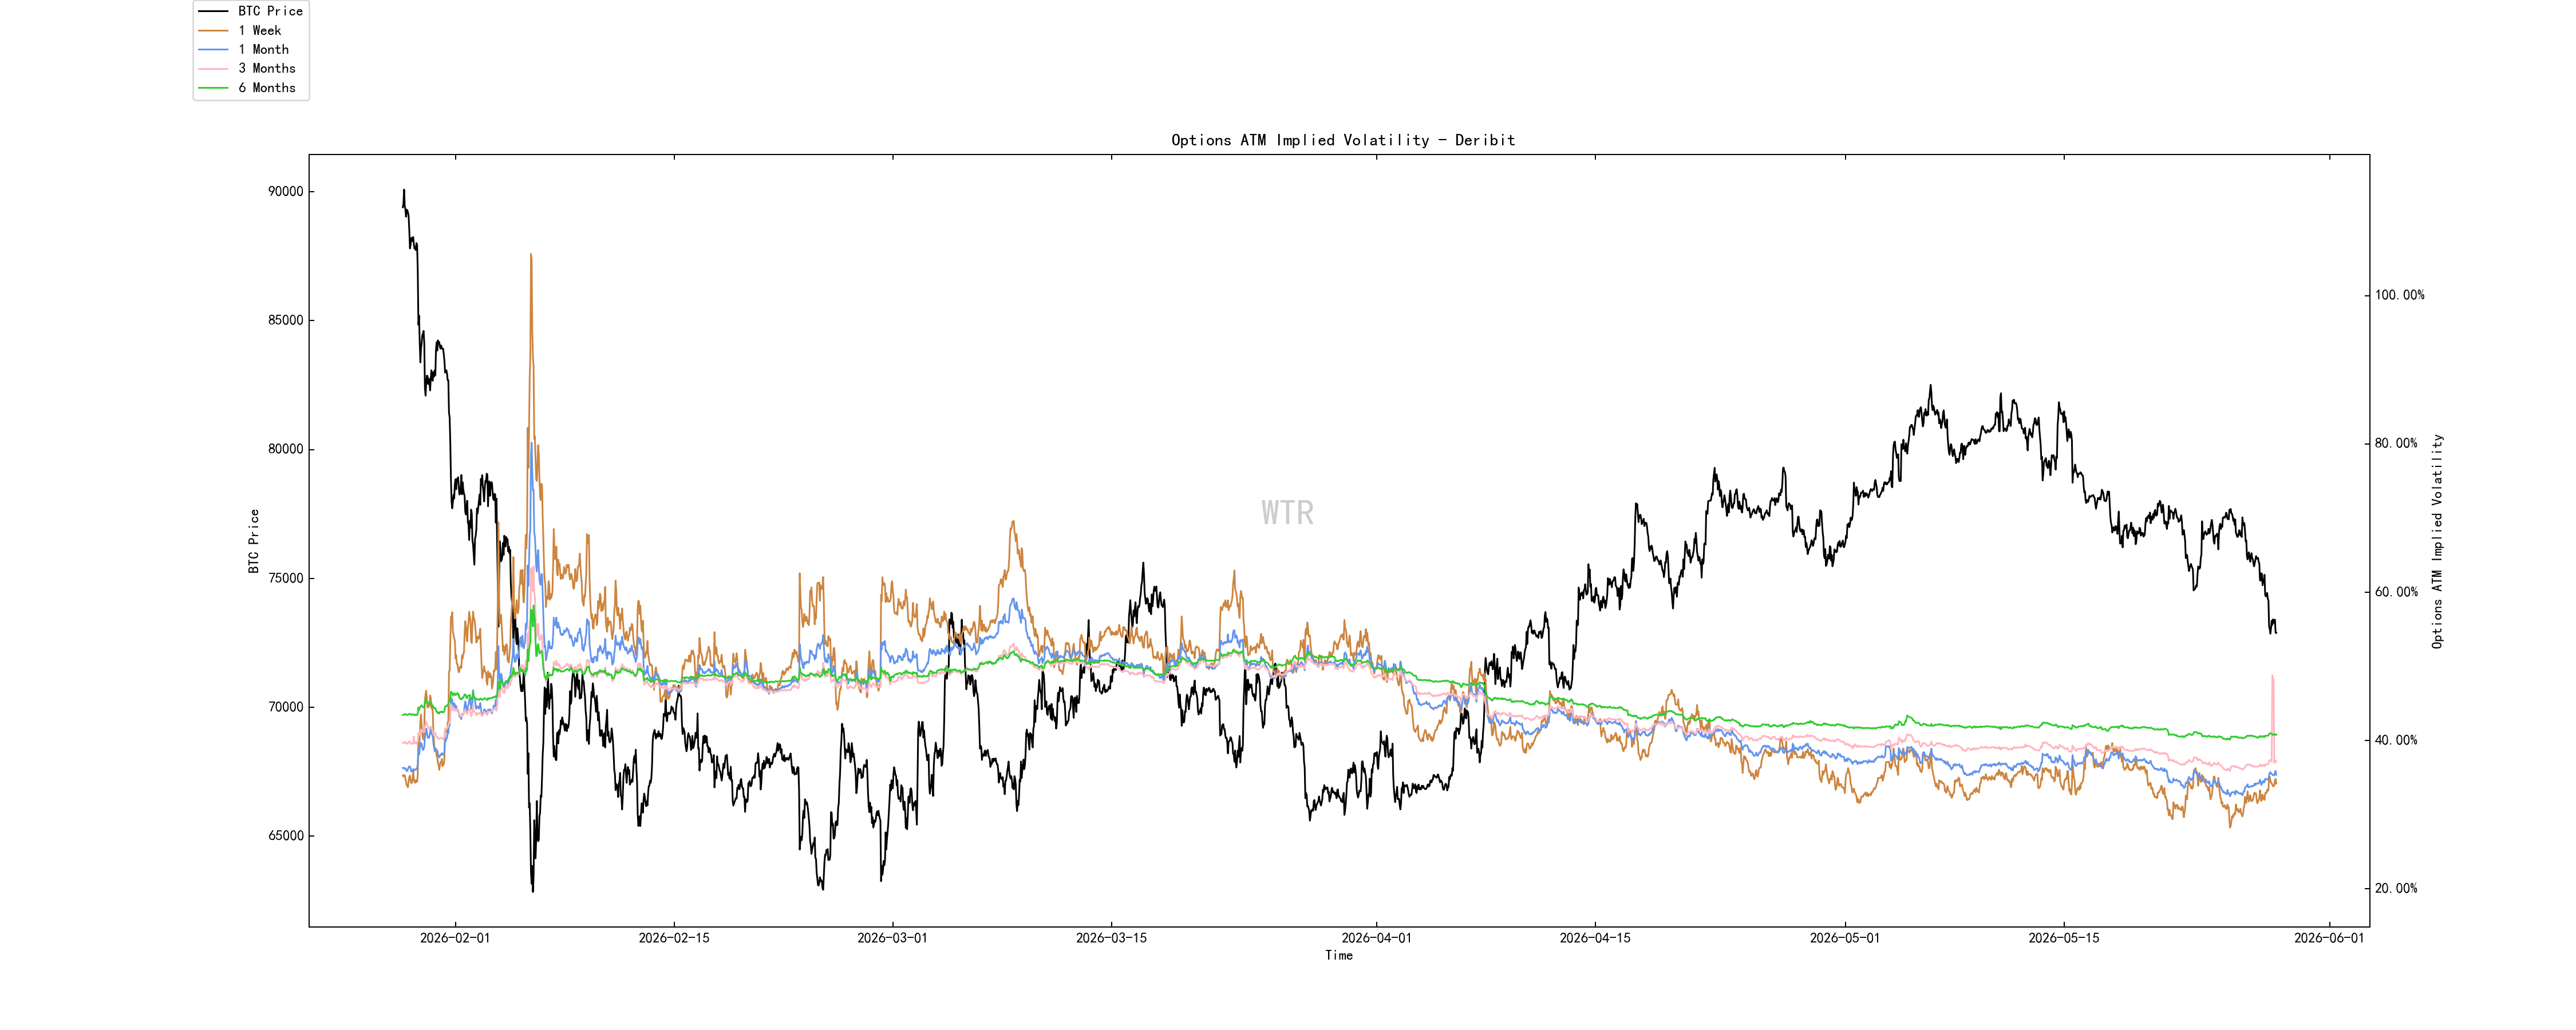 Implied volatility of options can fluctuate briefly.
Emotional state rating: Hesitant
(See chart below for profit/loss transfer amount)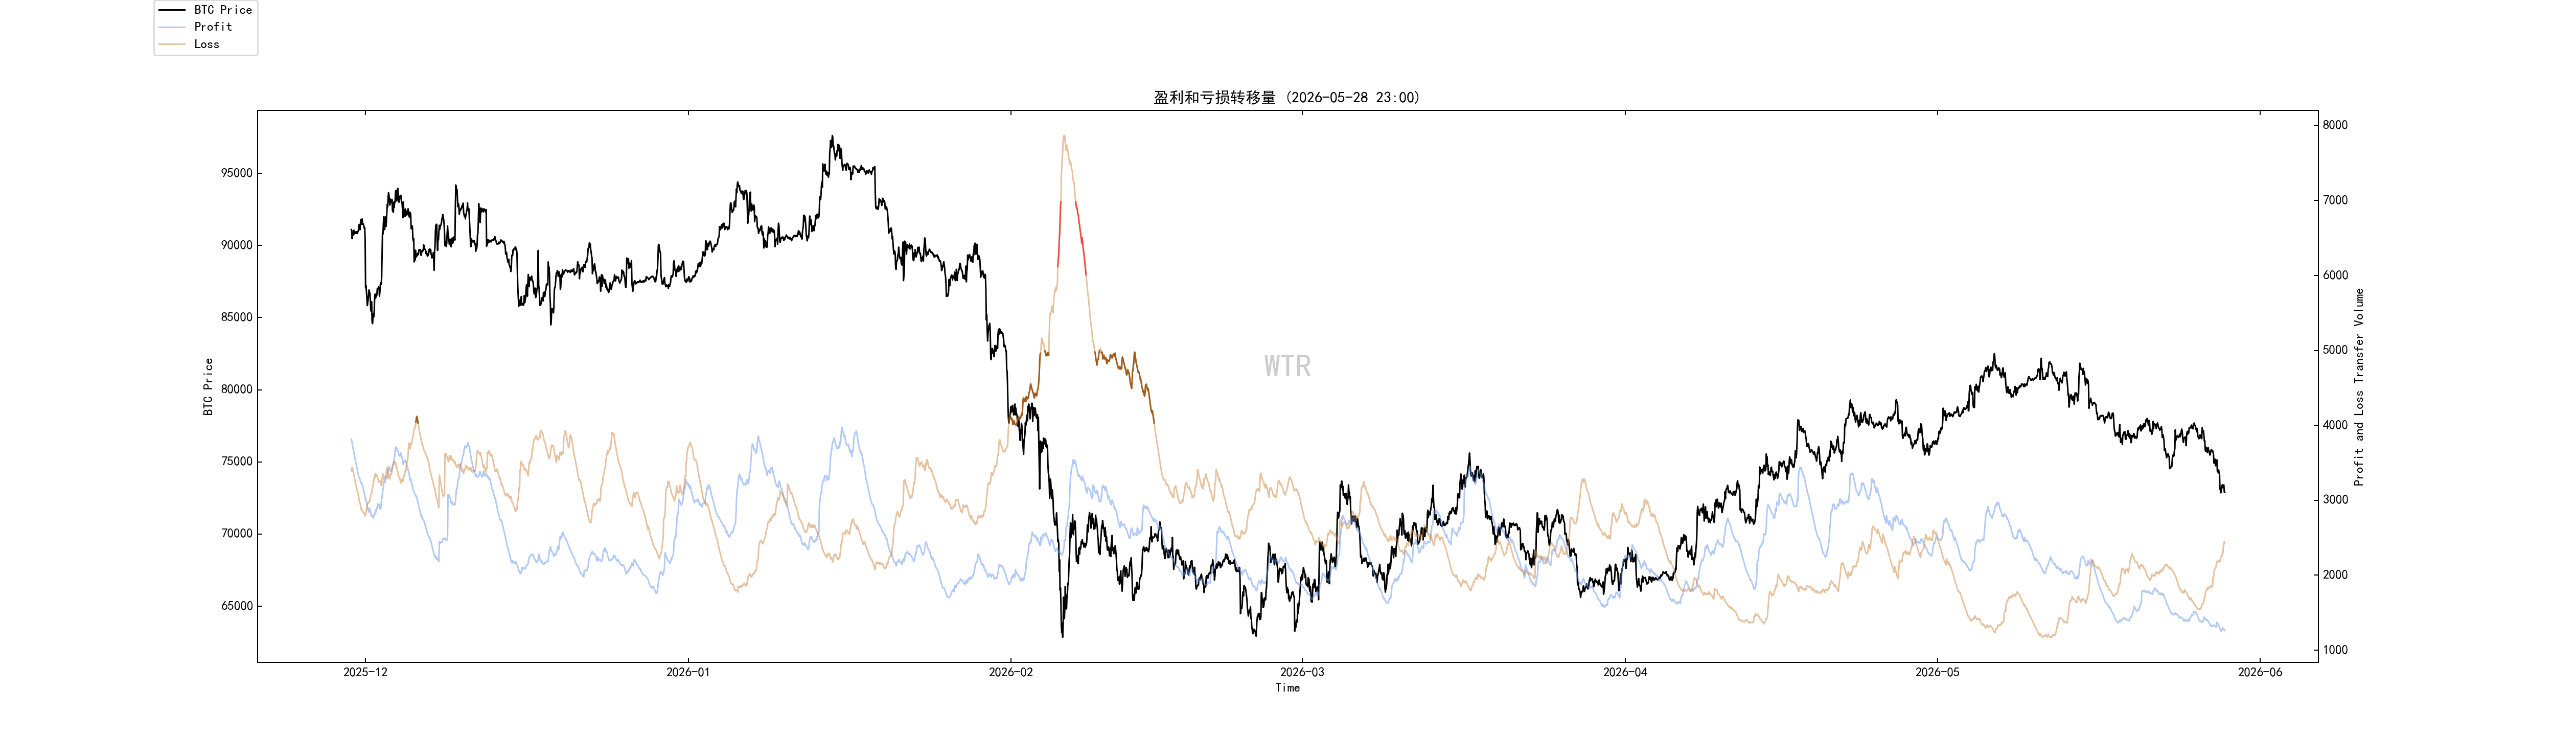 The slight decline did not trigger a larger panic sell-off, and the current market sentiment is rather hesitant.
(See the image below for newly added and active addresses)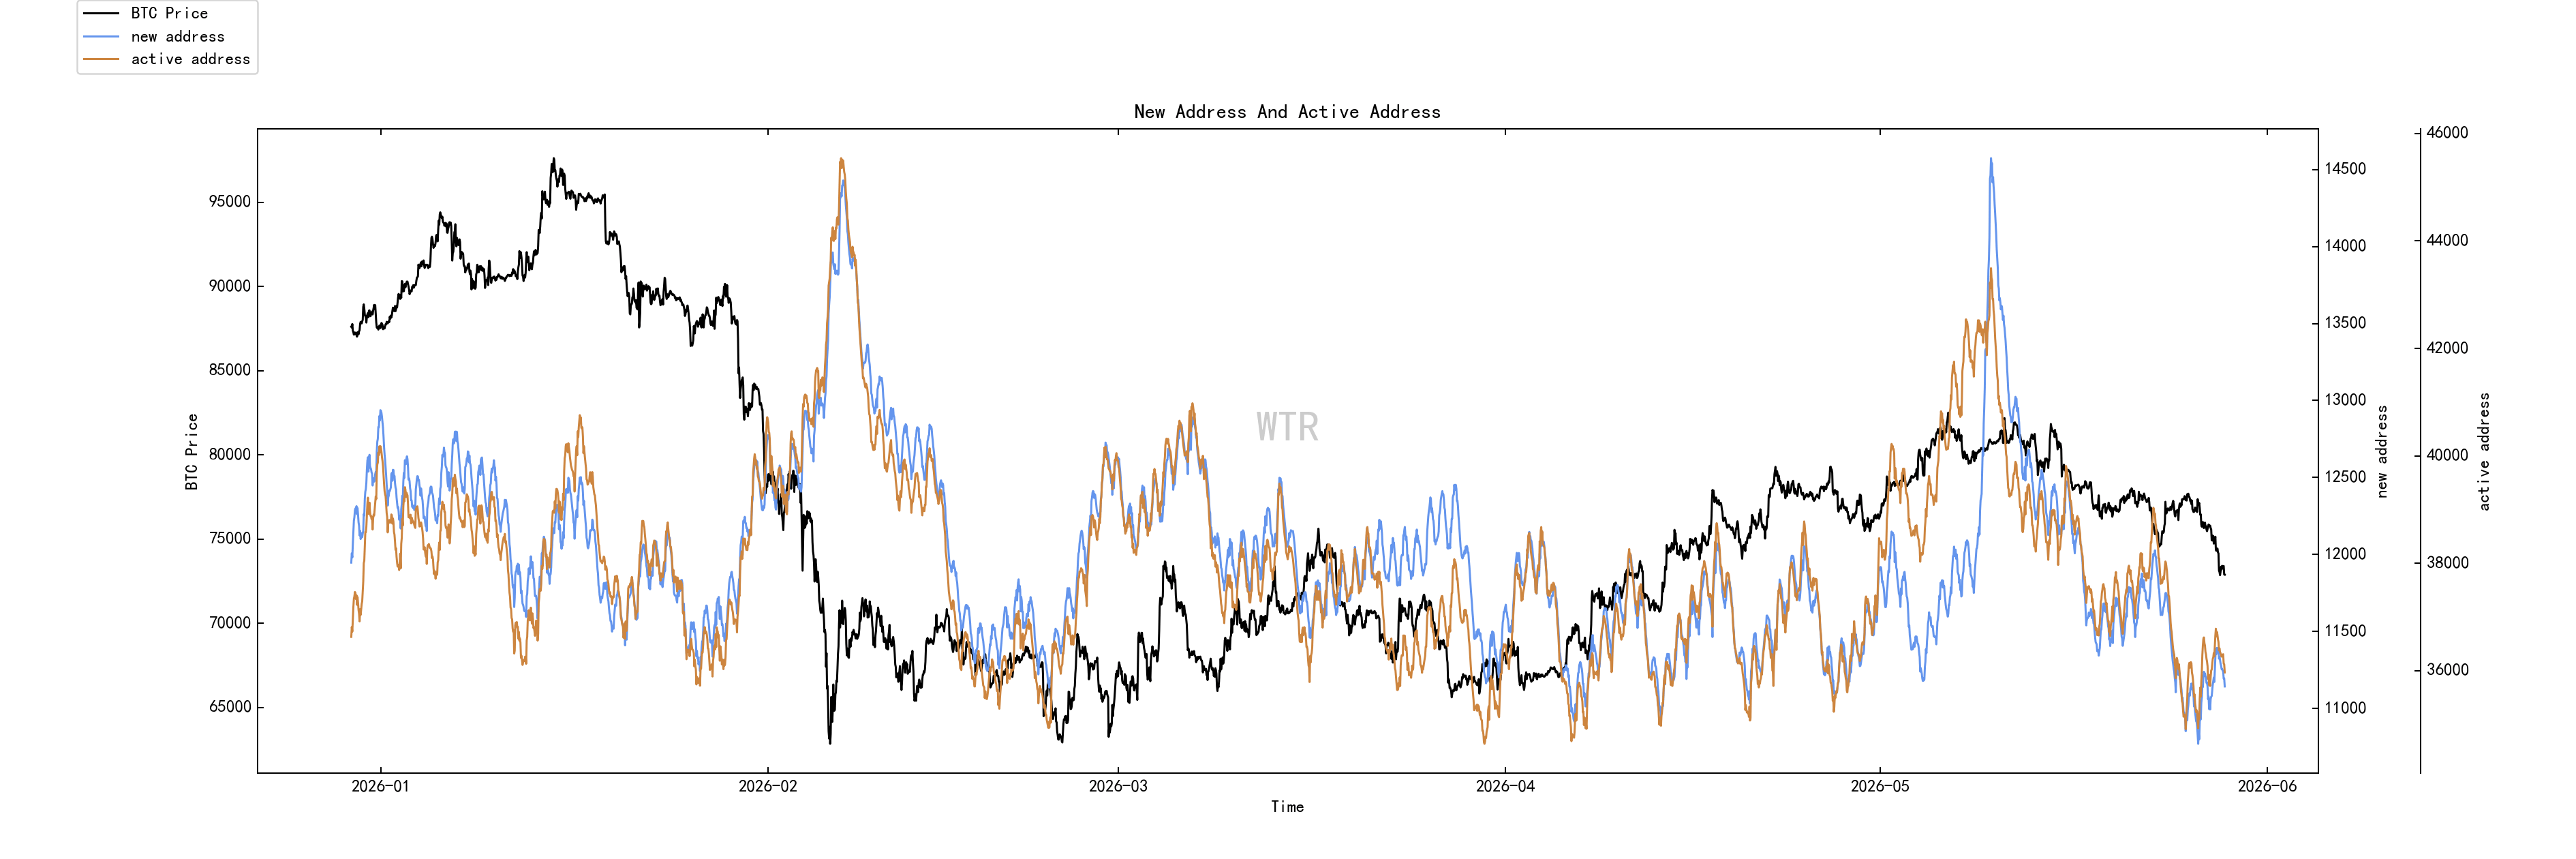 The number of newly active addresses is near the low level.
Spot and selling pressure structure rating: Net positions in both BTC and ETH on exchanges are accumulating inflows.
(See chart below for Bing Tang Cheng's net exchange position)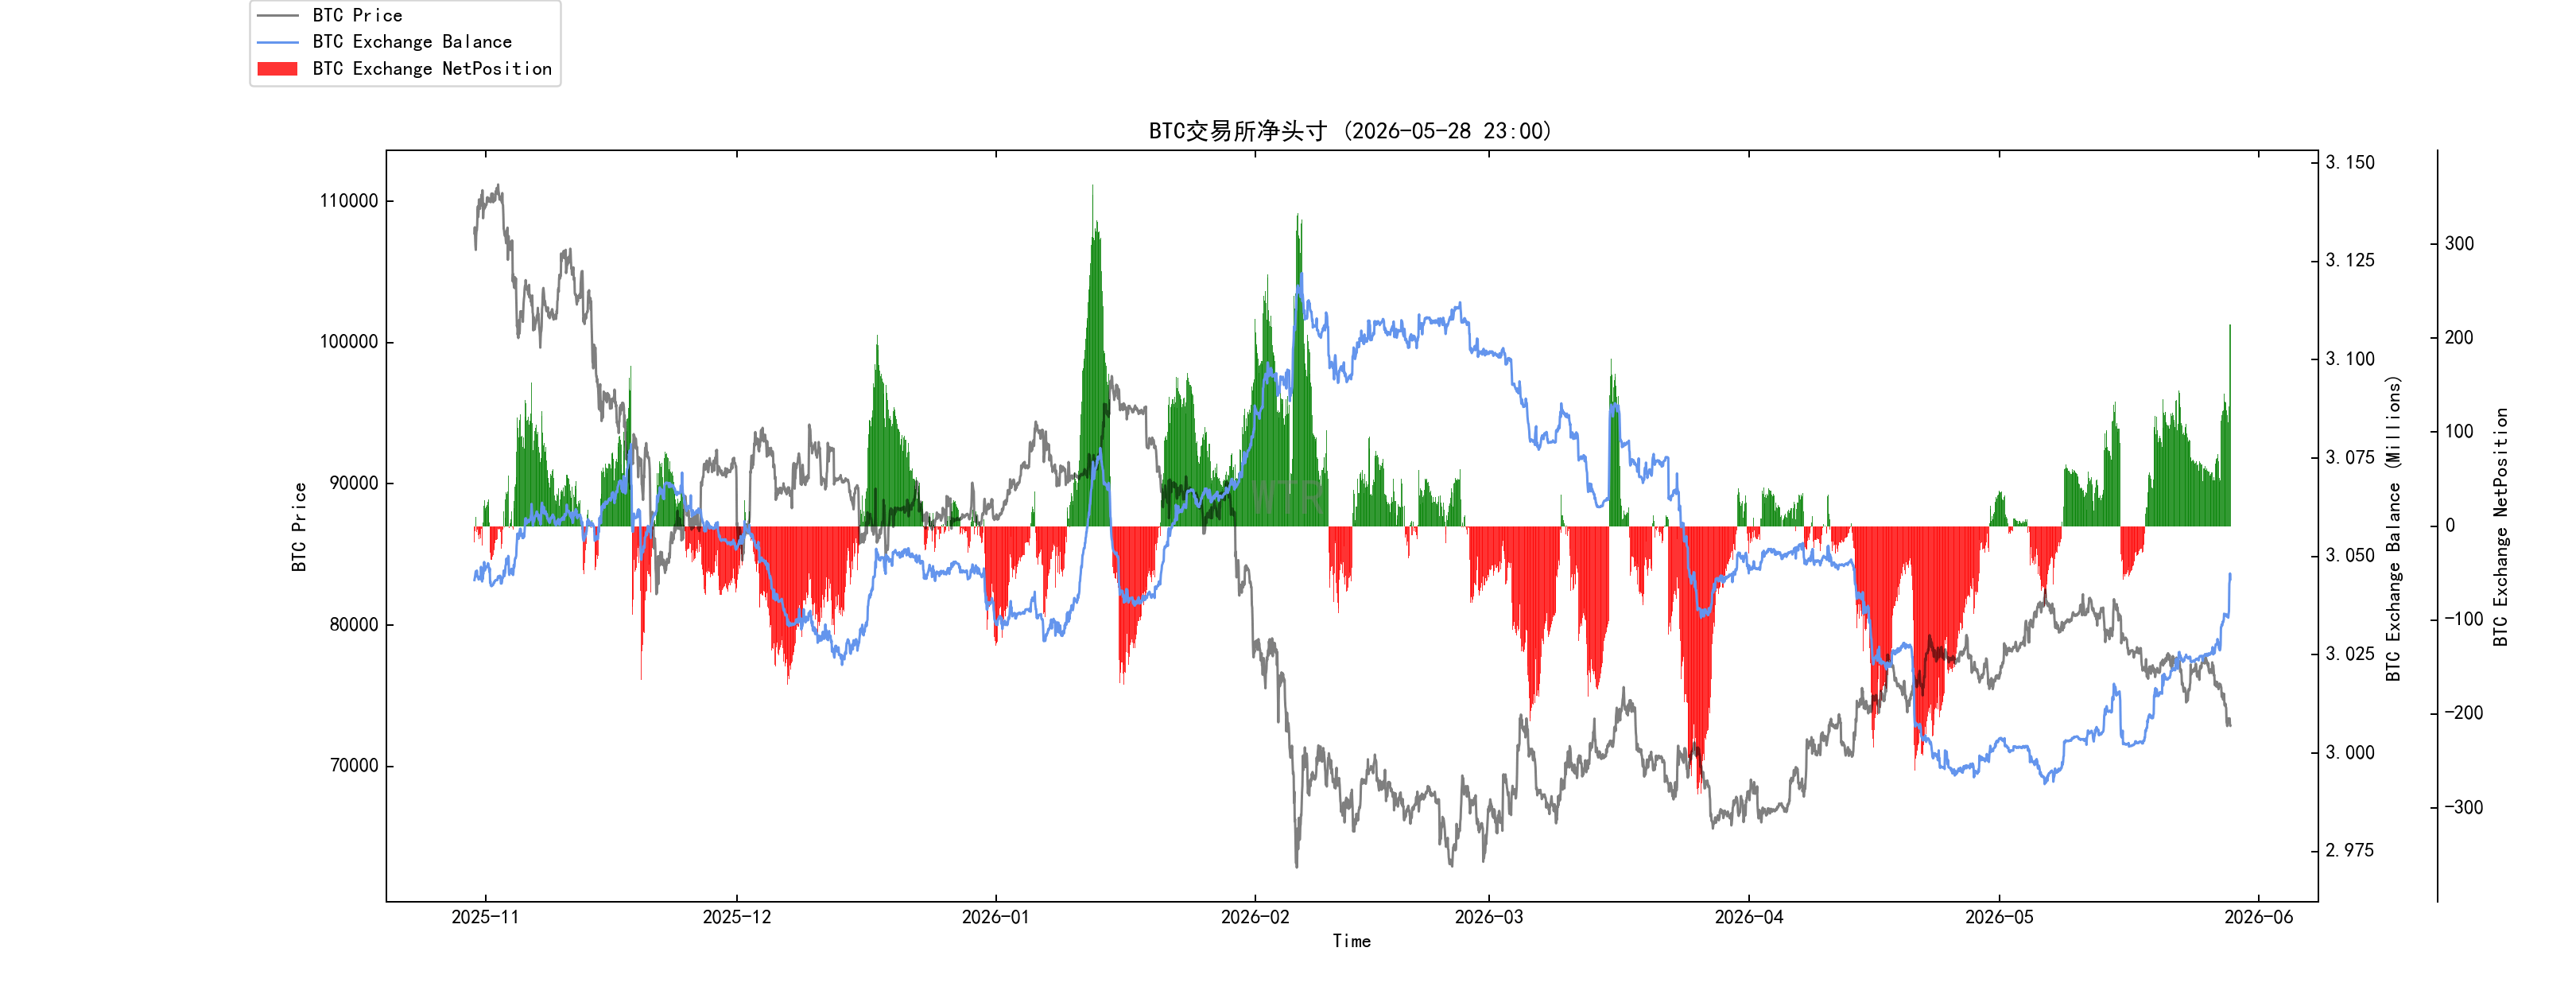 BTC exchange net positions were in a state of slight inflow accumulation last week.
(See chart below for E-Taiwan exchange net positions)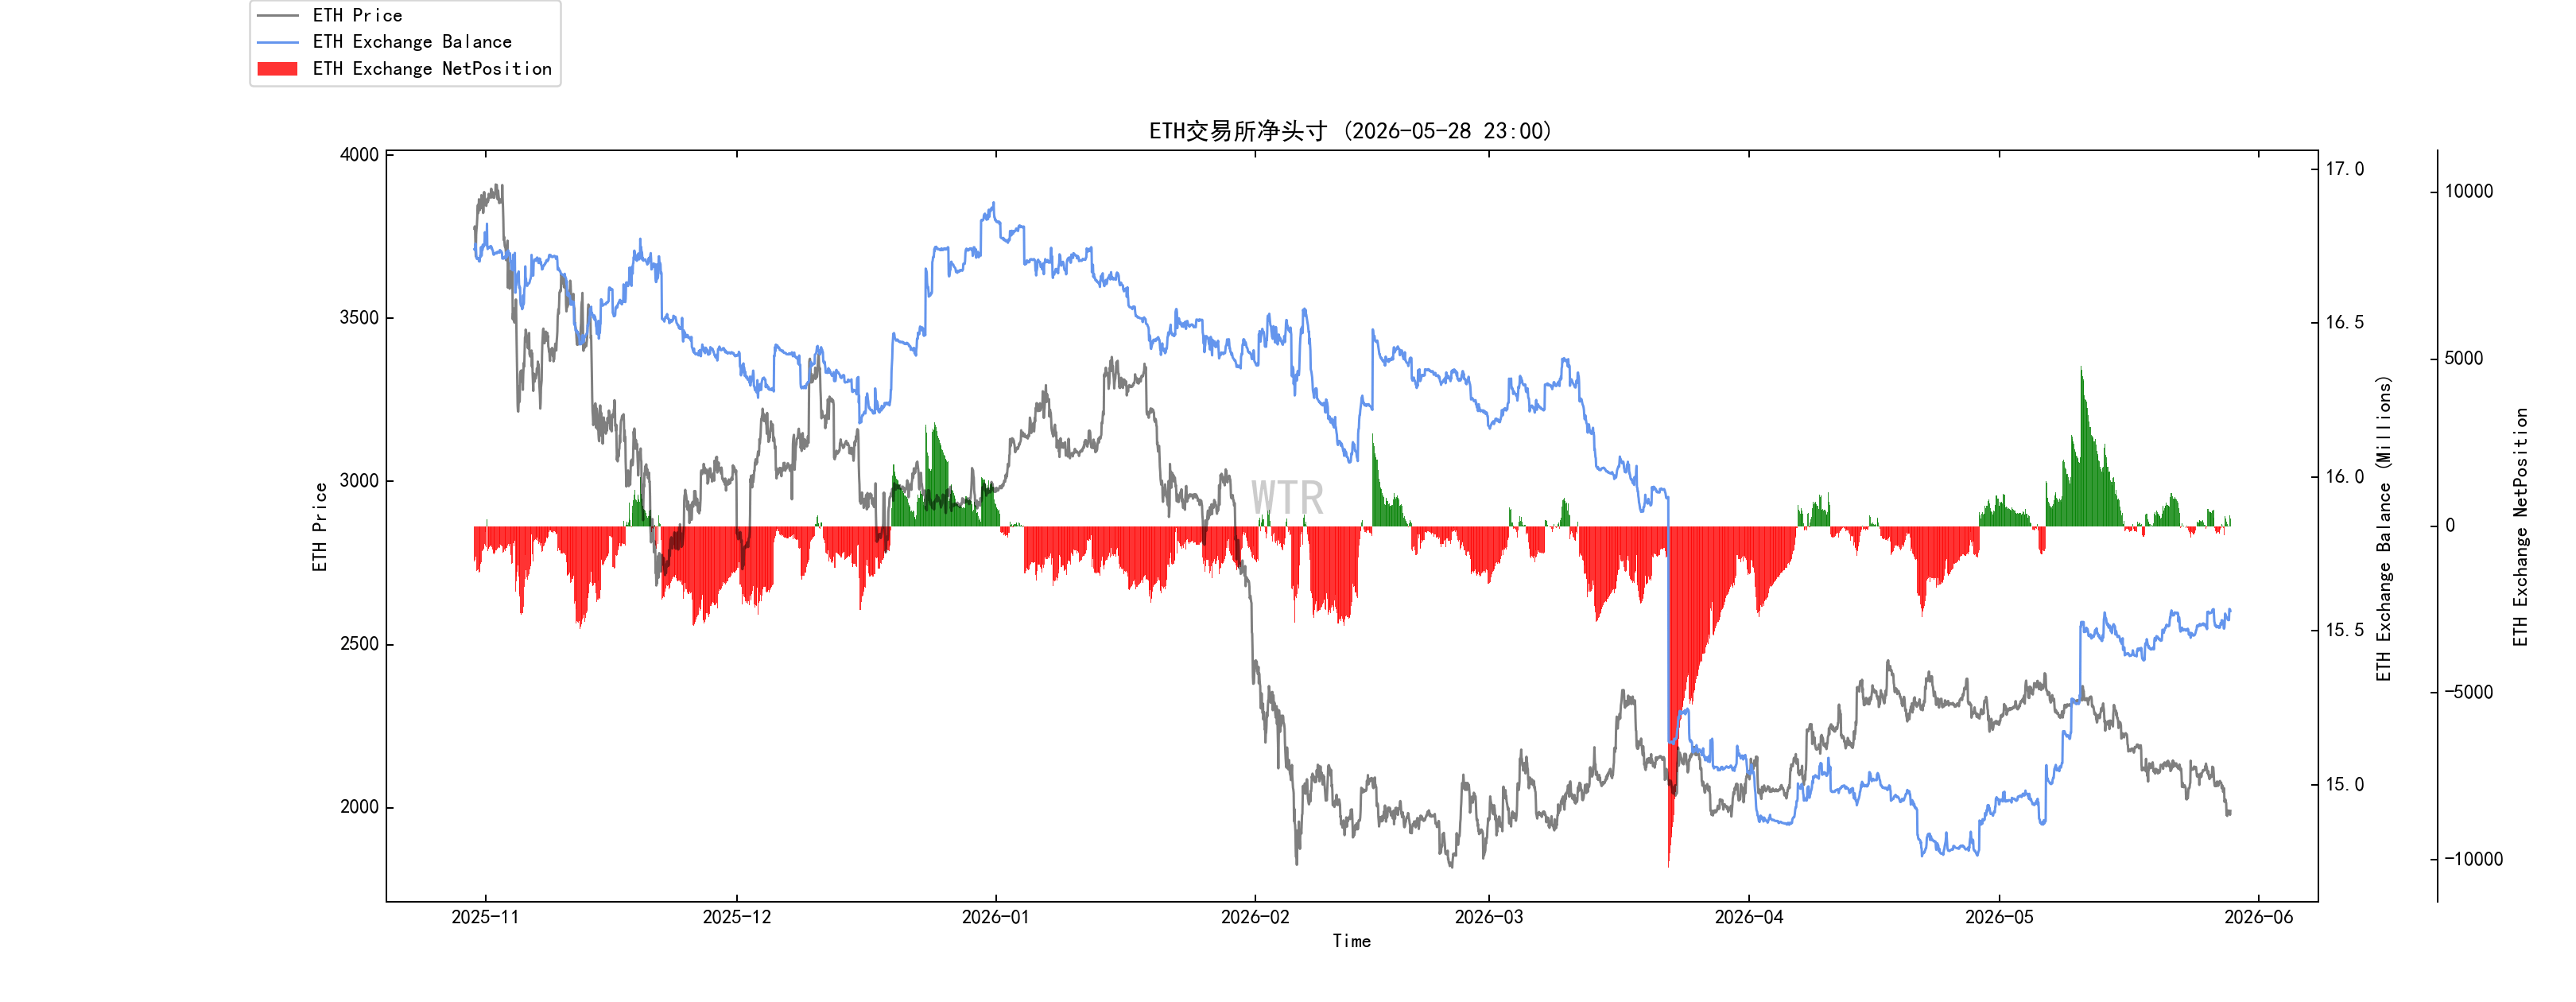 ETH exchange net positions accumulated with a small inflow overall last week.
(See chart below: High-weighted selling pressure)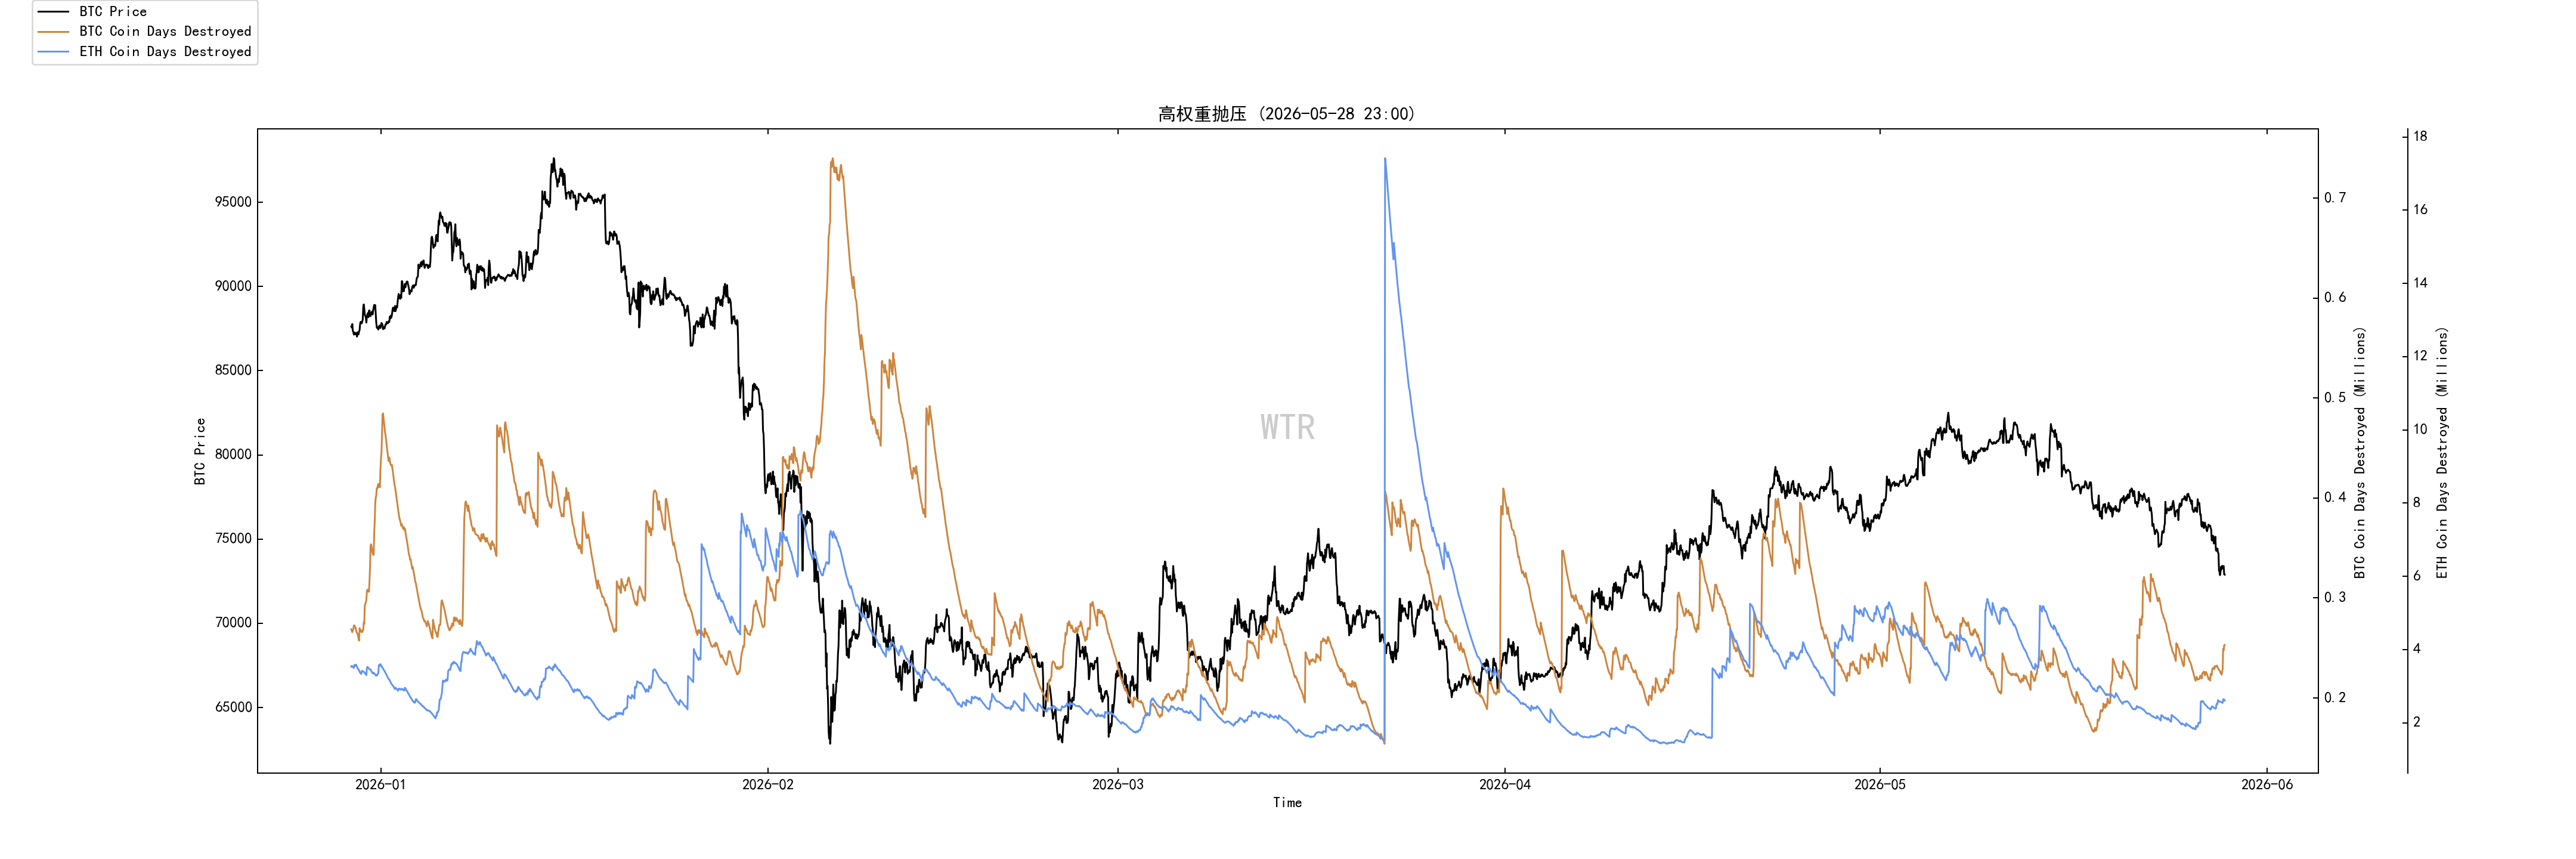 There is some selling pressure on BTC due to high weighting.
Purchasing power rating: Global purchasing power and stablecoin purchasing power loss.
(See chart below for global purchasing power status)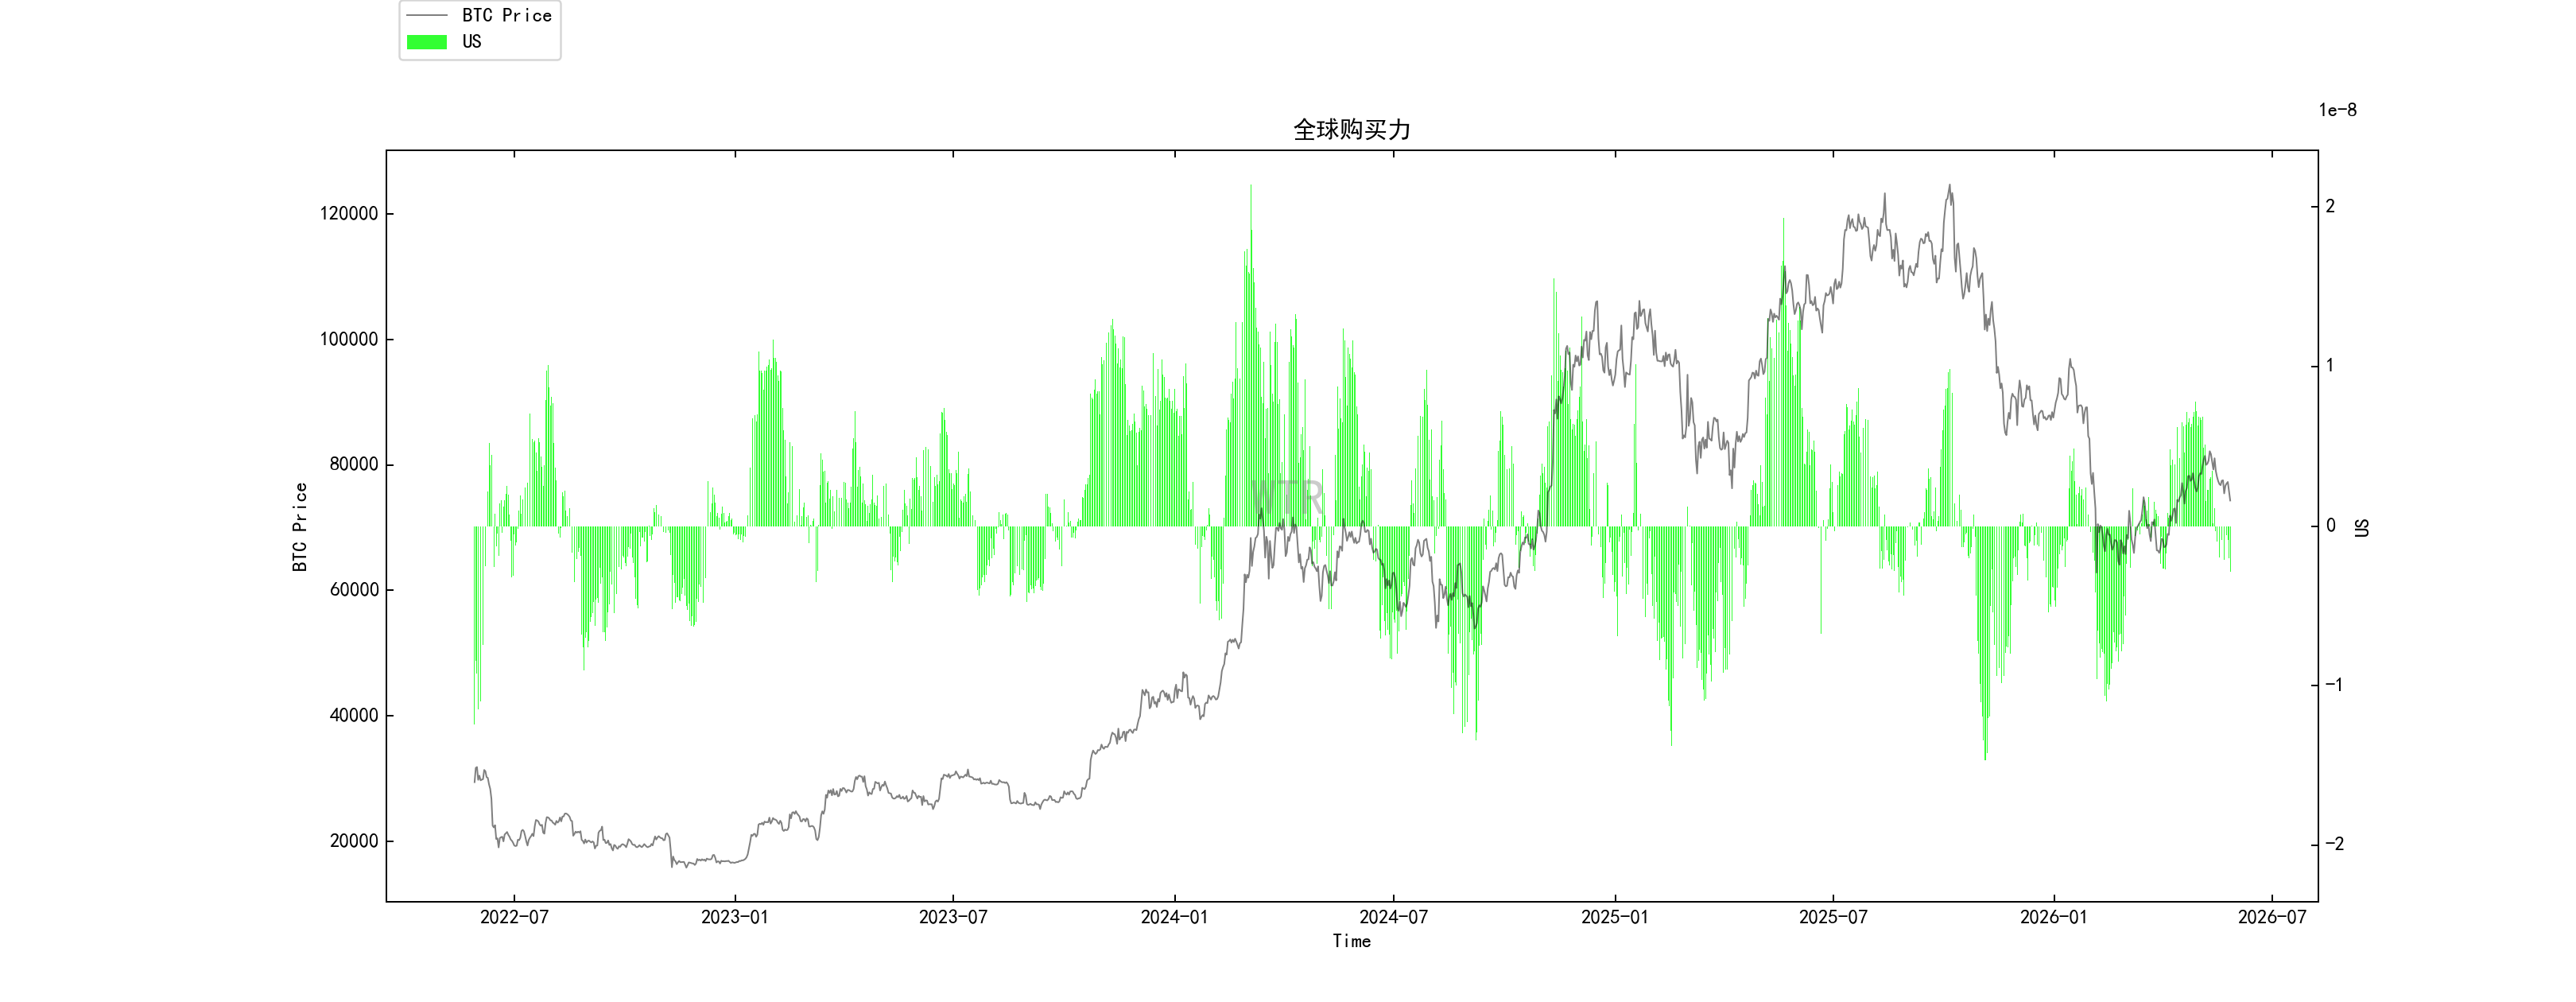 Global purchasing power has fallen into negative territory.
(See chart below for USDC exchange net positions)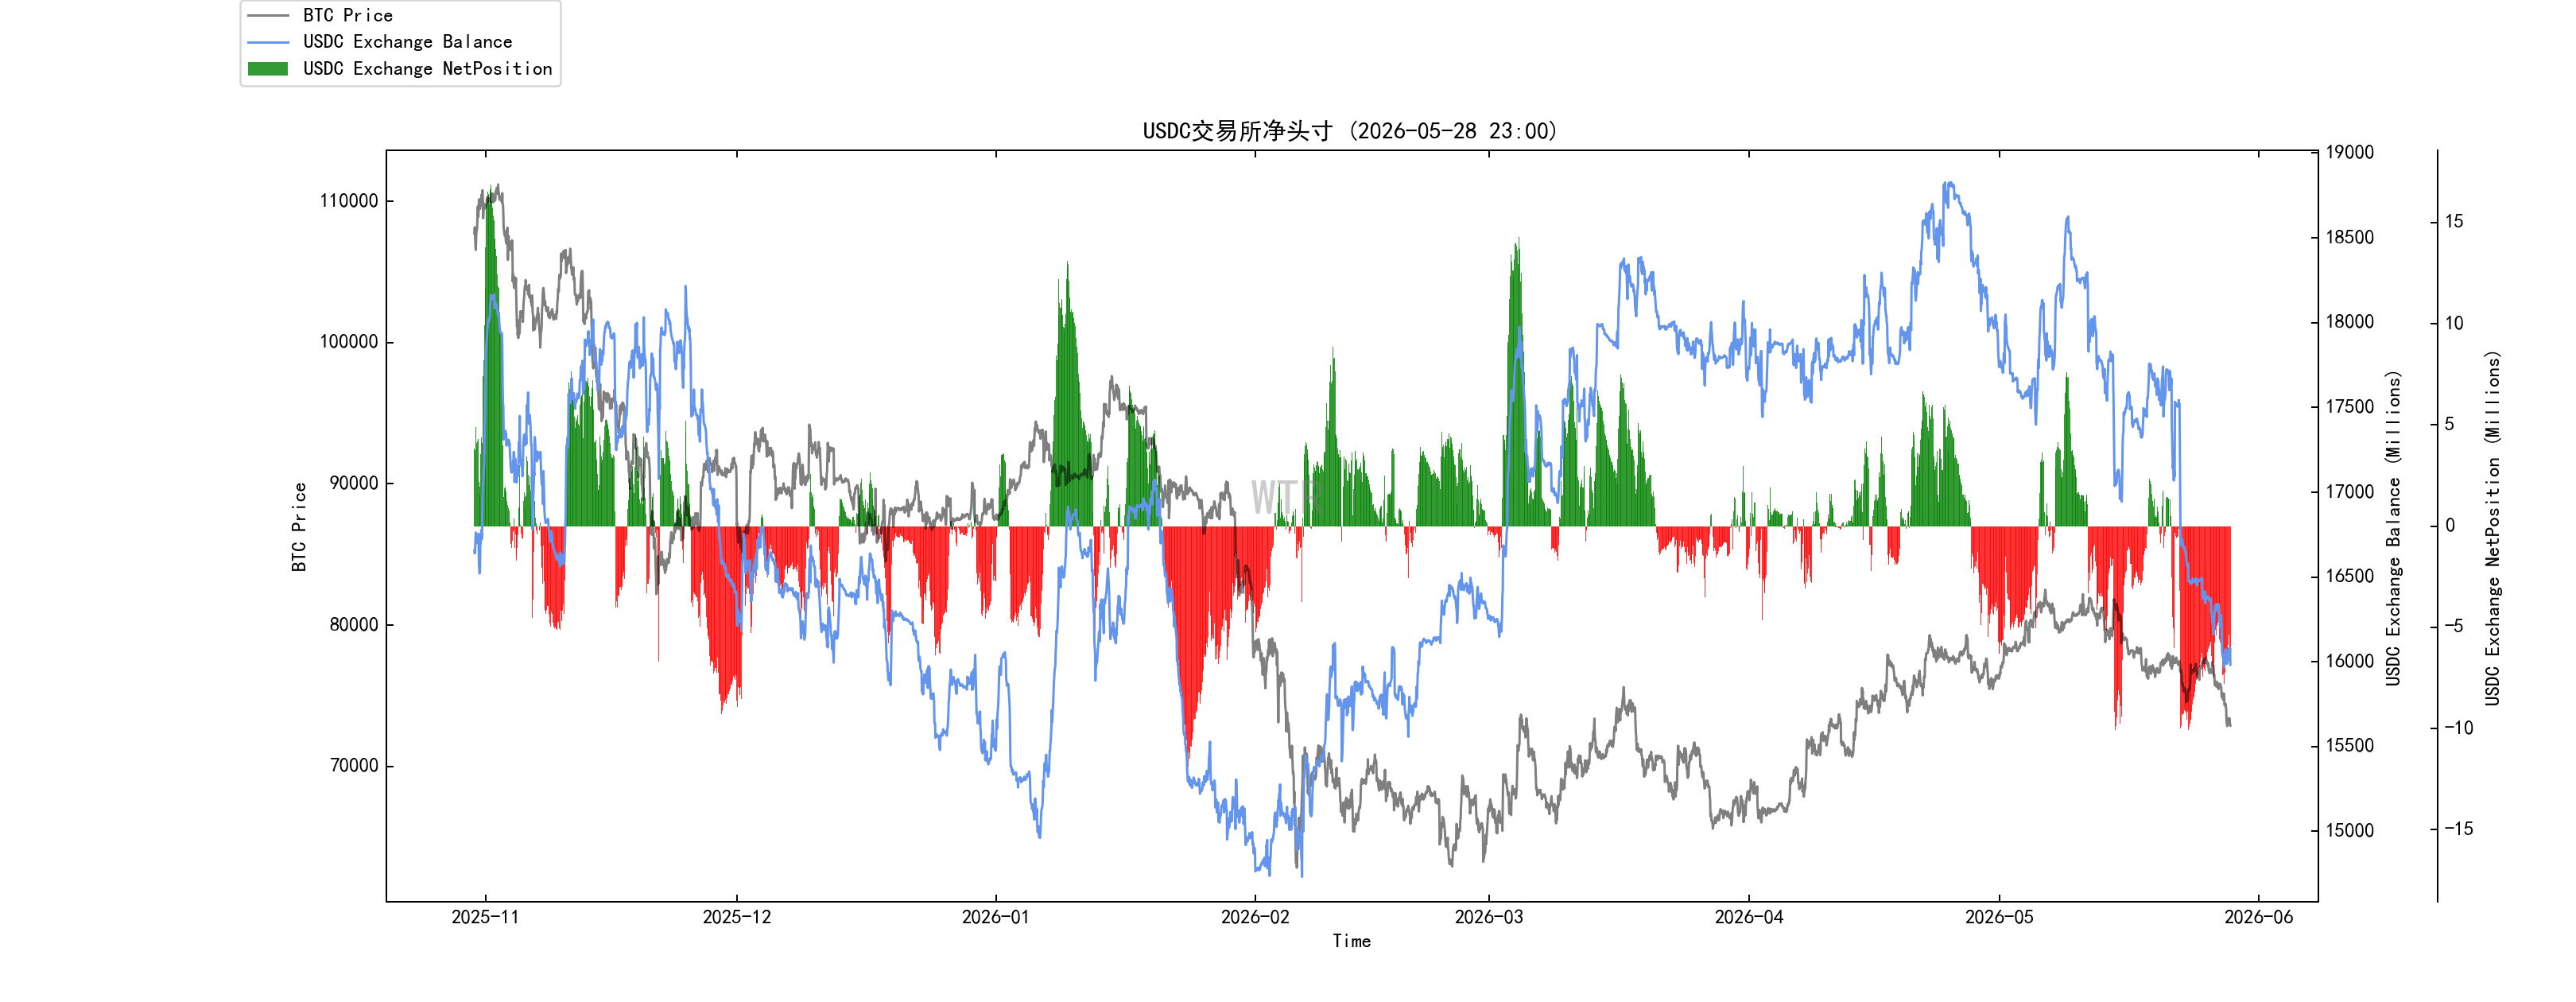
Stablecoins experienced a slight loss of purchasing power.
This week's summary:
News Summary:
The key change in the market this week was the short-term easing brought about by the decline in oil prices, but the high interest rate framework remained unchanged.
Oil prices fell from their highs after hopes emerged that the Strait of Hormuz would reopen, and market concerns about runaway inflation and further interest rate hikes eased.
However, this only mitigates the risk, not eliminates it. As long as energy channels are not fully restored, oil prices will continue to influence inflation expectations and constrain the policy space of the Federal Reserve, the European Central Bank, and the Bank of Japan.
The most important variables in the current capital markets remain the yield on US Treasury bonds and the US dollar.
If the 10-year US Treasury yield continues to remain around or above 4.5%, growth stocks, technology stocks, real estate, gold, and crypto assets will all face valuation pressure.
A renewed strengthening of the US dollar would also suppress risk appetite in non-US assets, commodities, and the crypto market.
The current US stock market is not in a full-blown bull market; rather, AI and corporate earnings are supporting the index, while high interest rates are limiting valuations. The AI supply chain remains the strongest theme, but its high market concentration indicates that funds haven't spread widely. If US Treasury yields continue to rise, highly valued tech stocks will face pressure for a period of correction.
In the crypto market, there is currently no independent market trend; it mainly follows changes in macro interest rates, the US dollar, and ETF fund flows. BTC and ETH ETFs continue to experience net outflows, indicating insufficient short-term buying pressure.
BTC remains a macro-level liquid asset, ETH lacks significant capital inflows, and while SOL offers greater flexibility, its scale is limited, essentially still dependent on overall risk appetite. At this stage, there's no need to focus too much on the internal crypto ecosystem; what truly determines price direction are US Treasury bonds, the US dollar, ETF funds, and global risk appetite.
Stablecoins, RWAs, and tokenized assets remain worth watching, but their significance lies not in short-term speculation, but in the potential changes to traditional financial payment, settlement, and securities circulation systems. In other words, these areas are more like variables in capital market infrastructure than short-term price catalysts.
Long-term on-chain insights:
Currently, BTC's on-chain structure is performing better than its price.
Long-term holdings are increasing, short-term speculators are decreasing, and the floating supply in the market is contracting, which forms the basis of a medium-term bottom structure.
However, ETF funds are still flowing out, while exchange-traded whales are still flowing in. Long-term non-liquid whales are not firmly defending the market, and the short-term cost line is still suppressing the price.
Therefore, it's neither wise to be overly bullish nor necessary to be extremely bearish. The market is in a typical transitional phase: on-chain conditions are beginning to show signs of a bottom, but the funding environment has not yet provided confirmation of a reversal.
In the short term, it remains to be seen whether the price can hold above $77,800.
In the medium term, we need to see if ETFs will see renewed inflows.
Looking at the bigger picture, we need to consider whether US Treasury yields and the US dollar weaken.
Market outlook: This is a market where the supply of shares is gradually decreasing and funds remain relatively cold. The outline of a bottom has emerged, but the funds needed to initiate a trend have not yet arrived. Until ETF outflows stop, whales cease flowing into exchanges, and BTC stabilizes above its short-term cost line, all rebounds should be treated as weak corrections.
On-chain mid-term exploration:
USDC rating contraction led to a pullback in funds in the US market, resulting in weakened buying power.
As new funds collectively withdraw, stablecoin supply decreases in tandem with the overall supply.
BTC deposits are rising, and the market is currently under pressure.
With losses increasing and trading volume expanding, caution is advised when making judgments at this time.
Loss-making shares are being released in a structural manner.
Market outlook: Under pressure and undergoing a clearing process. Funds are currently withdrawing, and loss-making shares are being released, putting the market under pressure and in a clearing phase.
Short-term on-chain observations:
Derivatives rating: The risk coefficient is in the green zone, indicating that the risk of derivatives is low.
The number of newly added active addresses is relatively low.
Emotional state rating: Hesitant.
Both BTC and ETH net positions on the exchange are in a state of inflow accumulation.
Global purchasing power and stablecoin purchasing power are being lost.
Market outlook: Last week, the market tested the short-term holders' cost line (78K) and then turned downwards, but the decline was not significant. This week, the market is expected to continue to fluctuate around the current price level, and the probability of a sharp reversal downwards is relatively small.
Risk Warning: The above are market discussions and explorations, and do not constitute investment advice. Please be cautious and take precautions against black swan risks in the market. This report is provided by the WTR Research Institute.
Welcome to follow us: