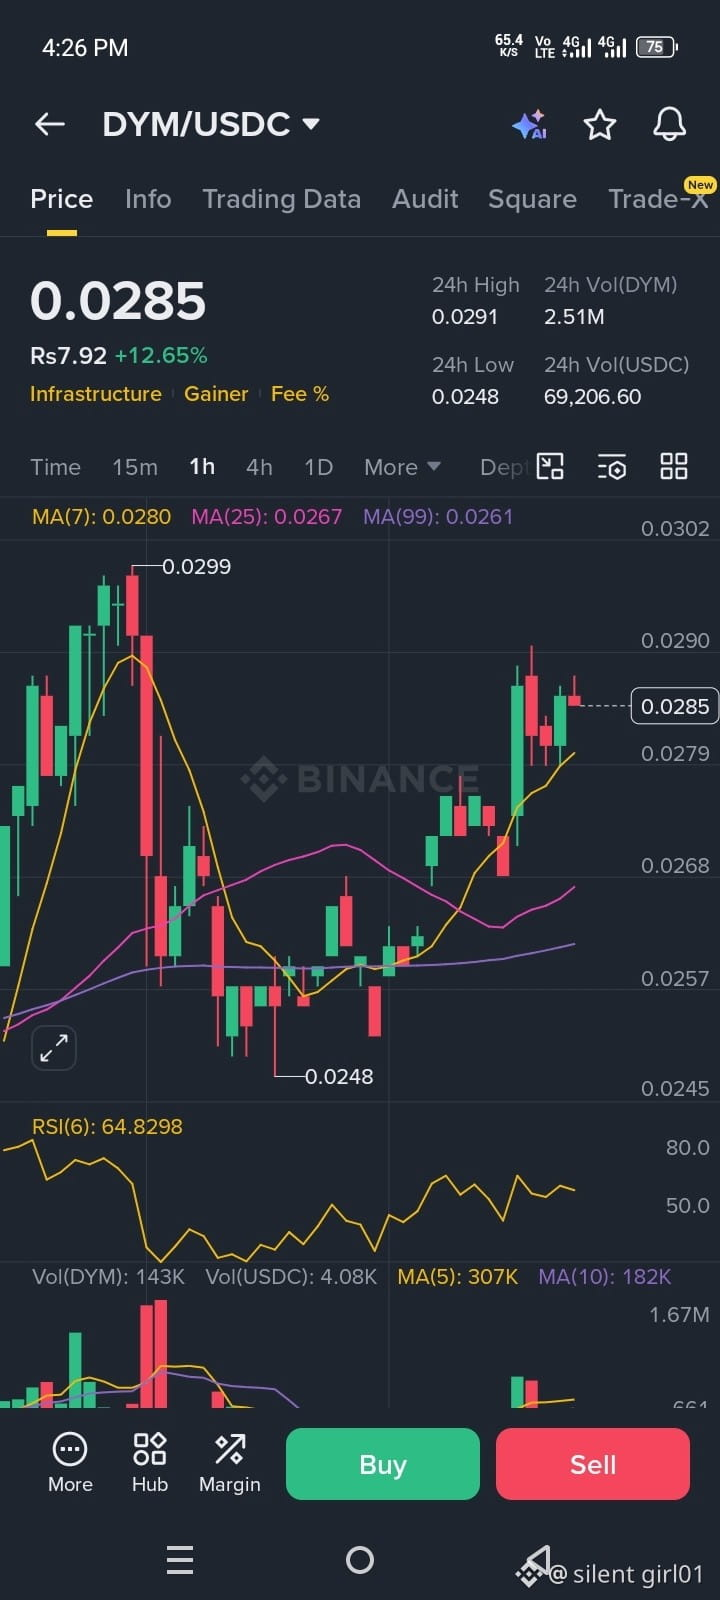
📊 Chart Analysis for $DYM /USDC 🚀
We're looking at a clear bullish reversal structure! The $DYM coin has formed a strong support level around 0.0248 and successfully broke through the short-term moving averages with solid buying pressure.
Here’s the direct trading plan:
🔹 Trend: Buy (LONG) 🟢
🔹 Entry Zone: 0.0275 - 0.0285
🔹 Stop Loss (SL): 0.0260
🎯 Target Levels (TP):
• Target 1: 0.0299
• Target 2: 0.0320
• Target 3: 0.0350
Plan your entry precisely and let the profits grow! 💸
#DYM #Crypto_Trading #صعود
We're looking at a clear bullish reversal structure! The $DYM coin has formed a strong support level around 0.0248 and successfully broke through the short-term moving averages with solid buying pressure.
Here’s the direct trading plan:
🔹 Trend: Buy (LONG) 🟢
🔹 Entry Zone: 0.0275 - 0.0285
🔹 Stop Loss (SL): 0.0260
🎯 Target Levels (TP):
• Target 1: 0.0299
• Target 2: 0.0320
• Target 3: 0.0350
Plan your entry precisely and let the profits grow! 💸
#DYM #Crypto_Trading #صعود