

Chart analysis for pair $SOL – weekly timeframe with a complete reading of levels and expected scenario:
---
🔍 First: Read the Market Structure
✔️ Overall Trend
It is clear that the price has exited a rising channel and then returned to test its lower boundaries.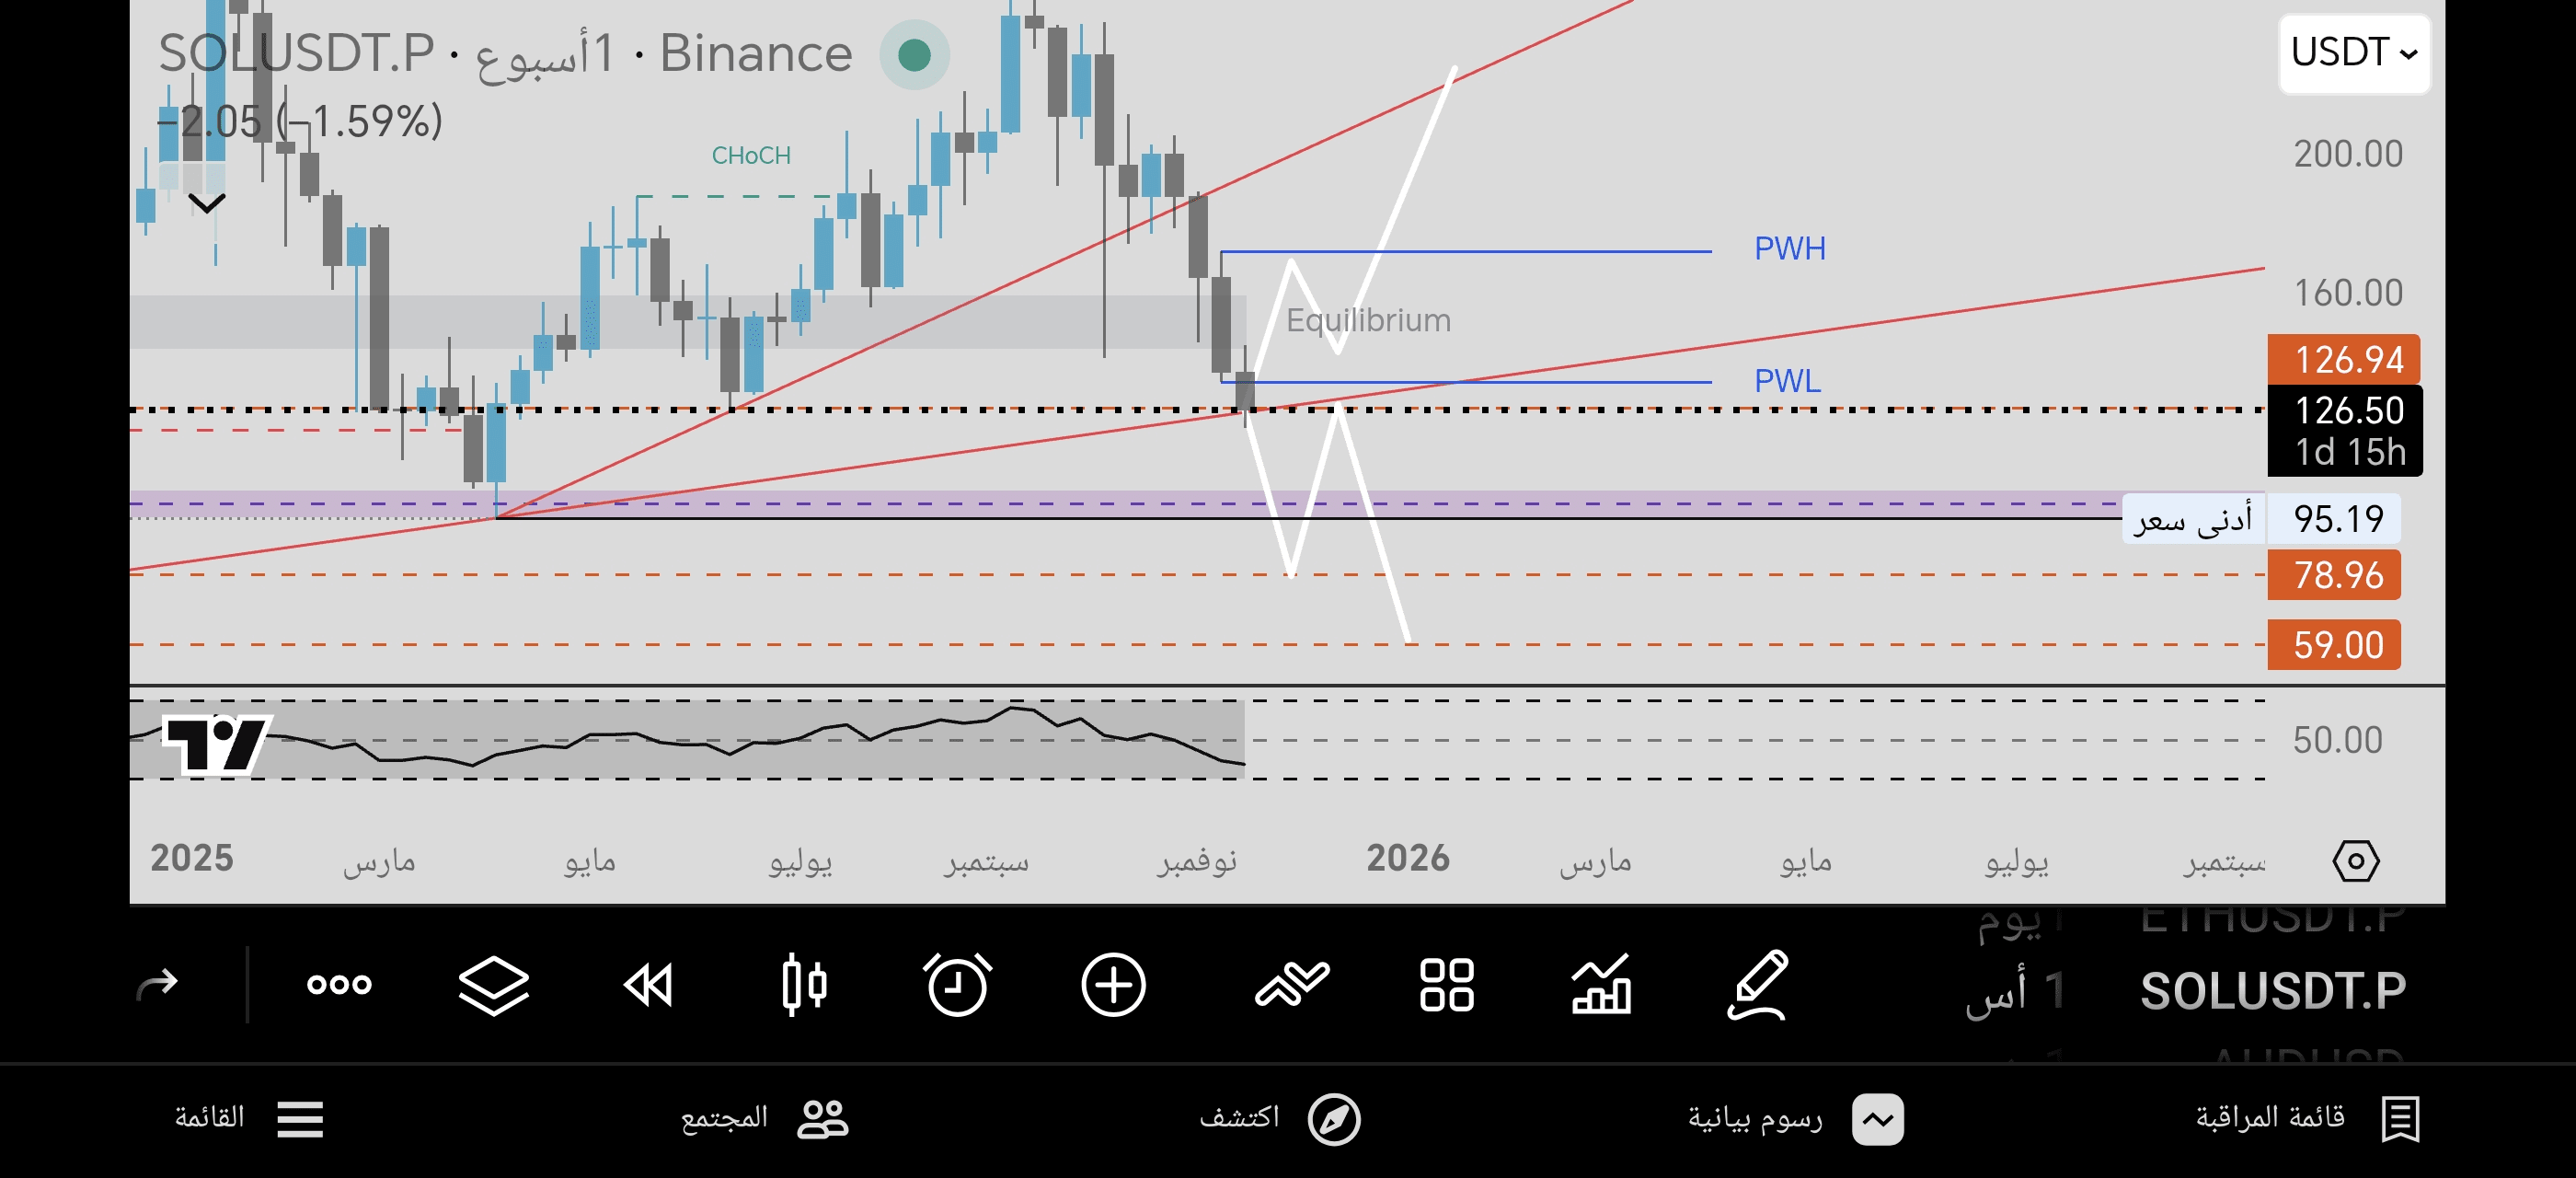
There is a previous Break of Structure (ChOCH) indicating a structural transition towards a downward trend.
✔️ Current Area
The price is currently above a strong Weekly Demand area, which is approximately between:
95 – 126 USDT
There is a Pinbar candle/strong price rejection at the red line (the lower trend).
---
🎯 Second: The most important levels
🔵 Potential buying levels (Zones of Interest):
1. 126 – 120
Current area but not the best for buying as it is not a clear bottom.
2. 95 – 90 (best buying area)
✔ Strong weekly demand area
✔ At that point, there is a lower trend line + PWL level
✔ RSI close to oversold
3. 78 – 80
✔ Historical support area
✔ Strong buying opportunity if the area of 95 is broken
4. 59
✔ Last support if reached is considered a long-term golden trade
---
🎯 Third: Expected scenario
Scenario 1 (most likely according to the chart):
The price may move like the drawn white model:
1. Drop to 95 – 90
2. Upward rebound towards the Equilibrium area at 150 – 160
3. After that, either resume the rise or retest below then surge towards the new peak
📌 This scenario aligns with the current wave movement + oscillation around the middle line.
---
Scenario 2 (bearish):
If it breaks 95$ with a weekly close:
Direct drop towards 78 – 80
And if it breaks → the next target 59$
---
📈 Fourth: Proposed trade
🎯 Investment/medium-term trade
Gradual buying:
First batch: at 95 – 90
Second batch: at 78 – 80
Third batch (if a break occurs): at 59
Targets:
Target 1: 126
Target 2: 150 – 160
Target 3 (long-term): 200
Stop Loss:
Weekly close below 78
---
✅ Summary
The price is now in a confusing area, and it's not the best for entry.
The best entry will be at 95 or 80 where strong demand zones and weekly trend converge.#BTC