$BTC
🚨 #BTC Technical Analysis – Hourly Frame
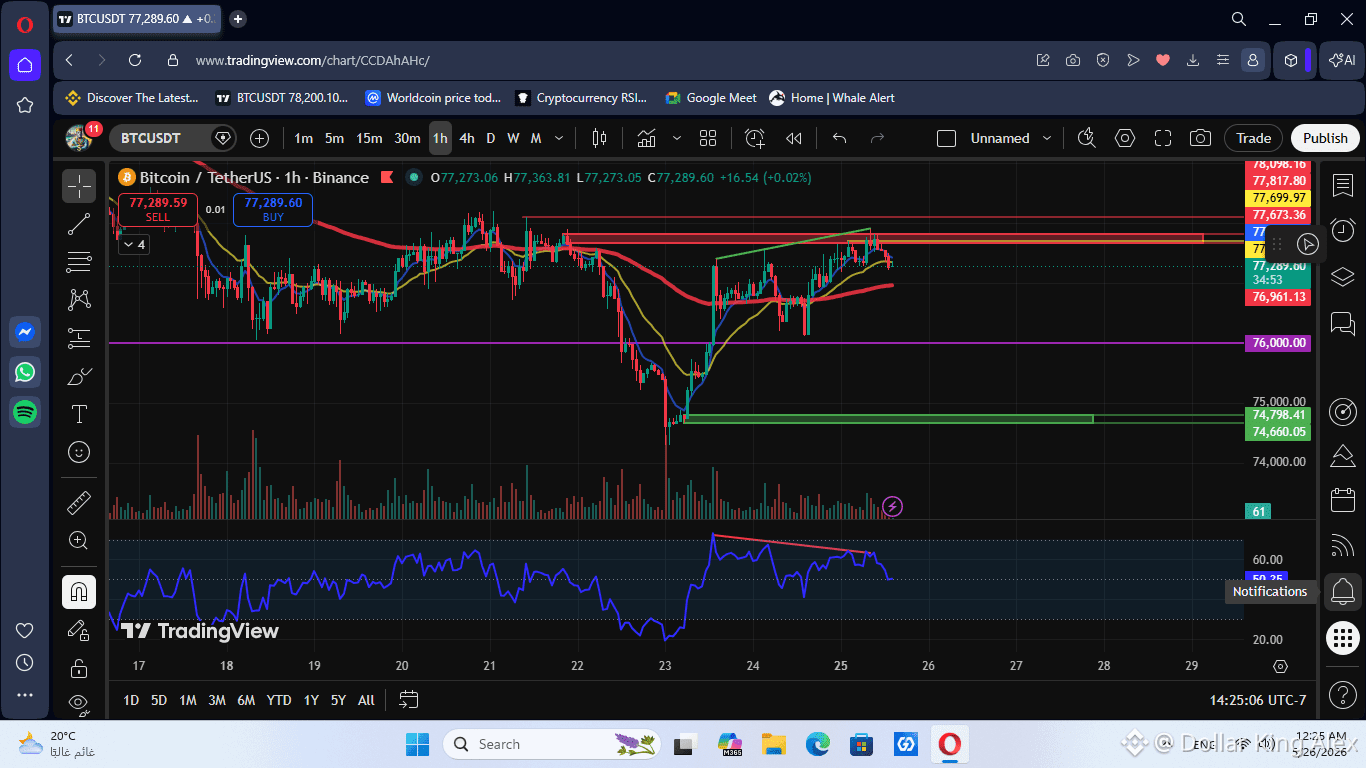
I see that Bitcoin has given clear signs of weakness after liquidity was pulled from the red sell zone, with a negative divergence appearing on the RSI indicator.
What happened?
🔴 The price made a new peak or matched the previous peak
🔵 While the RSI created a lower peak
⚠️ This is considered Bearish Divergence indicating weakness in buying momentum.
Also:
✔️ Liquidity was pulled above the peaks
✔️ Strong rejection from the sell zone
✔️ Beginning to lose the bullish momentum
Expected scenario according to my view:
📉 Continued downward correction
📍 Breaking the current support levels could push the price towards:
76K → 75K → the strong buy zone near 74K
🟩 The 74K area is considered a strong Demand Zone, and we may see a good bounce if the price reaches it.
But attention is needed:
Breaking the red zone and holding above it could invalidate the bearish scenario and bring back the bullish momentum again. (Meaning if there is a breakout of the red zone on the chart and we build candles above it, we expect a continuation to the 82K level and cancellation of the downward correction scenario.)
📊 Summary:
The market is now in a very sensitive area, and risk management is more important than predicting the direction.
Dollar King Alex
🚨 #BTC Technical Analysis – Hourly Frame
I see that Bitcoin has given clear signs of weakness after liquidity was pulled from the red sell zone, with a negative divergence appearing on the RSI indicator.
What happened?
🔴 The price made a new peak or matched the previous peak
🔵 While the RSI created a lower peak
⚠️ This is considered Bearish Divergence indicating weakness in buying momentum.
Also:
✔️ Liquidity was pulled above the peaks
✔️ Strong rejection from the sell zone
✔️ Beginning to lose the bullish momentum
Expected scenario according to my view:
📉 Continued downward correction
📍 Breaking the current support levels could push the price towards:
76K → 75K → the strong buy zone near 74K
🟩 The 74K area is considered a strong Demand Zone, and we may see a good bounce if the price reaches it.
But attention is needed:
Breaking the red zone and holding above it could invalidate the bearish scenario and bring back the bullish momentum again. (Meaning if there is a breakout of the red zone on the chart and we build candles above it, we expect a continuation to the 82K level and cancellation of the downward correction scenario.)
📊 Summary:
The market is now in a very sensitive area, and risk management is more important than predicting the direction.
Dollar King Alex