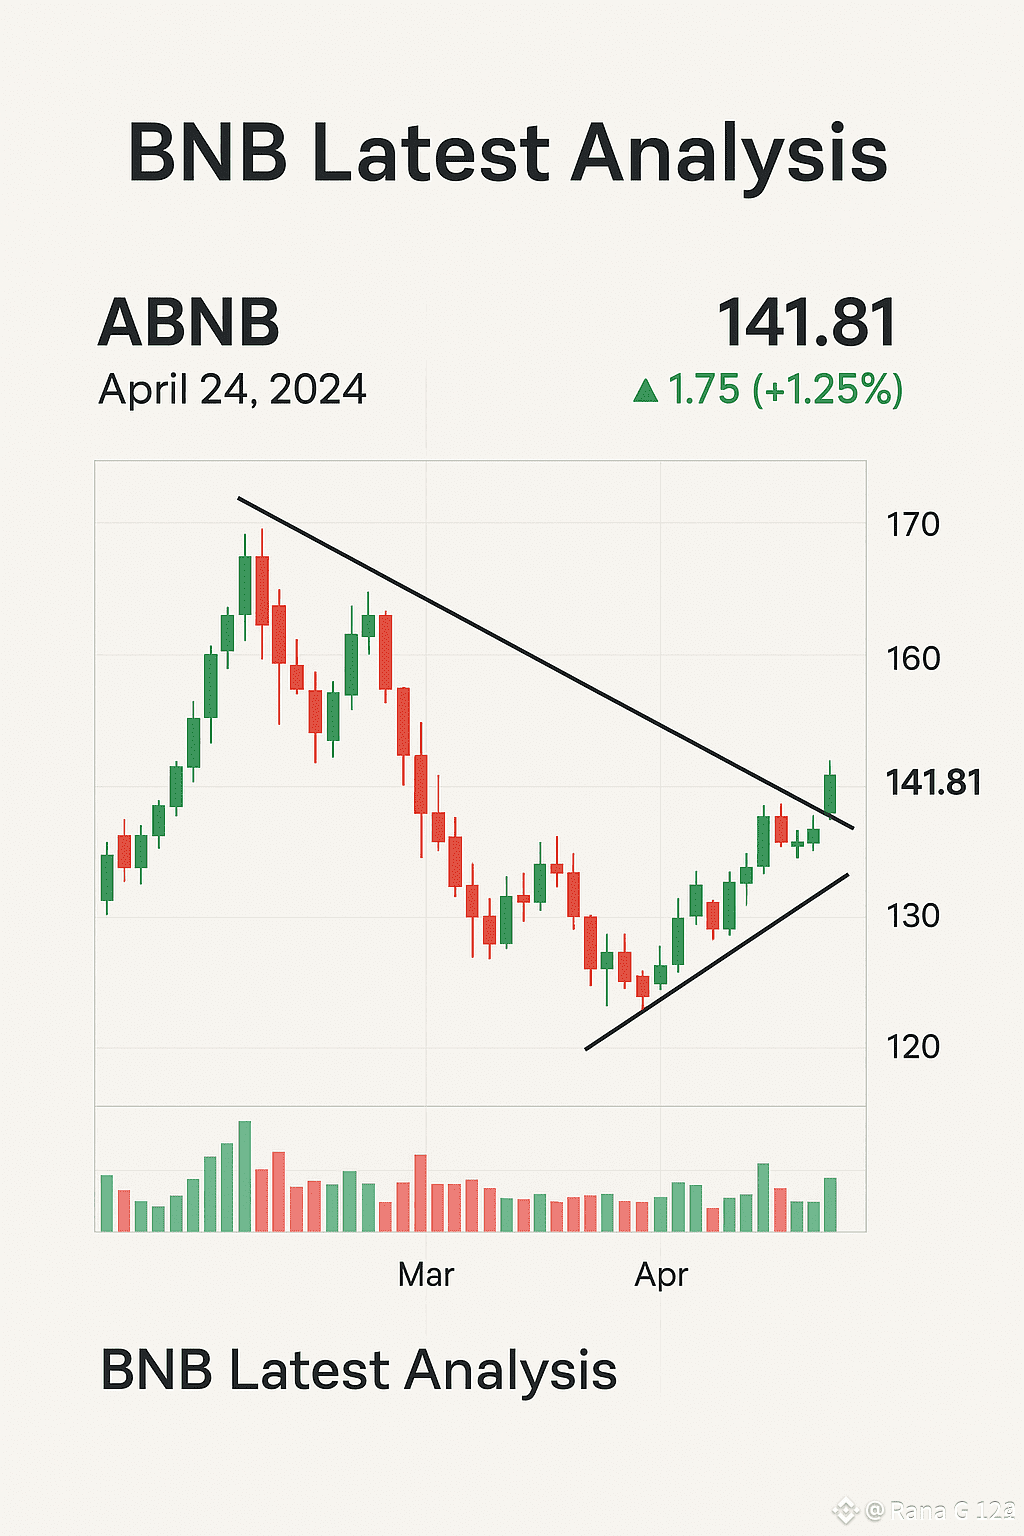
🔍 $BNB Quick Analysis
1. Current Price Action
$BNB is trading around $900, showing a recent drop of ~2–3%.
This area (~$880–$900) looks like a key short-term support level.
2. Technical Outlook
There’s potential for a breakout if BNB clears resistance around $1,145.
If that happens, a target of $1,160–$1,180 is realistic in the short-term.
On the flip side, if BNB breaks downward, some analysts warn of a drop toward $950–$1,000.
3. Fundamental Strength
The BNB Chain is seeing strong real-world use: stablecoins are being deployed, and institutional players hold significant amounts.
According to Standard Chartered, long-term demand could push BNB to ~$1,275 by the end of 2025.
4. Risk Factors
The recent dip suggests traders are cautious: a failure to reclaim $1,145 could lead to deeper pullbacks.
Macro and regulatory risk remain: even with on-chain strength, broader market volatility could keep BNB range-bound.
If $900 support breaks, downside risk may increase and push further corrections.
---
✅ My Take
BNB is at a make-or-break point: the $900 zone is critical.
For traders: a breakout above $1,145 would be a bullish signal; but if that fails, watch for weakness.
For long-term holders: the fundamentals are still solid, and the ecosystem adoption supports a bullish case — but don’t ignore risk.
#BTCVolatility #USJobsData #USStocksForecast2026 #BTC90kBreakingPoint #StrategyBTCPurchase
1. Current Price Action
$BNB is trading around $900, showing a recent drop of ~2–3%.
This area (~$880–$900) looks like a key short-term support level.
2. Technical Outlook
There’s potential for a breakout if BNB clears resistance around $1,145.
If that happens, a target of $1,160–$1,180 is realistic in the short-term.
On the flip side, if BNB breaks downward, some analysts warn of a drop toward $950–$1,000.
3. Fundamental Strength
The BNB Chain is seeing strong real-world use: stablecoins are being deployed, and institutional players hold significant amounts.
According to Standard Chartered, long-term demand could push BNB to ~$1,275 by the end of 2025.
4. Risk Factors
The recent dip suggests traders are cautious: a failure to reclaim $1,145 could lead to deeper pullbacks.
Macro and regulatory risk remain: even with on-chain strength, broader market volatility could keep BNB range-bound.
If $900 support breaks, downside risk may increase and push further corrections.
---
✅ My Take
BNB is at a make-or-break point: the $900 zone is critical.
For traders: a breakout above $1,145 would be a bullish signal; but if that fails, watch for weakness.
For long-term holders: the fundamentals are still solid, and the ecosystem adoption supports a bullish case — but don’t ignore risk.
#BTCVolatility #USJobsData #USStocksForecast2026 #BTC90kBreakingPoint #StrategyBTCPurchase