


As someone who has been investing in stocks for over 15 years, I have gone from being naive in the beginning to experiencing the ups and downs of the stock market. I have developed a strong mindset, able to remain calm and composed even when stuck in a losing position.
Today, I will share with you the situations in which I do not buy. The content of this article is full of valuable insights. If you do not plan to leave the stock market in the next few years and want to change your losing situation, then I suggest you read it carefully and save it!
1. Do not buy stocks that are in a downtrend, especially those that are declining steadily. If the stock price is long-term below the 10 or 20-day moving average, do not buy until a bottom is confirmed. In a market where the strong remain strong, do not buy any stocks that are in a downtrend.
2. When the stock price suddenly releases a huge volume after rising to a high level, definitely do not touch it!
It is highly likely that the main force has started to run away; otherwise, such a large volume of chips would not have been concentrated and released. The chips have been exchanged from the main players to the chasing retail investors, and the subsequent trend is predictable.
3. If a stock's valley price enters the main rising wave, then other indicators do not need to be looked at, only trading volume matters.
If trading volume remains steady or gradually shrinks, it can be held; if it expands, it is time to exit; if there is no expansion, it indicates that large funds have not exited. Since they are still in, and it's in the main rising wave phase, it will only continue to rise.
4. Do not buy stocks that have realized good news; after good news is realized, it is negative. The stock has already risen before the good news, and after the news comes out, it is likely at the end, and the main force begins to sell. Do not buy at this time.
5. Do not buy stocks after a short-term surge. It is well known that regardless of the stock, it will not keep rising indefinitely and will have pullbacks. Short-term surges accumulate significant risks, especially if there is a limit-up without sufficient turnover; the chips have not exchanged hands, and numerous profit-taking shares above make the subsequent funds difficult to keep up, easily forming a downward trend. At this time, we need to pay more attention and avoid chasing high.
6. Do not buy stocks where major shareholders are reducing their holdings. Companies sometimes have major shareholders reduce their holdings for certain reasons. When major shareholders who hold a large number of chips sell their shares, it has a significant impact on the market, indicating that the company is likely facing some issues, and we should not take over at this time.
7. There is an important rule in the stock market: the market will prove that most people's views are wrong. Therefore, when everyone thinks a stock is good, it is often a smokescreen released by the main force. When everyone thinks the market can rise significantly, it often indicates a peak!
If you think your intuition is low and do not know how to choose, how do you judge a quality stock?
8. Do not buy any problematic stocks, such as those with fundamental issues, continuous annual losses, or companies experiencing adverse events. Avoid buying, especially for companies with financial fraud. A company with issues may not rise immediately, but a company with problems has a high probability of decline. Try to avoid such situations.
9. Do not buy stocks that break important support platforms, regardless of whether they will rise again afterward. Breaking important support platforms in the short term will first lead to a collective pessimism in the market, making it very difficult to rise in the short term. Secondly, it is highly likely that the main force has already escaped. Entering the market at this time is like stepping into an infinite underground vault.
10. From a technical analysis perspective, do not buy stocks where all technical indicators are showing weakness, such as MACD, KDJ, and moving averages diverging upwards, etc. It is essential to avoid short-term risks. If a large volume appears at a high level exceeding 10, it indicates that a firm signal is quite clear, and efforts should be made to avoid risks as much as possible.
11. Analyzing from the turnover rate, if the stock price shows high turnover at a high level, it indicates that the main force has shifted from the main players to retail investors, which means the main force has already escaped at a high level. If it exceeds 10%, one should start to pay attention to the possibility of escape; if it exceeds 25%, then one should not buy. If it is below 1%, one should not buy either, as this indicates that no one is paying attention, the popularity is low, and the price fluctuations will not be significant, wasting market opportunities.
One: What is KDJ?
In stock analysis, the KDJ indicator is a frequently used technical analysis indicator. The Chinese name of the KDJ indicator is 'Random Index,' which was invented by the American master George Lane in the 1950s, originally originating from the futures market and gradually applied to the stock market.
KDJ is an indicator of overbought and oversold conditions, assessing the high and low levels of stock prices. Based on the values of KDJ, we divide the KDJ area into
1. Overbought area: K, D, and J values below 20 are considered the oversold area, which is a buy signal.
2. Oversold area: K, D, and J values above 80 are considered the overbought area, which is a sell signal.
3. Floating area: K, D, and J values in the range of 20-80 are considered the floating area, and it is advisable to observe.
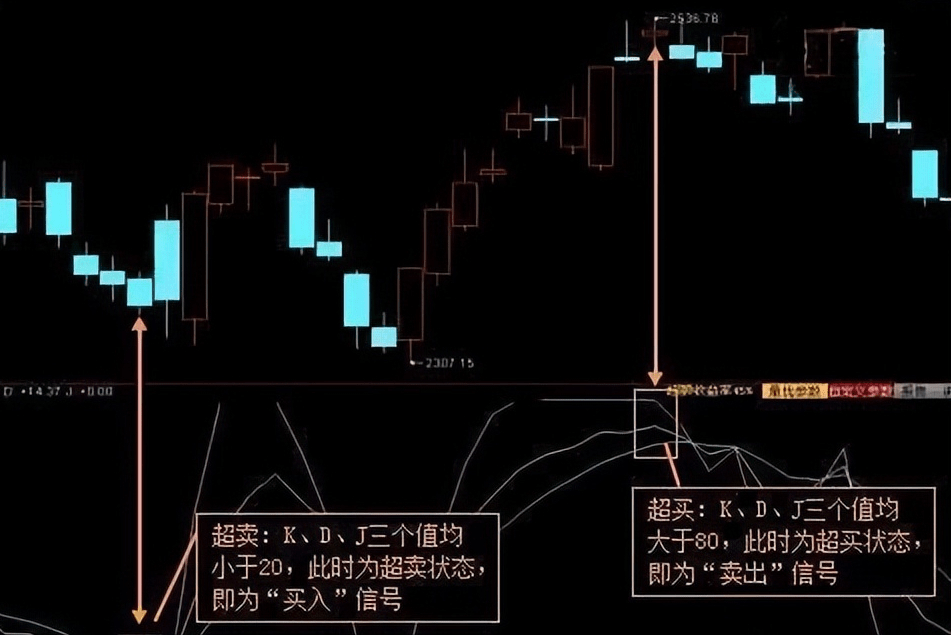
If we are talking about short-term stock trading, the first indicator we should think of is the KDJ indicator. However, the KDJ indicator that comes with the system has a certain lagging nature, so to easily profit, we need to make the KDJ indicator more accurate.
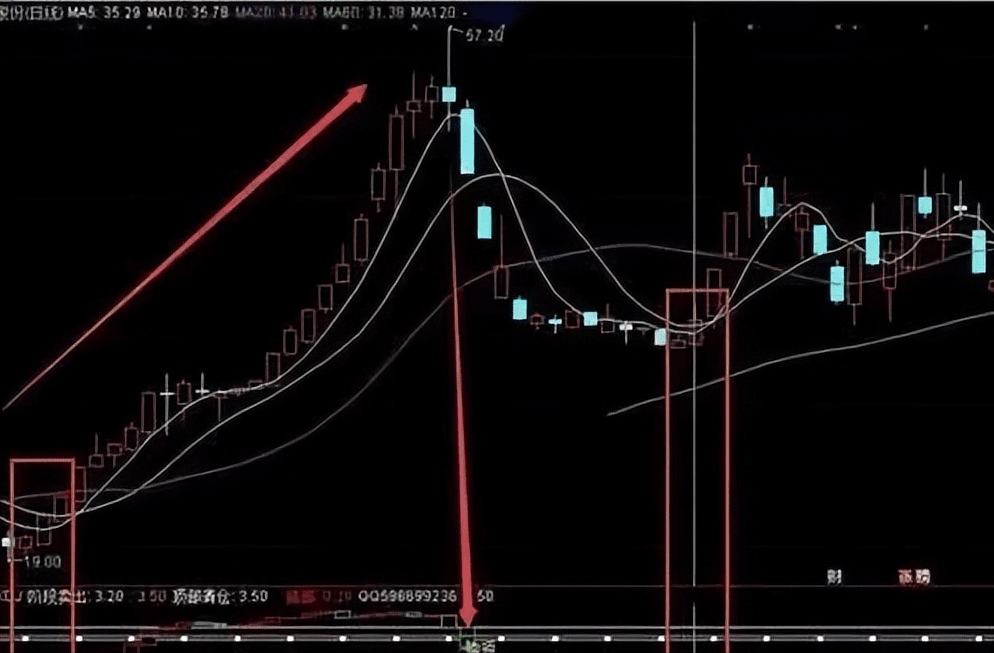
The KDJ indicator provides accurate judgments for buying the bottom and escaping the top. Just follow the operations above for short-term trading!
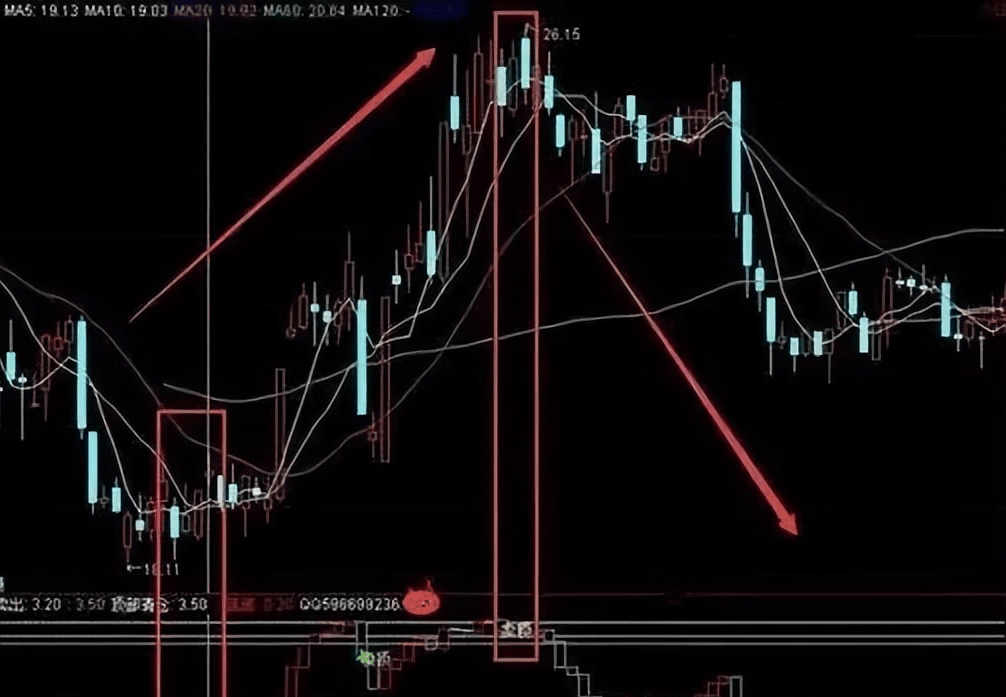
Here are the bottom-buying line and top-escaping line. Once the stock price reaches the bottom-buying line indicating to buy, one can participate directly; once the stock price reaches the top-escaping line indicating to escape, we should sell at the peak in time. Can we still not make money by doing this?
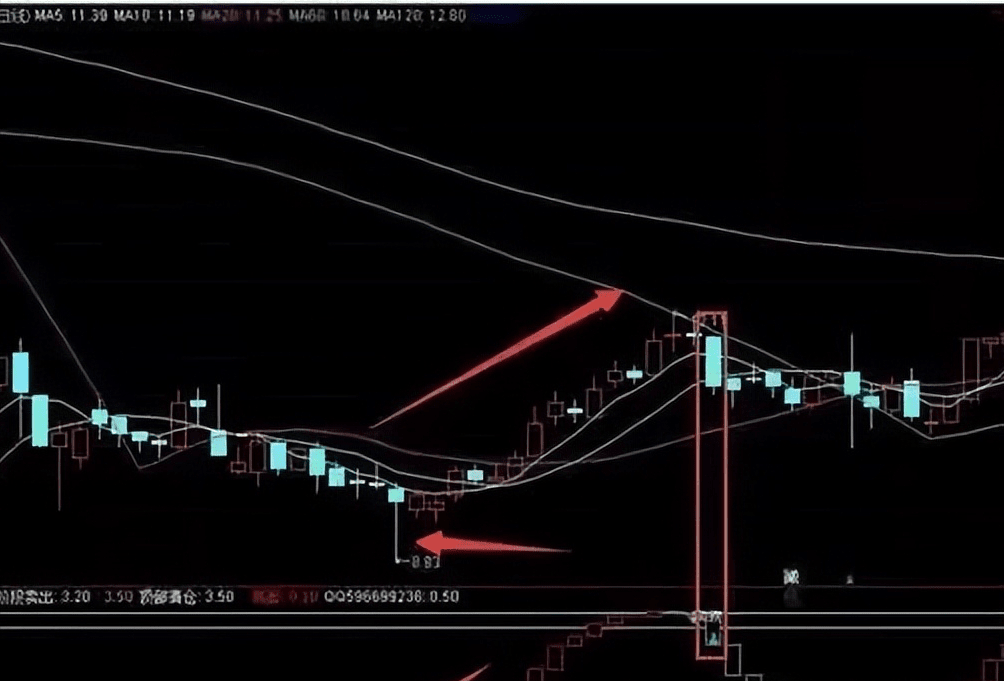
To trade stocks, one must have a methodology; if one operates blindly, the only outcome is loss, regardless of whether you use KDJ, MACD, or other indicators. As long as you focus on studying, how far can you be from making money?
In the stock market, the KDJ technical indicator is one of the commonly used technical indicators, where the KDJ technical indicator can observe whether there is divergence between the indicator and the price based on the market target price.
Two: What does KDJ indicator divergence mean?
First of all, investors can understand the divergence pattern of indicators as the technical indicators deviating from the predetermined development trajectory, appearing in counter-trend patterns of market prices; divergences of indicators often occur in the market.
The KDJ technical indicator divergence is generally divided into two types: bottom divergence and top divergence.
1. KDJ indicator bottom divergence.
Bottom divergence generally occurs in the phase bottom area of the target price, where the price trend in the K-line chart is in a downward trend, with prices continuing to decline.
However, when the KDJ technical indicator shows an upward rebound trend from around the 0-20 value zone, the market's target price gradually declines, but the KDJ indicator gradually recovers. This belongs to the KDJ bottom divergence trend.
In the trading process, the KDJ bottom divergence technical pattern is a reference signal for trend reversal and stock buying opportunities.
If the market is in a strong upward trend and the KDJ indicator shows a bottom divergence technical pattern, the J line (purple line) crossing above the D line (yellow line) and K line (white line) forms a three-line upward crossover, indicating that the reference buying point of the indicator is relatively strong.
Conversely, if the market is in a downward trend and the KDJ indicator shows a bottom divergence, it needs to be observed multiple times along with the indicator as well as market trading volume and market enthusiasm to gradually judge the effectiveness of the technical pattern and avoid false divergence situations.
2. KDJ indicator top divergence
Top divergence generally occurs in the phased top area of the target price, where the price trend in the K-line chart is in an upward trend, with prices continuously rising.
However, when the KDJ technical indicator shows a reversal downward trend from around the 100-80 value zone, the market's target price gradually rises, but the KDJ indicator gradually declines. This belongs to the KDJ top divergence trend.
In the trading process, the KDJ top divergence technical pattern is a risk reference signal for selling stocks and trend reversal.
If the market is in a weak downward trend and the KDJ indicator shows a top divergence technical pattern, the J line (purple line) crosses below the D line (yellow line) and the K line (white line) forms a three-line downward crossover, indicating that the reference selling point of the indicator is relatively strong.
Conversely, if the market is in an upward trend and the KDJ indicator shows a top divergence, investors need to pay attention to whether the market trading volume and market enthusiasm have gradually decreased, and whether the trading volume and market enthusiasm have shown signs of gradual reduction.
Investors need to gradually observe and test the effectiveness of the indicator to avoid false divergence situations.
Overall, in observing the bottom divergence and top divergence patterns in the KDJ technical chart.
Once the above effective technical patterns appear, investors need to pay extra attention to the market or individual stock conditions, preparing in advance for risks or opportunities.
However, investors need to be aware that there are no perfect technical indicators or technical patterns in the market; there will always be some misleading information.
It is necessary to combine other indicators and market conditions as well as individual stock situations for reference to improve the success rate of investments.
Three: KDJ divergence phenomenon allows easy top escape and bottom buying.
1. If the stock price reaches a new high, but the J value does not reach a new high, this is a top divergence, and one should sell.
2. If the stock price reaches a new low, but the J value does not reach a new low, this is a bottom divergence, and one should buy.
3. If the stock price does not reach a new high, but the J value reaches a new high, this is a top divergence, and one should sell.
4. If the stock price does not reach a new low, but the J value reaches a new low, this is a bottom divergence, and one should buy.
Four: Classic KDJ stock selection techniques.
1. Weekly KDJ 'high position aerial turning' buying
The high position aerial turning refers to: after the first death cross of the weekly KDJ at a high position, the weekly K line descends above 50 and then turns upward to form a golden cross with the D line (if it has not yet formed a golden cross at Friday's close) or just formed a golden cross, thus leading to another wave of upward trend. The conditions that this method must meet are:
① After the first death cross of the weekly KDJ at a high position, the weekly K line descends to above 50, turns upward, and is about to form a golden cross with D line (not yet formed a golden cross) or just formed a golden cross.
② The stock price is running strongly above the 20-week moving average.
③ During this week, the daily KDJ golden cross is on the rise. It should be emphasized that using the weekly KDJ 'high position aerial turning' buying method to buy stocks will lead to a strong rising market that is fast and intense, but it may also be the last wave before reaching the peak. After peaking, there will be a pullback adjustment, and the weekly KDJ will show a high-level second death cross, indicating a significant and prolonged intermediate adjustment in the future market. When applying the weekly KDJ high 'aerial turning' buying method, it is essential to capture good buying opportunities and to grasp the selling profit opportunities to actually take the profits and avoid intermediate adjustments.
The KDJ indicator is mainly applied in three aspects: short-term trend identification, trend reversal judgment, and buy/sell point forecasting.
One: Short-term trend identification.
Compared to other technical indicators, the KDJ indicator is highly volatile and sensitive to stock price changes, thus identifying short-term trends more timely.
The KDJ indicator identifies stock price short-term running trends primarily through the following two methods.
Identifying crossover points for short-term trends.
If the KDJ indicator appears to have golden crosses more than twice (including twice) in succession and the positions of the crossing points are progressively higher, it indicates that the stock price is in a short-term upward trend; conversely, if the KDJ indicator shows death crosses more than twice (including twice) in succession and the positions of the crossing points are progressively lower, it indicates that the stock price is in a short-term downward trend.
Under normal circumstances, when the KDJ indicator is in an upward trend, if curve K breaks the upward trend line, it indicates that the upward trend may end, and short-term traders can consider selling. Similarly, when the KDJ indicator is in a downward trend, if curve K breaks upward through the downward trend line, it indicates that the downward trend may end, and short-term traders can consider entering the market.
As shown in Figure 1-2, the stock price of Jinyi Industry started to rise from the bottom in mid-September 2015, and the KDJ indicator also gradually rose with the stock price fluctuations.
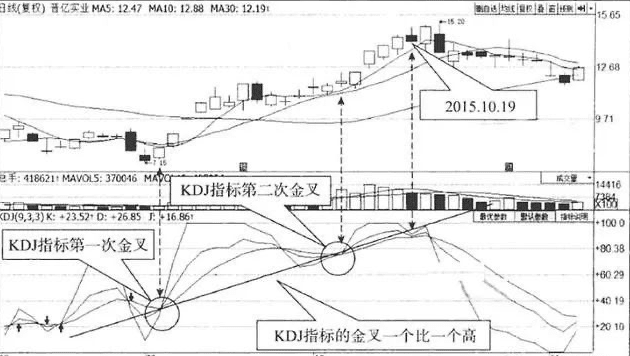
During the stock price fluctuations, the KDJ indicator has shown several golden crosses and death crosses along with the stock price fluctuations, and the points of the golden crosses are progressively higher, indicating that the stock price is currently in a short-term upward trend, and short-term traders only need to hold stocks and wait for the rise.
On October 19, 2015, the KDJ indicators of Jinyi Industry all broke below the upward trend line, indicating that the stock price has short-term weakness potential, and traders can sell part or all of their stocks.
Identifying the slope direction of the indicator lines for short-term trends.
If the curve K in the KDJ indicator runs upward to the right, it indicates that the stock price is in a strong position in the short term, and the line connecting the low points of curve K during the pullback forms the upward trend line; conversely, if curve K slopes downward to the right, it indicates that the stock price is showing weakness in the short term, and the line connecting the high points of curve K during the rebound forms the downward trend line.
When curve K breaks down through the upward trend line from above, it indicates that the stock price has short-term downside risks; when curve K breaks upward through the downward trend line from below, it indicates that the stock price has short-term strength potential.
As shown in Figure 1-3, the stock price of Jinzhongzi Liquor started to rise from a correction low point in mid-May 2015, and the KDJ indicator also gradually rose with the stock price fluctuations.
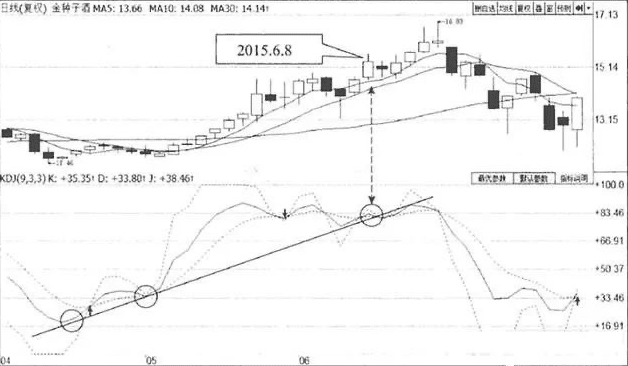
During the stock price's upward fluctuation process, the KDJ indicator's curve K experiences several fluctuations along with the stock price, but the pullback's low points are progressively higher, indicating that the stock price is currently in a short-term upward trend, and short-term traders only need to hold stocks and wait for the rise.
On June 8, 2015, the curve K in the KDJ indicator effectively broke below the upward trend line, indicating that the stock price has short-term weakness potential, and traders can sell part or all of their stocks.
Two: Trend reversal judgment.
There is such a relationship between stock prices and the KDJ indicator: when stock prices rise, the KDJ indicator also rises; when stock prices fall, the KDJ indicator falls.
The upward trend turns into a downward trend.
After a period of rising stock prices, the three curves of the KDJ indicator must have entered a high position, i.e., the overbought area. When the KDJ indicator enters the overbought area, it indicates that the bullish power has reached its peak and is about to enter a recession period. Subsequently, if the KDJ indicator turns down from above, it indicates that the short-term running trend of stock prices will change.
As shown in Figure 1-4, the stock price of Times New Material started a wave of upward trend in the first half of 2015. During the process of stock price fluctuation and rise, the KDJ indicator curve K continuously rose with the stock price and entered the overbought zone in early June 2015. This indicates that the bullish power has reached its peak, and traders should closely monitor the trends of stock prices and the KDJ indicator.
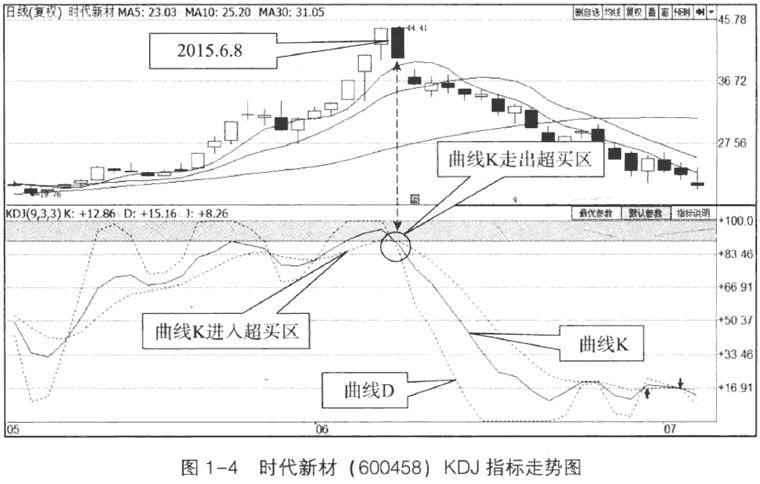
On June 8, 2015, the stock price of Times New Material experienced a significant decline, and the curve K in the KDJ indicator fell from a high point, exiting the overbought zone, indicating that the stock price has short-term weakness risk. At the same time, curve K fell below curve D, further confirming the possibility that the stock price is about to weaken, and short-term traders can consider selling this stock.
The downward trend turns into an upward trend.
After a period of decline in stock prices, the three curves of the KDJ indicator must have entered a low position, i.e., the oversold area. When the KDJ indicator enters the oversold area, it indicates that the bearish power has reached its peak and is about to enter a recession period. Subsequently, if the KDJ indicator turns upward from below, it indicates that the short-term running trend of stock prices will change.
As shown in Figure 1-5, the stock price of Panjiang Co., Ltd. started a wave of decline in early 2014. During the process of stock price volatility and decline, the KDJ indicator curve K continuously fell with the stock price decline and entered the oversold zone at the end of February 2014. This indicates that the short-side power has reached its peak, and traders should closely monitor the trends of stock prices and the KDJ indicator.
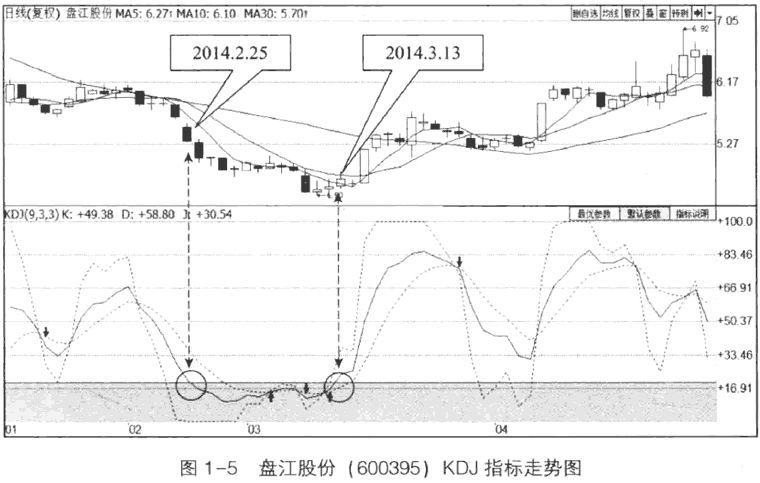
On March 13, 2014, the stock price of Panjiang Co., Ltd. showed a slight increase, and the curve K in the KDJ indicator rose from a low point, exiting the oversold zone, indicating that the stock price has the potential to strengthen in the short term. Meanwhile, curve K broke above curve D, further confirming the viewpoint that the stock price is about to strengthen, and short-term traders can consider buying this stock. Third, buying and selling point analysis.
Similar to other technical indicators, finding the optimal buying and selling points for stocks is also one of the main functions of the KDJ indicator. Due to the outstanding sensitivity of the KDJ indicator, it is often used as the best helper for finding short-term and especially ultra-short-term buying and selling points.
Of course, because the KDJ indicator is overly sensitive, it often issues some invalid signals. Traders must learn to identify valuable trading signals among many invalid signals.
Buy signal identification.
The forms of buy signals issued by the KDJ indicator mainly include: golden cross, curve K turning from the oversold zone, curve K returning from the oversold zone to the normal fluctuation range, etc.
As shown in Figure 1-6, the stock price of China Unicom started a wave of fluctuating decline in mid-January 2015. The KDJ indicator also gradually fell with the stock price fluctuations. In early February, curve K entered the oversold zone, indicating that the stock price is about to show a rebound upward.
On February 9, 2015, curve K exited the oversold zone and simultaneously broke above curve D from below, forming a low-level golden cross. This is a relatively typical buy signal, and traders can buy this stock at this time. Subsequently, this stock experienced a rapid upward trend in the short term.
Sell signal identification
The forms of sell signals issued by the KDJ indicator mainly include: death cross, the curve K turning from the overbought zone, curve K returning from the overbought zone to the regular fluctuation range, etc.
As shown in Figure 1-7, the stock price of Ningbo United started a rebound trend in mid-July 2015. The KDJ indicator also gradually rose along with the stock price fluctuations. By the end of July, the curve K entered the overbought zone, indicating that the stock price is about to reverse downwards.
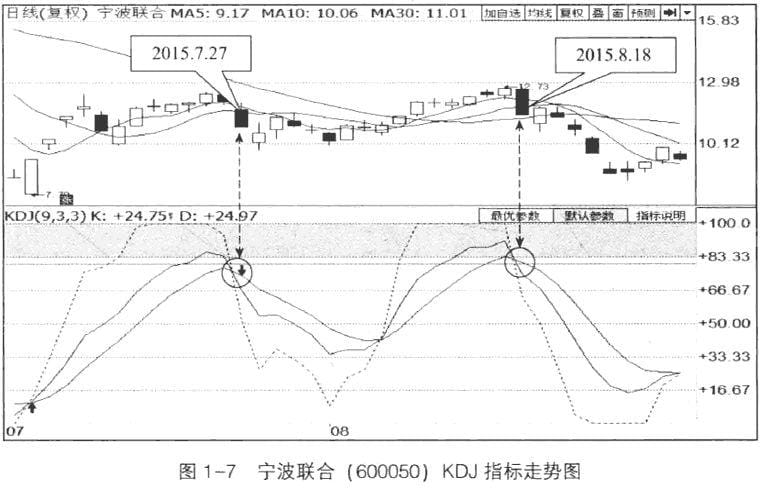
On July 27, 2015, curve K exited the overbought zone and simultaneously broke down below curve D, forming a high-level death cross. This is a relatively typical sell signal, and traders can sell this stock at this time. Subsequently, this stock continuously declined, but after several trading days of adjustment, the stock price rose again, and the KDJ indicator also rose in sync, with curve K re-entering the overbought zone.
On August 18, the curve K exited the overbought zone once again, and re-formed a death cross with curve D. At this point, the sell signal is more reliable, and traders should decisively liquidate the stocks they hold.
Buy or sell points judged based on the KDJ indicator are all of short-term nature, meaning that the buy or sell signals issued by KDJ are only valid within a few trading days. This indicator usually cannot indicate the long-term trend of stock prices.
The root of the KDJ indicator's effectiveness.
In an upward trend, stocks tend to close with bullish candles, meaning the closing price is above the opening price; in a downward trend, stocks tend to close with bearish candles, meaning the closing price is below the opening price. The KDJ indicator identifies the current relative position of stock prices based on the relationship between the opening price and the closing price, thereby predicting the future movement trend of stock prices.
After more than 15 years of stock trading, from hitting rock bottom to supporting a family through trading, it is all due to adhering to these 12 iron rules.
1. The Shanghai Composite Index is below the 5-day line, maintain cash or light positions. Everyone can look back and see that stock prices below the 5-day line often find it difficult to make profits, while those above the 5-day line often find it hard to lose. It's a simple principle, but knowing is easy while doing is difficult, and very few can achieve it.
2. Do not look at any stocks below the 20-day line. Many friends like to enter the market for low absorption, especially for stocks that have long-term adjustments and are at the bottom. In fact, such stocks are often very weak and lack capital support. So do not think you can eat significant profits from a pit; significant profits must be in strong stocks. Conversely, consider: can the probability of eating profits be greater with long-term weak stocks than with strong stocks?
3. Position control. This should be the biggest difference between novice and mature investors! Because the stock market itself has uncertainty, it is said that those who often walk by the river will inevitably get their feet wet. Especially for short-term positions, it is best not to exceed 20%. If things go bad, it is easier to execute stop-loss, and psychologically, it is easier to accept. For those who like to hold a full position in one stock, success makes them happy, but if they fail, they may find it difficult to execute the stop-loss. At this moment in the market, if luck takes precedence, failure is just a matter of time.
4. Learn to observe themes: news, main lines, funds, and support strength. The news is the most stimulating catalyst for market trends, especially for short-term players, it must be paid attention to. The main line is the hottest direction in the market, such as this year's new energy in the first half of the year and the recent 'Xinchuang' concept. Funds mainly look at the net inflow of the main force. Support strength refers to the sustainability of the sector, whether there is capital to lift the stocks in unison.
5. Grasp the emotional low point. It is best to insist on reviewing daily; the market has its own emotions every day, and there are often emotional 'low points' during the day, which may be at the opening or during the morning, afternoon, and closing. Many times, Feige chooses to act at the low point, as the low point can effectively test the strength and weakness of individual stocks. Acting at this time allows one to acquire panic chips brought down by the market's emotions while effectively avoiding chasing high.
6. For short-term trading, focus on the leaders! When short-term players select stocks, it is best to choose the hottest themes of the moment, especially when MACD forms a zero-degree golden cross. The success rate at this time is very high, and the subsequent upward amplitude is generally not small. When accompanied by increasing trading volume, it often leads to the main rising wave stage, and being able to enter is a significant profit.
One tree cannot make a forest, and a lone sail cannot sail far! In the cryptocurrency circle, if you do not have a good circle and do not have first-hand information from the crypto world, it is recommended that you follow Lao Wang, who will guide you to profit and land safely, welcome to join!!! $BTC $ETH